Types of Spatial Data
|
|
|
- Harvey Maximillian Martin
- 6 years ago
- Views:
Transcription
1 Spatial Data
2 Types of Spatial Data Point pattern Point referenced geostatistical Block referenced Raster / lattice / grid Vector / polygon
3 Point Pattern Data Interested in the location of points, not their attributes Degree of aggregation
4 Ripley's K Calculates counts of points as a function of distance bins for each point Combine points together and normalize by area Positive = more points expected than random at that distance Negative = less than expected Intervals by bootstrap Requires def'n of area L d = A i=1 n n j=1, j 1 n n 1 k i, j
5
6 Ripley's K
7 library(spatial) Ripley's K in R ## load library ppregion(xmin,xmax,ymin,ymax) ## define region rk <- Kfn(x,max.distance) ## calculate Ripley's K plot(rk$x,rk$y-rk$x,type='l',xlab="d",ylab="l(d)") ##Plot as L(d) rather than K(d) ## compute and plot interval estimate Ke <- Kenvl(max.distance, nrep, Psim(n)) lines(ke$x,ke$upper-ke$x,lty=2,col="grey") lines(ke$x,ke$lower-ke$x,lty=2,col="grey")
8 Applications and Extensions Irregularly shaped areas Choice of points counted in each sum can vary with categorical attribute Tree maps Juvenile aggregated (dispersal) Intermediate random (DD mortality) Adults are over-dispersed (crown competition)
9 Point Referenced Data Data has a value/attribute plus spatial coordinates but not area Aka geospatial data Origin in mining Usually sampling some underlying continuum Aims: Account for lack of independence in data due to spatial proximity (analogous to time series) Predict the value at some new location (usually a grid / map)
10 Examples of Point Ref Data Soils Moisture, nutrients, ph, texture, etc. Atmospheric or Ocean measurement Surface meteorology (temperature, precip, etc.) CO2, pollutant concentration, salinity, etc. Plot data were size of plot << size of domain Biomass/abundance, presence/absence, richness Invasive species, disease prevalence, etc.
11
12 Geospatial Exploratory Analyses Smoothing & Detrending Autocorrelation Interpolation Linear Inverse distance weighed Geostatistical (Kriging) Many packages in R, will focus on most basic & built in
13 Smoothing / Detrending Objective: Like with time-series, most statistical methods assume stationarity More complicated in 2D (sparse, irregular) Polynomial (in R, library(spatial) ) Fit surface: surf.ls(degree, x, y, z) Project: trmat(surf.obj, xmin, xmax, ymin, ymax, n) Plot: image(tr.obj)

14 Degree 0 Degree 1 Degree 2
15 Spatial autocorrelation correlogram(surf.ls,nbin)
16 NULL model interval estimate by nonparametric bootstrap
17 Variogram Traditionally, autocorrelation in geostatistics has been expressed in terms of a variogram or semivariogram N d Units = variance d = 1 N d i, j d Z i Z j 2 Sill = asymptote Range = distance to asymptote Nugget = variance at lag 0
18 variogram(surf.ls,nbin)
19 Spatial Covariance If C(d) is the spatial covariance C d =COV [Z x, Z x d ] Autocorrelation : Variogram : d =C d /C 0 d =C 0 C d
")
20 Interpolation Objective: predict Z at some new point(s) Often on a grid to make a raster map Linear Simplest if data already on a grid (four corners)

21 Interpolation Bicubic interpolation: cubic analog to bilinear Nearest-Neighbor: Tesselation Voronoi Diagram Triangular irregular network (TIN)
22 Inverse-Distance Weighted Previous methods only used nearest points All are special cases of a weighted average For irregular, often want to use n-nearest points or a fixed search radius (variable number of points) Requires a way of WEIGHTING points as a function of distance Inverse-distance weighted: W ij = 1/d ij Z i = Σ W ij Z j / Σ W ij
23 Spatial Weighted Averages Other alternatives to 1/d (e.g. 1/d 2 ) Major criticisms Choice of weighting function somewhat arbitrary, not connected to properties of the data Does not account for error in interpolation Points further from known points should be more uncertain Interpolation vs smoothing Interpolation always passes exactly though the data points (0 residuals) Smoothing separates trends + residuals
24 Kriging Interpolation based on autocorrelation fcn Requires fitting an autocorrelation model to the variogram or correlogram Provides weight to points based on observed relationship between distance and correlation Requires choice of parametric function Provides mechanism for estimating interpolation error
25 Variogram Models
26 AIC
27

28
29 Step 1: Fit variance model ##correlogram cg <- correlogram(data,nbin) ##fit covariance function expfit <- function(parm){ -sum(dnorm(cg$y, expcov(cg$x,parm[1]), parm[2],log=true)) } efit <- optim(ic,expfit) Built in function for exponential covariance N y f x, 2 log N y f x, 2
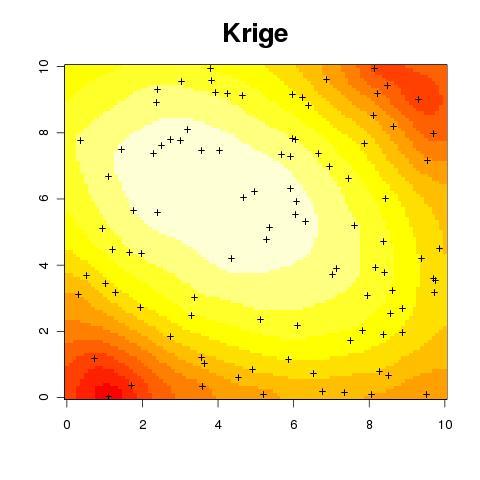
30 Step 2: Krige surface ##detrend accounting for covariance kr <- surf.gls(degree,expcov,data,d=efit$par[1],...) ## matrix prediction (Kriging) pr <- prmat(kr, xmin, xmax, ymin, ymax, n) image(pr) ## matrix error se <- semat(kr, xmin, xmax, ymin, ymax, n) contour(se3,add=true)
31 Anisotropy In addition to STATIONARITY (spatial covariance is the same at all locations), spatial models also assume ISOTROPY, that the spatial covariance is the same in all DIRECTIONS Calculate/fit variogram separately for different directions (angular bins) to account for anisotropy Increases # of parameters, less data points as bins get smaller
32 Flavors of Kriging Simple Kriging: mean = 0 Ordinary Kriging: mean = unknown µ Universial Kriging: mean = polynomial trend Cokriging: inclusion of covariates
33 Limitations of Kriging Assumes the variogram model is known Dropped parameter error Fitting of variogram model: Not done as part of overall model fit Not done on data directly Binned means of all n 2 pairwise differences Detrending and autocorr done separately Sometimes just want non-independence Similar to T.S., OK for EDA but ultimately want to fit whole model at once.
Lab #3 Background Material Quantifying Point and Gradient Patterns
 Lab #3 Background Material Quantifying Point and Gradient Patterns Dispersion metrics Dispersion indices that measure the degree of non-randomness Plot-based metrics Distance-based metrics First-order
I don t have much to say here: data are often sampled this way but we more typically model them in continuous space, or on a graph
 Spatial analysis Huge topic! Key references Diggle (point patterns); Cressie (everything); Diggle and Ribeiro (geostatistics); Dormann et al (GLMMs for species presence/abundance); Haining; (Pinheiro and
11/8/2018. Spatial Interpolation & Geostatistics. Kriging Step 1
 (Z i Z j ) 2 / 2 (Z i Zj) 2 / 2 Semivariance y 11/8/2018 Spatial Interpolation & Geostatistics Kriging Step 1 Describe spatial variation with Semivariogram Lag Distance between pairs of points Lag Mean
Spatial Data Mining. Regression and Classification Techniques
 Spatial Data Mining Regression and Classification Techniques 1 Spatial Regression and Classisfication Discrete class labels (left) vs. continues quantities (right) measured at locations (2D for geographic
Introduction. Semivariogram Cloud
 Introduction Data: set of n attribute measurements {z(s i ), i = 1,, n}, available at n sample locations {s i, i = 1,, n} Objectives: Slide 1 quantify spatial auto-correlation, or attribute dissimilarity
Spatial Interpolation & Geostatistics
 (Z i Z j ) 2 / 2 Spatial Interpolation & Geostatistics Lag Lag Mean Distance between pairs of points 1 y Kriging Step 1 Describe spatial variation with Semivariogram (Z i Z j ) 2 / 2 Point cloud Map 3
Improving Spatial Data Interoperability
 Improving Spatial Data Interoperability A Framework for Geostatistical Support-To To-Support Interpolation Michael F. Goodchild, Phaedon C. Kyriakidis, Philipp Schneider, Matt Rice, Qingfeng Guan, Jordan
Index. Geostatistics for Environmental Scientists, 2nd Edition R. Webster and M. A. Oliver 2007 John Wiley & Sons, Ltd. ISBN:
 Index Akaike information criterion (AIC) 105, 290 analysis of variance 35, 44, 127 132 angular transformation 22 anisotropy 59, 99 affine or geometric 59, 100 101 anisotropy ratio 101 exploring and displaying
An Introduction to Pattern Statistics
 An Introduction to Pattern Statistics Nearest Neighbors The CSR hypothesis Clark/Evans and modification Cuzick and Edwards and controls All events k function Weighted k function Comparative k functions
PRODUCING PROBABILITY MAPS TO ASSESS RISK OF EXCEEDING CRITICAL THRESHOLD VALUE OF SOIL EC USING GEOSTATISTICAL APPROACH
 PRODUCING PROBABILITY MAPS TO ASSESS RISK OF EXCEEDING CRITICAL THRESHOLD VALUE OF SOIL EC USING GEOSTATISTICAL APPROACH SURESH TRIPATHI Geostatistical Society of India Assumptions and Geostatistical Variogram
Introduction to Geostatistics
 Introduction to Geostatistics Abhi Datta 1, Sudipto Banerjee 2 and Andrew O. Finley 3 July 31, 2017 1 Department of Biostatistics, Bloomberg School of Public Health, Johns Hopkins University, Baltimore,
Basics of Point-Referenced Data Models
 Basics of Point-Referenced Data Models Basic tool is a spatial process, {Y (s), s D}, where D R r Chapter 2: Basics of Point-Referenced Data Models p. 1/45 Basics of Point-Referenced Data Models Basic
Areal data. Infant mortality, Auckland NZ districts. Number of plant species in 20cm x 20 cm patches of alpine tundra. Wheat yield
 Areal data Reminder about types of data Geostatistical data: Z(s) exists everyhere, varies continuously Can accommodate sudden changes by a model for the mean E.g., soil ph, two soil types with different
Lecture 5 Geostatistics
 Lecture 5 Geostatistics Lecture Outline Spatial Estimation Spatial Interpolation Spatial Prediction Sampling Spatial Interpolation Methods Spatial Prediction Methods Interpolating Raster Surfaces with
Point-Referenced Data Models
 Point-Referenced Data Models Jamie Monogan University of Georgia Spring 2013 Jamie Monogan (UGA) Point-Referenced Data Models Spring 2013 1 / 19 Objectives By the end of these meetings, participants should
Introduction to Spatial Data and Models
 Introduction to Spatial Data and Models Sudipto Banerjee 1 and Andrew O. Finley 2 1 Biostatistics, School of Public Health, University of Minnesota, Minneapolis, Minnesota, U.S.A. 2 Department of Forestry
Spatial Analysis II. Spatial data analysis Spatial analysis and inference
 Spatial Analysis II Spatial data analysis Spatial analysis and inference Roadmap Spatial Analysis I Outline: What is spatial analysis? Spatial Joins Step 1: Analysis of attributes Step 2: Preparing for
Introduction to Spatial Data and Models
 Introduction to Spatial Data and Models Sudipto Banerjee 1 and Andrew O. Finley 2 1 Department of Forestry & Department of Geography, Michigan State University, Lansing Michigan, U.S.A. 2 Biostatistics,
Soil Moisture Modeling using Geostatistical Techniques at the O Neal Ecological Reserve, Idaho
 Final Report: Forecasting Rangeland Condition with GIS in Southeastern Idaho Soil Moisture Modeling using Geostatistical Techniques at the O Neal Ecological Reserve, Idaho Jacob T. Tibbitts, Idaho State
Models for spatial data (cont d) Types of spatial data. Types of spatial data (cont d) Hierarchical models for spatial data
 Types of spatial data. Types of spatial data (cont d) Hierarchical models for spatial data") Hierarchical models for spatial data Based on the book by Banerjee, Carlin and Gelfand Hierarchical Modeling and Analysis for Spatial Data, 2004. We focus on Chapters 1, 2 and 5. Geo-referenced data arise
Hierarchical models for spatial data Based on the book by Banerjee, Carlin and Gelfand Hierarchical Modeling and Analysis for Spatial Data, 2004. We focus on Chapters 1, 2 and 5. Geo-referenced data arise
Copyright The McGraw-Hill Companies, Inc. Permission required for reproduction or display.
 Chapter 15. SPATIAL INTERPOLATION 15.1 Elements of Spatial Interpolation 15.1.1 Control Points 15.1.2 Type of Spatial Interpolation 15.2 Global Methods 15.2.1 Trend Surface Models Box 15.1 A Worked Example
Spatial Backfitting of Roller Measurement Values from a Florida Test Bed
 Spatial Backfitting of Roller Measurement Values from a Florida Test Bed Daniel K. Heersink 1, Reinhard Furrer 1, and Mike A. Mooney 2 1 Institute of Mathematics, University of Zurich, CH-8057 Zurich 2
Spatial analysis is the quantitative study of phenomena that are located in space.
 c HYON-JUNG KIM, 2016 1 Introduction Spatial analysis is the quantitative study of phenomena that are located in space. Spatial data analysis usually refers to an analysis of the observations in which
Multivariate Geostatistics
 Hans Wackernagel Multivariate Geostatistics An Introduction with Applications Third, completely revised edition with 117 Figures and 7 Tables Springer Contents 1 Introduction A From Statistics to Geostatistics
Geostatistics: Kriging
 Geostatistics: Kriging 8.10.2015 Konetekniikka 1, Otakaari 4, 150 10-12 Rangsima Sunila, D.Sc. Background What is Geostatitics Concepts Variogram: experimental, theoretical Anisotropy, Isotropy Lag, Sill,
7 Geostatistics. Figure 7.1 Focus of geostatistics
 7 Geostatistics 7.1 Introduction Geostatistics is the part of statistics that is concerned with geo-referenced data, i.e. data that are linked to spatial coordinates. To describe the spatial variation
GIST 4302/5302: Spatial Analysis and Modeling
 GIST 4302/5302: Spatial Analysis and Modeling Review Guofeng Cao www.gis.ttu.edu/starlab Department of Geosciences Texas Tech University guofeng.cao@ttu.edu Spring 2016 Course Outlines Spatial Point Pattern
11. Kriging. ACE 492 SA - Spatial Analysis Fall 2003
 11. Kriging ACE 492 SA - Spatial Analysis Fall 2003 c 2003 by Luc Anselin, All Rights Reserved 1 Objectives The goal of this lab is to further familiarize yourself with ESRI s Geostatistical Analyst, extending
Statistícal Methods for Spatial Data Analysis
 Texts in Statistícal Science Statistícal Methods for Spatial Data Analysis V- Oliver Schabenberger Carol A. Gotway PCT CHAPMAN & K Contents Preface xv 1 Introduction 1 1.1 The Need for Spatial Analysis
Classic Time Series Analysis
 Classic Time Series Analysis Concepts and Definitions Let Y be a random number with PDF f Y t ~f,t Define t =E[Y t ] m(t) is known as the trend Define the autocovariance t, s =COV [Y t,y s ] =E[ Y t t
Roger S. Bivand Edzer J. Pebesma Virgilio Gömez-Rubio. Applied Spatial Data Analysis with R. 4:1 Springer
 Roger S. Bivand Edzer J. Pebesma Virgilio Gömez-Rubio Applied Spatial Data Analysis with R 4:1 Springer Contents Preface VII 1 Hello World: Introducing Spatial Data 1 1.1 Applied Spatial Data Analysis
Universitat Autònoma de Barcelona Facultat de Filosofia i Lletres Departament de Prehistòria Doctorat en arqueologia prehistòrica
 Universitat Autònoma de Barcelona Facultat de Filosofia i Lletres Departament de Prehistòria Doctorat en arqueologia prehistòrica FROM MICRO TO MACRO SPATIAL DYNAMICS IN THE VILLAGGIO DELLE MACINE BETWEEN
Spatial and Environmental Statistics
 Spatial and Environmental Statistics Dale Zimmerman Department of Statistics and Actuarial Science University of Iowa January 17, 2019 Dale Zimmerman (UIOWA) Spatial and Environmental Statistics January
ENGRG Introduction to GIS
 ENGRG 59910 Introduction to GIS Michael Piasecki October 13, 2017 Lecture 06: Spatial Analysis Outline Today Concepts What is spatial interpolation Why is necessary Sample of interpolation (size and pattern)
A GEOSTATISTICAL APPROACH TO PREDICTING A PHYSICAL VARIABLE THROUGH A CONTINUOUS SURFACE
 Katherine E. Williams University of Denver GEOG3010 Geogrpahic Information Analysis April 28, 2011 A GEOSTATISTICAL APPROACH TO PREDICTING A PHYSICAL VARIABLE THROUGH A CONTINUOUS SURFACE Overview Data
Gridding of precipitation and air temperature observations in Belgium. Michel Journée Royal Meteorological Institute of Belgium (RMI)
") Gridding of precipitation and air temperature observations in Belgium Michel Journée Royal Meteorological Institute of Belgium (RMI) Gridding of meteorological data A variety of hydrologic, ecological,
Gridding of precipitation and air temperature observations in Belgium Michel Journée Royal Meteorological Institute of Belgium (RMI) Gridding of meteorological data A variety of hydrologic, ecological,
Chapter 4 - Fundamentals of spatial processes Lecture notes
 TK4150 - Intro 1 Chapter 4 - Fundamentals of spatial processes Lecture notes Odd Kolbjørnsen and Geir Storvik January 30, 2017 STK4150 - Intro 2 Spatial processes Typically correlation between nearby sites
Intensity Analysis of Spatial Point Patterns Geog 210C Introduction to Spatial Data Analysis
 Intensity Analysis of Spatial Point Patterns Geog 210C Introduction to Spatial Data Analysis Chris Funk Lecture 5 Topic Overview 1) Introduction/Unvariate Statistics 2) Bootstrapping/Monte Carlo Simulation/Kernel
GEOSTATISTICS. Dr. Spyros Fountas
 GEOSTATISTICS Dr. Spyros Fountas Northing (m) 140550 140450 140350 Trent field Disturbed area Andover 140250 Panholes 436950 437050 437150 437250 437350 Easting (m) Trent Field Westover Farm (Blackmore,
Assessing the covariance function in geostatistics
 Statistics & Probability Letters 52 (2001) 199 206 Assessing the covariance function in geostatistics Ana F. Militino, M. Dolores Ugarte Departamento de Estadstica e Investigacion Operativa, Universidad
Spatial Statistics or Why Spatial is Special?
 Spatial Statistics or Why Spatial is Special? Curdin Derungs, GISLab 20.10.2017 Seite 1 Spatial is special Spatial is special Longley et al s (2011) spatial is special -list: 20.10.2017 Seite 3 Spatial
Spatial Analysis 1. Introduction
 Spatial Analysis 1 Introduction Geo-referenced Data (not any data) x, y coordinates (e.g., lat., long.) ------------------------------------------------------ - Table of Data: Obs. # x y Variables -------------------------------------
Report on Kriging in Interpolation
 Tabor Reedy ENVS421 3/12/15 Report on Kriging in Interpolation In this project I explored use of the geostatistical analyst extension and toolbar in the process of creating an interpolated surface through
OFTEN we need to be able to integrate point attribute information
 ALLAN A NIELSEN: GEOSTATISTICS AND ANALYSIS OF SPATIAL DATA 1 Geostatistics and Analysis of Spatial Data Allan A Nielsen Abstract This note deals with geostatistical measures for spatial correlation, namely
Kriging Luc Anselin, All Rights Reserved
 Kriging Luc Anselin Spatial Analysis Laboratory Dept. Agricultural and Consumer Economics University of Illinois, Urbana-Champaign http://sal.agecon.uiuc.edu Outline Principles Kriging Models Spatial Interpolation
Spatial Data Analysis in Archaeology Anthropology 589b. Kriging Artifact Density Surfaces in ArcGIS
 Spatial Data Analysis in Archaeology Anthropology 589b Fraser D. Neiman University of Virginia 2.19.07 Spring 2007 Kriging Artifact Density Surfaces in ArcGIS 1. The ingredients. -A data file -- in.dbf
SUT WA Research Night
 SUT WA Research Night An introduction to acoustic seafloor observation and geostatistical data interpolation Elizabeth Mair BSc (GIS) Honours Curtin University Contents Project Introduction Methodology
Geostatistical Interpolation: Kriging and the Fukushima Data. Erik Hoel Colligium Ramazzini October 30, 2011
 Geostatistical Interpolation: Kriging and the Fukushima Data Erik Hoel Colligium Ramazzini October 30, 2011 Agenda Basics of geostatistical interpolation Fukushima radiation Database Web site Geoanalytic
The Matrix Reloaded: Computations for large spatial data sets
 The Matrix Reloaded: Computations for large spatial data sets The spatial model Solving linear systems Matrix multiplication Creating sparsity Doug Nychka National Center for Atmospheric Research Sparsity,
Areal Unit Data Regular or Irregular Grids or Lattices Large Point-referenced Datasets
 Areal Unit Data Regular or Irregular Grids or Lattices Large Point-referenced Datasets Is there spatial pattern? Chapter 3: Basics of Areal Data Models p. 1/18 Areal Unit Data Regular or Irregular Grids
Concepts and Applications of Kriging. Eric Krause
 Concepts and Applications of Kriging Eric Krause Sessions of note Tuesday ArcGIS Geostatistical Analyst - An Introduction 8:30-9:45 Room 14 A Concepts and Applications of Kriging 10:15-11:30 Room 15 A
Lecture 8. Spatial Estimation
 Lecture 8 Spatial Estimation Lecture Outline Spatial Estimation Spatial Interpolation Spatial Prediction Sampling Spatial Interpolation Methods Spatial Prediction Methods Interpolating Raster Surfaces
Performance Analysis of Some Machine Learning Algorithms for Regression Under Varying Spatial Autocorrelation
 Performance Analysis of Some Machine Learning Algorithms for Regression Under Varying Spatial Autocorrelation Sebastian F. Santibanez Urban4M - Humboldt University of Berlin / Department of Geography 135
Data Break 8: Kriging the Meuse RiverBIOS 737 Spring 2004 p.1/27
 Data Break 8: Kriging the Meuse River BIOS 737 Spring 2004 Data Break 8: Kriging the Meuse RiverBIOS 737 Spring 2004 p.1/27 Meuse River: Reminder library(gstat) Data included in gstat library. data(meuse)
A robust statistically based approach to estimating the probability of contamination occurring between sampling locations
 A robust statistically based approach to estimating the probability of contamination occurring between sampling locations Peter Beck Principal Environmental Scientist Image placeholder Image placeholder
Geostatistics for Gaussian processes
 Introduction Geostatistical Model Covariance structure Cokriging Conclusion Geostatistics for Gaussian processes Hans Wackernagel Geostatistics group MINES ParisTech http://hans.wackernagel.free.fr Kernels
Extent of Radiological Contamination in Soil at Four Sites near the Fukushima Daiichi Power Plant, Japan (ArcGIS)
") Extent of Radiological Contamination in Soil at Four Sites near the Fukushima Daiichi Power Plant, Japan (ArcGIS) Contact: Ted Parks, AMEC Foster Wheeler, theodore.parks@amecfw.com, Alex Mikszewski, AMEC
Extent of Radiological Contamination in Soil at Four Sites near the Fukushima Daiichi Power Plant, Japan (ArcGIS) Contact: Ted Parks, AMEC Foster Wheeler, theodore.parks@amecfw.com, Alex Mikszewski, AMEC
Spatial analysis. 0 move the objects and the results change
 0 Outline: Roadmap 0 What is spatial analysis? 0 Transformations 0 Introduction to spatial interpolation 0 Classification of spatial interpolation methods 0 Interpolation methods 0 Areal interpolation
Space-time data. Simple space-time analyses. PM10 in space. PM10 in time
 Space-time data Observations taken over space and over time Z(s, t): indexed by space, s, and time, t Here, consider geostatistical/time data Z(s, t) exists for all locations and all times May consider
Investigation of Monthly Pan Evaporation in Turkey with Geostatistical Technique
 Investigation of Monthly Pan Evaporation in Turkey with Geostatistical Technique Hatice Çitakoğlu 1, Murat Çobaner 1, Tefaruk Haktanir 1, 1 Department of Civil Engineering, Erciyes University, Kayseri,
Exploring the World of Ordinary Kriging. Dennis J. J. Walvoort. Wageningen University & Research Center Wageningen, The Netherlands
 Exploring the World of Ordinary Kriging Wageningen University & Research Center Wageningen, The Netherlands July 2004 (version 0.2) What is? What is it about? Potential Users a computer program for exploring
Dale L. Zimmerman Department of Statistics and Actuarial Science, University of Iowa, USA
 SPATIAL STATISTICS Dale L. Zimmerman Department of Statistics and Actuarial Science, University of Iowa, USA Keywords: Geostatistics, Isotropy, Kriging, Lattice Data, Spatial point patterns, Stationarity
ENVIRONMENTAL MONITORING Vol. II - Geostatistical Analysis of Monitoring Data - Mark Dowdall, John O Dea GEOSTATISTICAL ANALYSIS OF MONITORING DATA
 GEOSTATISTICAL ANALYSIS OF MONITORING DATA Mark Dowdall Norwegian Radiation Protection Authority, Environmental Protection Unit, Polar Environmental Centre, Tromso, Norway John O Dea Institute of Technology,
Spatial-Temporal Modeling of Active Layer Thickness
 Spatial-Temporal Modeling of Active Layer Thickness Qian Chen Advisor : Dr. Tatiyana Apanasovich Department of Statistics The George Washington University Abstract The objective of this study is to provide
Concepts and Applications of Kriging. Eric Krause Konstantin Krivoruchko
 Concepts and Applications of Kriging Eric Krause Konstantin Krivoruchko Outline Introduction to interpolation Exploratory spatial data analysis (ESDA) Using the Geostatistical Wizard Validating interpolation
Statistical Learning
 Statistical Learning Supervised learning Assume: Estimate: quantity of interest function predictors to get: error Such that: For prediction and/or inference Model fit vs. Model stability (Bias variance
Comparison of rainfall distribution method
 Team 6 Comparison of rainfall distribution method In this section different methods of rainfall distribution are compared. METEO-France is the French meteorological agency, a public administrative institution
On dealing with spatially correlated residuals in remote sensing and GIS
 On dealing with spatially correlated residuals in remote sensing and GIS Nicholas A. S. Hamm 1, Peter M. Atkinson and Edward J. Milton 3 School of Geography University of Southampton Southampton SO17 3AT
2.6 Two-dimensional continuous interpolation 3: Kriging - introduction to geostatistics. References - geostatistics. References geostatistics (cntd.
 .6 Two-dimensional continuous interpolation 3: Kriging - introduction to geostatistics Spline interpolation was originally developed or image processing. In GIS, it is mainly used in visualization o spatial
The Matrix Reloaded: Computations for large spatial data sets
 The Matrix Reloaded: Computations for large spatial data sets Doug Nychka National Center for Atmospheric Research The spatial model Solving linear systems Matrix multiplication Creating sparsity Sparsity,
An Introduction to Spatial Statistics. Chunfeng Huang Department of Statistics, Indiana University
 An Introduction to Spatial Statistics Chunfeng Huang Department of Statistics, Indiana University Microwave Sounding Unit (MSU) Anomalies (Monthly): 1979-2006. Iron Ore (Cressie, 1986) Raw percent data
Geog 210C Spring 2011 Lab 6. Geostatistics in ArcMap
 Geog 210C Spring 2011 Lab 6. Geostatistics in ArcMap Overview In this lab you will think critically about the functionality of spatial interpolation, improve your kriging skills, and learn how to use several
REN R 690 Lab Geostatistics Lab
 REN R 690 Lab Geostatistics Lab The objective of this lab is to try out some basic geostatistical tools with R. Geostatistics is used primarily in the resource and environmental areas for estimation, uncertainty
Lesson 6 Maximum Likelihood: Part III. (plus a quick bestiary of models)
") Lesson 6 Maximum Likelihood: Part III (plus a quick bestiary of models) Homework You want to know the density of fish in a set of experimental ponds You observe the following counts in ten ponds: 5,6,7,3,6,5,8,4,4,3
Lesson 6 Maximum Likelihood: Part III (plus a quick bestiary of models) Homework You want to know the density of fish in a set of experimental ponds You observe the following counts in ten ponds: 5,6,7,3,6,5,8,4,4,3
Geostatistics in Hydrology: Kriging interpolation
 Chapter Geostatistics in Hydrology: Kriging interpolation Hydrologic properties, such as rainfall, aquifer characteristics (porosity, hydraulic conductivity, transmissivity, storage coefficient, etc.),
Contents 1 Introduction 2 Statistical Tools and Concepts
 1 Introduction... 1 1.1 Objectives and Approach... 1 1.2 Scope of Resource Modeling... 2 1.3 Critical Aspects... 2 1.3.1 Data Assembly and Data Quality... 2 1.3.2 Geologic Model and Definition of Estimation
University of California, Los Angeles Department of Statistics. Effect of variogram parameters on kriging weights
 University of California, Los Angeles Department of Statistics Statistics C173/C273 Instructor: Nicolas Christou Effect of variogram parameters on kriging weights We will explore in this document how the
Fast kriging of large data sets with Gaussian Markov random fields
 Computational Statistics & Data Analysis 52 (2008) 233 2349 www.elsevier.com/locate/csda Fast kriging of large data sets with Gaussian Markov random fields Linda Hartman a,,, Ola Hössjer b,2 a Centre for
Luc Anselin Spatial Analysis Laboratory Dept. Agricultural and Consumer Economics University of Illinois, Urbana-Champaign
 GIS and Spatial Analysis Luc Anselin Spatial Analysis Laboratory Dept. Agricultural and Consumer Economics University of Illinois, Urbana-Champaign http://sal.agecon.uiuc.edu Outline GIS and Spatial Analysis
SPATIAL-TEMPORAL TECHNIQUES FOR PREDICTION AND COMPRESSION OF SOIL FERTILITY DATA
 SPATIAL-TEMPORAL TECHNIQUES FOR PREDICTION AND COMPRESSION OF SOIL FERTILITY DATA D. Pokrajac Center for Information Science and Technology Temple University Philadelphia, Pennsylvania A. Lazarevic Computer
BAYESIAN MODEL FOR SPATIAL DEPENDANCE AND PREDICTION OF TUBERCULOSIS
 BAYESIAN MODEL FOR SPATIAL DEPENDANCE AND PREDICTION OF TUBERCULOSIS Srinivasan R and Venkatesan P Dept. of Statistics, National Institute for Research Tuberculosis, (Indian Council of Medical Research),
Beta-Binomial Kriging: An Improved Model for Spatial Rates
 Available online at www.sciencedirect.com ScienceDirect Procedia Environmental Sciences 27 (2015 ) 30 37 Spatial Statistics 2015: Emerging Patterns - Part 2 Beta-Binomial Kriging: An Improved Model for
REML Estimation and Linear Mixed Models 4. Geostatistics and linear mixed models for spatial data
 REML Estimation and Linear Mixed Models 4. Geostatistics and linear mixed models for spatial data Sue Welham Rothamsted Research Harpenden UK AL5 2JQ December 1, 2008 1 We will start by reviewing the principles
Spatial Analysis 2. Spatial Autocorrelation
 Spatial Analysis 2 Spatial Autocorrelation Spatial Autocorrelation a relationship between nearby spatial units of the same variable If, for every pair of subareas i and j in the study region, the drawings
ArcGIS for Geostatistical Analyst: An Introduction. Steve Lynch and Eric Krause Redlands, CA.
 ArcGIS for Geostatistical Analyst: An Introduction Steve Lynch and Eric Krause Redlands, CA. Outline - What is geostatistics? - What is Geostatistical Analyst? - Spatial autocorrelation - Geostatistical
Lesson 5 Practice Problems
 Name: Date: Lesson 5 Section 5.1: Linear Functions vs. Exponential Functions 1. Complete the table below. Function Linear or Exponential? Linear: Increasing or Decreasing? Exponential: Growth or Decay?
Kriging of spatial-temporal water vapor data
 Kriging of spatial-temporal water vapor data Roderik Lindenbergh, Maxim Keshin, Hans van der Marel and Ramon Hanssen Delft Institute of Earth Observation and Space Systems, Delft University of Technology,
Uncertainty Quantification and Validation Using RAVEN. A. Alfonsi, C. Rabiti. Risk-Informed Safety Margin Characterization. https://lwrs.inl.
 Risk-Informed Safety Margin Characterization Uncertainty Quantification and Validation Using RAVEN https://lwrs.inl.gov A. Alfonsi, C. Rabiti North Carolina State University, Raleigh 06/28/2017 Assumptions
University of California, Los Angeles Department of Statistics. Universal kriging
 University of California, Los Angeles Department of Statistics Statistics C173/C273 Instructor: Nicolas Christou Universal kriging The Ordinary Kriging (OK) that was discussed earlier is based on the constant
ENVIRONMENTAL DATA ANALYSIS WILLIAM MENKE JOSHUA MENKE WITH MATLAB COPYRIGHT 2011 BY ELSEVIER, INC. ALL RIGHTS RESERVED.
 ENVIRONMENTAL DATA ANALYSIS WITH MATLAB WILLIAM MENKE PROFESSOR OF EARTH AND ENVIRONMENTAL SCIENCE COLUMBIA UNIVERSITY JOSHUA MENKE SOFTWARE ENGINEER JOM ASSOCIATES COPYRIGHT 2011 BY ELSEVIER, INC. ALL
Is there still room for new developments in geostatistics?
 Is there still room for new developments in geostatistics? Jean-Paul Chilès MINES ParisTech, Fontainebleau, France, IAMG 34th IGC, Brisbane, 8 August 2012 Matheron: books and monographs 1962-1963: Treatise
Practical 12: Geostatistics
 Practical 12: Geostatistics This practical will introduce basic tools for geostatistics in R. You may need first to install and load a few packages. The packages sp and lattice contain useful function
Geostatistical Analyst for Deciding Optimal Interpolation Strategies for Delineating Compact Zones
 International Journal of Geosciences, 2011, 2, 585-596 doi:10.4236/ijg.2011.24061 Published Online November 2011 (http://www.scirp.org/journal/ijg) 585 Geostatistical Analyst for Deciding Optimal Interpolation
An Introduction to Spatial Autocorrelation and Kriging
 An Introduction to Spatial Autocorrelation and Kriging Matt Robinson and Sebastian Dietrich RenR 690 Spring 2016 Tobler and Spatial Relationships Tobler s 1 st Law of Geography: Everything is related to
Feb 21 and 25: Local weighted least squares: Quadratic loess smoother
 Feb 1 and 5: Local weighted least squares: Quadratic loess smoother An example of weighted least squares fitting of data to a simple model for the purposes of simultaneous smoothing and interpolation is
The minimisation gives a set of linear equations for optimal weights w:
 4. Interpolation onto a regular grid 4.1 Optimal interpolation method The optimal interpolation method was used to compute climatological property distributions of the selected standard levels on a regular
Propagation of Errors in Spatial Analysis
 Stephen F. Austin State University SFA ScholarWorks Faculty Presentations Spatial Science 2001 Propagation of Errors in Spatial Analysis Peter P. Siska I-Kuai Hung Arthur Temple College of Forestry and
Chapter 1. Summer School GEOSTAT 2014, Spatio-Temporal Geostatistics,
 Chapter 1 Summer School GEOSTAT 2014, Geostatistics, 2014-06-19 sum- http://ifgi.de/graeler Institute for Geoinformatics University of Muenster 1.1 Spatial Data From a purely statistical perspective, spatial
GRAD6/8104; INES 8090 Spatial Statistic Spring 2017
 Lab #4 Semivariogram and Kriging (Due Date: 04/04/2017) PURPOSES 1. Learn to conduct semivariogram analysis and kriging for geostatistical data 2. Learn to use a spatial statistical library, gstat, in
Umeå University Sara Sjöstedt-de Luna Time series analysis and spatial statistics
 Umeå University 01-05-5 Sara Sjöstedt-de Luna Time series analysis and spatial statistics Laboration in ArcGIS Geostatistical Analyst These exercises are aiming at helping you understand ArcGIS Geostatistical