ENGRG Introduction to GIS
|
|
|
- Adele Arnold
- 5 years ago
- Views:
Transcription

1 ENGRG Introduction to GIS Michael Piasecki October 13, 2017 Lecture 06: Spatial Analysis

2 Outline Today Concepts What is spatial interpolation Why is necessary Sample of interpolation (size and pattern) Interpolation methods Thiessen polygon Local average Inverse Distance Weighted Spline Kriging 10/11/2017 ENGRG Intro to GIS 2
3 Spatial Interpolation Spatial interpolation is the process of using points with known values to estimate values at other points. These points with known values are called known points, control points, sampled points, or observations. Interpolation only works where values are spatially dependant, or spatially auto correlated, that is, where nearby location tend to have similar Z values. Examples of spatially auto correlated features: elevation, property value, crime levels, precipitation Cannot use interpolation where values are not spatially auto correlated 10/11/2017 ENGRG Intro to GIS 3
4 Why Spatial Interpolation? GIS require data at all points (subject to spatial resolution of question). Impossible to measure continuous variables at all points. Infinite number of points Finite amount of time and other resources Inaccessible points It is necessary to evaluate new values Evaluate new value if cell size is changed Replace missing or erroneous data (noise data) 10/11/2017 ENGRG Intro to GIS 4
5 Principles of Interpolation Problem: Impossible ever to measure any continuous variable at all points Objective: Estimate unknown points by similarity and proximity with known points Basic Principle: Points close together in space are more likely to have similar values than points far apart (Tobler's First Law of Geography, 1970, A computer model simulating urban growth in the Detroit region, Economic Geography 46 (2): ) Basis: Sample of Known Points Unknown points 10/11/2017 ENGRG Intro to GIS 5
6 First Element of Interpolation: The Known Points Sampling Sample size How many? Controllable (perhaps) Limits: resources, diminishing returns Sampling pattern Where? Know the study area Choice may introduce errors, artifacts, outliers, 10/11/2017 ENGRG Intro to GIS 6
7 Sample Size Calculation One of the most common questions any statistician gets asked is How large a sample size do I need?" Researchers are often surprised to find out that the answer depends on a number of factors and they have to give the statistician some information before they can get an answer! The answers are essentially different depending on whether the study is a survey designed to find out the proportion of something, or is designed to find a sample mean. We consider these cases separately. 10/11/2017 ENGRG Intro to GIS 7
8 Sample Size Calculation: Example How large a sample size do I need?" Example: A professor in the Sociology department is trying to determine the proportion of students who support gay marriage. She asks, How large a sample size do I need?" To answer a question like this we need to ask the researcher certain questions, such as: 1. How accurately do you need the answer? 2. What level of confidence do you intend to use? 3. (possibly) What is your current estimate of the proportion of UNC students who support gay marriage?. 10/11/2017 ENGRG Intro to GIS 8

9 Sample Size Calculation 10/11/2017 ENGRG Intro to GIS 9


10 Sample Size Calculation value Standard Error formula. Largest for p = Solve for 1 where p = prior judgment of correct value of p if not known: use 0.5 > most conservative n = population size z = critical value (e.g for 95% confidence interval, from Normal distribution) ME= Margin of Error 10/11/2017 ENGRG Intro to GIS 10

11 Critical Z values 10/11/2017 ENGRG Intro to GIS 11

12 Sample Size Calculation 10/11/2017 ENGRG Intro to GIS 12
13 Sample Size Calculation 10/11/2017 ENGRG Intro to GIS 13

14 Sample Size Calculation 10/11/2017 ENGRG Intro to GIS 14

15 Sample Size Calculation 10/11/2017 ENGRG Intro to GIS 15

16 Online Sampling Size Calculators 10/11/2017 ENGRG Intro to GIS 16
17 Sample Patterns Systematic pattern Random pattern Cluster pattern Adaptive pattern 10/11/2017 ENGRG Intro to GIS 17


18 Systematic Sampling Spaced uniformly in x and y Advantages: Easy to conceive No subjective judgment Easy to lay out field sample pattern Disadvantages: Not statistically representative: all areas are represented the same, but some areas have more variation. Travel, visiting each site may be difficult or impossible Bias: coincidence of sample interval with data patterns?? 10/11/2017 ENGRG Intro to GIS 18
 Advantages Statistically robust")


19 Random Sample Random Sampling Random X (easting), Y (northing) location (calculate in spreadsheet ) Advantages Statistically robust no bias in sampling Unlikely to match pattern on landscape no aliasing. Easy to conceive and lay out Not subjective Disadvantages Does not distribute samples in areas of high variation Travel, visiting each site may be difficult or impossible 10/11/2017 ENGRG Intro to GIS 19


20 Cluster Sampling Cluster Sampling Group samples around centers Centers can be located systematically or randomly (or for convenience, if statistically valid) Samples within a cluster can be located randomly, systematically, or otherwise. Advantage Reduced travel time Take advantage of existing access Disadvantages: For cluster center placement, same as for systematic and random point placement 10/11/2017 ENGRG Intro to GIS 20
 have greatest")


21 Adaptive Patterns Adaptive Sampling higher sampling density where important variable(s) have greatest variation. Advantages Sampling efficiency optimized Logistics can be planned in many cases Disadvantages Preliminary sampling may be necessary, e.g. soil chemistry Significant prep time Subjective 10/11/2017 ENGRG Intro to GIS 21
22 The Second Element of Interpolation: The Unknown Points All interpolation methods use sampled values and positions to model unsampled points Deterministic interpolation techniques create surfaces from measured points, based on either the extent of similarity (e.g., Inverse Distance Weighted) or a degree of smoothing (e.g., Trend Surface Analysis). Geostatistical interpolation techniques (e.g., Kriging) are based on statistics and are used for more advanced prediction surface modeling, which also includes error or uncertainty of predictions. NOTE: Different methods will (almost always) produce different results. 10/11/2017 ENGRG Intro to GIS 22
23 Classification of Interpolation Local or global Exact or approximate (inexact) Deterministic or stochastic Gradual or abrupt 10/11/2017 ENGRG Intro to GIS 23
24 Global vs. Local A global interpolation method uses every known point available to estimate an unknown value. A local interpolation method, on the other hand, uses a sample of known points to estimate an unknown value. 10/11/2017 ENGRG Intro to GIS 24
25 Exact vs. Inexact Exact interpolation predicts a value at the point location that is the same as its known value. In other words, exact interpolation generates a surface that passes through the control points. Inexact interpolation or approximate interpolation predicts a value at the point location that differs from its known value. 10/11/2017 ENGRG Intro to GIS 25
26 Deterministic vs. Stochastic A deterministic interpolation method provides no assessment of errors with predicted values. Estimated value +- 2 A stochastic interpolation method, on the other hand, offers assessment of prediction errors with estimated variances. 10/11/2017 ENGRG Intro to GIS 26
27 Gradual or Abrupt Gradual methods: produce smooth surface between data points appropriate for interpolating data of low local variability Abrupt methods: produce surfaces with a stepped appearance appropriate for interpolating data of high local variability or data with discontinuities 10/11/2017 ENGRG Intro to GIS 27
28 Interpolation Methods Different methods will produce different results with same input data. No single method is more accurate than others for all situations. Accuracy may be determined by comparison with a second set of withheld samples for accuracy checking. The researcher should select the method based on knowledge of the study area, phenomena of interest, and available resources. 10/11/2017 ENGRG Intro to GIS 28
29 Choose Interpolation Methods The best interpolation method for any given application depends on The characteristics of the variable to be estimated the cost of sampling available resources accuracy requirements of the user Relative performance of interpolators has been determined for some variables in some locations This is truly a matter of trying out different methods, once you have some data. 10/11/2017 ENGRG Intro to GIS 29
30 The Basic Equation for Spatial Interpolation z o ' n i 1 w i z Where: Z 0 is the attribute value to be predicted at the unvisited site Z i is the attribute value at the i point of the nearby locations w i is the weight assigned to the attribute at point i, w i should sum up to 1 (to be unbiased) n is the total number of nearby locations involved Key issues: 1) How many nearby points should we include for a given un visited site? 2) How to select these nearby points? 3) How to allocate the weight for each nearby point? i 10/11/2017 ENGRG Intro to GIS 30
31 Interpolation methods Most GIS packages offer a number of methods Typical methods are: Thiessen polygons Spatial moving average Trend Surfaces Inverse Distance Weighted Kriging 10/11/2017 ENGRG Intro to GIS 31
32 Nearest Neighbor Interpolation (Thiessen polygons) Also called Thiessen Polygons, Voronoi polygons, Dirichlet cells Value assigned from nearest sample Value assigned across unusually large cells may be questionable; watch for them Edge effects 10/11/2017 ENGRG Intro to GIS 32
33 Thiessen polygon construction 10/11/2017 ENGRG Intro to GIS 33
34 Polygon Models: Thiessen (Voronoi polygons, Dirichlet cells) Polygons ò ò ò ò ò ò Thiessen Polygons: Areas of Influence An Exact Interpolator : Original Values are Preserved 10/11/2017 ENGRG Intro to GIS 34
35 Question What categories does the Thiessen polygon method fall into: exact or approximate? deterministic or stochastic? gradual or abrupt? local or global? For what could or could NOT it be used for? 10/11/2017 ENGRG Intro to GIS 35
36 Local Average Method (Spatial Moving Average) Calculates new value of each location based on range of values associated with neighbouring points Neighbourhood determined by a filter size, shape and character of filter Avoids shaky assignments at extreme distances Potential problem: Assigns zero to sites with no samples within radius Not exact interpolator 10/11/2017 ENGRG Intro to GIS 36
37 Spatial Moving Average 10/11/2017 ENGRG Intro to GIS 37
38 Local Average: Fixed Radius Raster grid specified Sample points within a fixed, search radius with center in each cell are averaged. 10/11/2017 ENGRG Intro to GIS 38
39 Question What categories does the Spatial Moving Average method fall into: exact or approximate? deterministic or stochastic? gradual or abrupt? local or global? What could it be used for? 10/11/2017 ENGRG Intro to GIS 39
40 Inverse Distance Weighting (IDW) z j s i 1 s i 1 zi d 1 d n ij n ij Exact Interpolator: Value calculated directly from three (usually) nearest samples Near one sample point, its influence greatly predominates. Must know! 10/11/2017 ENGRG Intro to GIS 40
41 Exponent Value: Degree of Influence 10/11/2017 ENGRG Intro to GIS 41
42 Question What categories does the Inverse Distance Weighted (IDW) method fall into: exact or approximate? deterministic or stochastic? gradual or abrupt? local or global? What could it be used for? 10/11/2017 ENGRG Intro to GIS 42
 trend surface")

43 Trend Surface Analysis First order (linear) trend surface Second order (quadratic) trend surface 10/11/2017 ENGRG Intro to GIS 43
44 Surface Models: Trend Surface Analysis Y X Z = b o + b 1 X + b 2 Y + [polynomial terms + interaction terms] + e Inexact interpolator: Surface usually not through sample points. 10/11/2017 ENGRG Intro to GIS 44
45 Surface Models: Trend Surface Analysis Regression SUMMARY OUTPUT Regression Statistics Multiple R 0.83 R Square 0.69 Adjusted R 0.58 Standard E 3.16 Observatio 20 ANOVA df SS MS F Significance Regression Residual Total Coefficien Standard Error t Stat P-value Intercept X Y X^ Y^ XY Only independent variables are the X,Y coordinates. Z = * X * Y * X * Y * XY 10/11/2017 ENGRG Intro to GIS 45
46 Trend Surface Interpolation Statistical approach Not exact, but can be life like, i.e., similar to natural phenomena, which usually vary smoothly. 10/11/2017 ENGRG Intro to GIS 46
47 Question What categories does the Trend Surface Analysis method fall into: exact or approximate? deterministic or stochastic? gradual or abrupt? local or global? What could it be used for? 10/11/2017 ENGRG Intro to GIS 47
48 Interpolation with Splines Force line to pass through known points. Joined polynomial functions Can be 1 3 order Segments meet at join points Iterative process 10/11/2017 ENGRG Intro to GIS 48
49 Spatial Interpolation in ArcGIS Geostatistical Analyst The ArcGIS GeoStatistical Analyst extension provides a variety of interpolation methods for the creation of an optimal interpolated surface from your data. A friendly wizard helps you through the interpolation process. 10/11/2017 ENGRG Intro to GIS 49
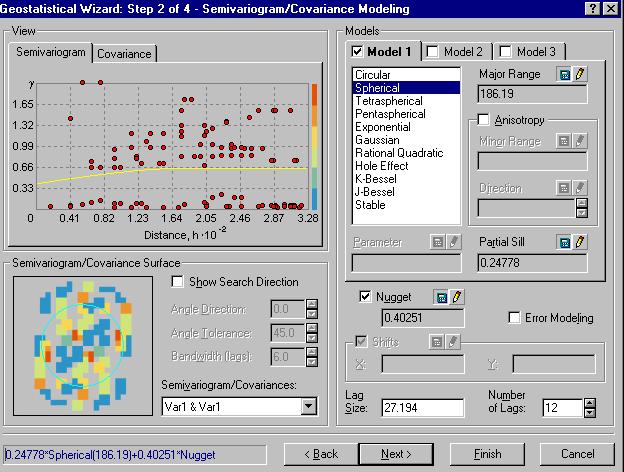
50 Interpolation with Geostatistics Several options; best known is: Kriging Developed by D.G. Krige and G. Matheron. Statistically based estimator Depends on Variogram analysis: defined as a fct describing the degree of spatial dependence of a spatial random field or stochastic process the variance of the difference between field values at two locations x and y across realizations in the field Weighting to interpolate variable value similar to IDW, but weights are based on spatial autocorrelation in the sample, not merely distance. 10/11/2017 ENGRG Intro to GIS 50
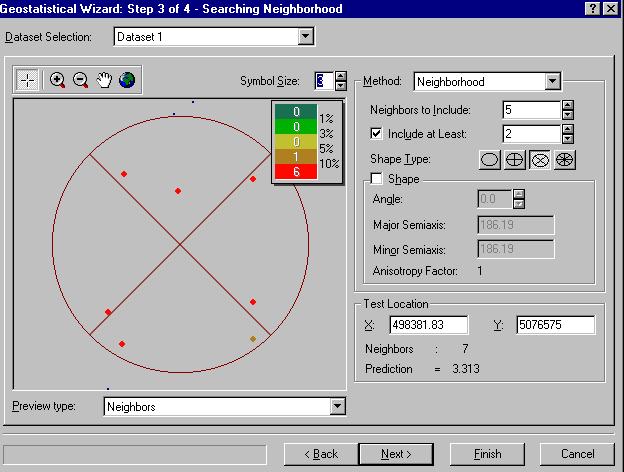
51 Kriging Steps 1. Calculate semivariance: spatial autocorrelation 2. Identify a model to estimate the weights 3. Calculate covariance within the data 4. Make the estimation 5. Check for error 10/11/2017 ENGRG Intro to GIS 51

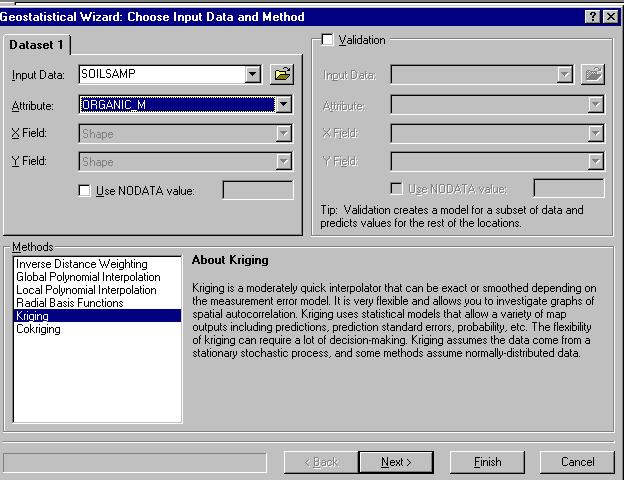

52 Geostatistics with the ArcGIS Geostatistical Analyst Extension 10/11/2017 ENGRG Intro to GIS 52


53 Geostatistical Analyst Again, use of this methodology deserves an entire course 10/11/2017 ENGRG Intro to GIS 53
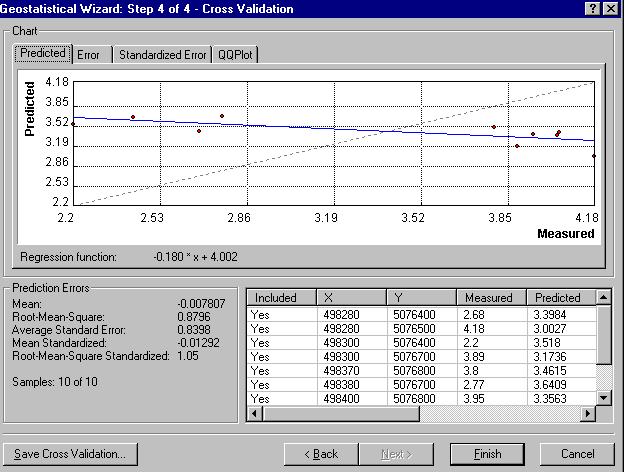
54 Cross Validation The validation technique compares the interpolation methods by first dividing known points into two samples: one sample for developing the models for each interpolation method to be compared and the other sample for testing the accuracy of the models Steps Remove a known point from the data set. Use the remaining points to estimate the value at the point previously removed. Calculate the predicted error of the estimation by comparing the estimated with the known value. 10/11/2017 ENGRG Intro to GIS 54
55 Root mean square (RMS) error RMS 1 n n (z i 1 2 i,act zi,est) Standardized RMS = 1 n n i 1 (z i,act s 2 z i,est ) 2 10/11/2017 ENGRG Intro to GIS 55
56 Summary Global Method Local Method Deterministic Stochastic Deterministic Stochastic Trend surface (inexact)* Regression (inexact) Thiessen (exact) Inverse Distance Weighted (exact) Kriging (exact) Splines (exact) Local Average (inexact) *Given some required assumptions, trend surface analysis can be treated as a special case of regression analysis and thus a stochastic method. 10/11/2017 ENGRG Intro to GIS 56
57 Summary Concepts What is spatial interpolation and why is necessary Sample pattern: systematic; random; cluster; adaptive Classification of interpolation methods Global vs Local Exact vs Inexact Graduate vs abrupt Deterministic vs Stochastic Interpolation methods Thiessen polygon Local average Inverse Distance Weighted Spline Kriging 10/11/2017 ENGRG Intro to GIS 57
Lecture 5 Geostatistics
 Lecture 5 Geostatistics Lecture Outline Spatial Estimation Spatial Interpolation Spatial Prediction Sampling Spatial Interpolation Methods Spatial Prediction Methods Interpolating Raster Surfaces with
Lecture 8. Spatial Estimation
 Lecture 8 Spatial Estimation Lecture Outline Spatial Estimation Spatial Interpolation Spatial Prediction Sampling Spatial Interpolation Methods Spatial Prediction Methods Interpolating Raster Surfaces
Copyright The McGraw-Hill Companies, Inc. Permission required for reproduction or display.
 Chapter 15. SPATIAL INTERPOLATION 15.1 Elements of Spatial Interpolation 15.1.1 Control Points 15.1.2 Type of Spatial Interpolation 15.2 Global Methods 15.2.1 Trend Surface Models Box 15.1 A Worked Example
Spatial Analysis II. Spatial data analysis Spatial analysis and inference
 Spatial Analysis II Spatial data analysis Spatial analysis and inference Roadmap Spatial Analysis I Outline: What is spatial analysis? Spatial Joins Step 1: Analysis of attributes Step 2: Preparing for
Concepts and Applications of Kriging. Eric Krause
 Concepts and Applications of Kriging Eric Krause Sessions of note Tuesday ArcGIS Geostatistical Analyst - An Introduction 8:30-9:45 Room 14 A Concepts and Applications of Kriging 10:15-11:30 Room 15 A
Spatial analysis. 0 move the objects and the results change
 0 Outline: Roadmap 0 What is spatial analysis? 0 Transformations 0 Introduction to spatial interpolation 0 Classification of spatial interpolation methods 0 Interpolation methods 0 Areal interpolation
Concepts and Applications of Kriging
 2013 Esri International User Conference July 8 12, 2013 San Diego, California Technical Workshop Concepts and Applications of Kriging Eric Krause Konstantin Krivoruchko Outline Intro to interpolation Exploratory
Interpolating Raster Surfaces
 Interpolating Raster Surfaces You can use interpolation to model the surface of a feature or a phenomenon all you need are sample points, an interpolation method, and an understanding of the feature or
Concepts and Applications of Kriging
 Esri International User Conference San Diego, California Technical Workshops July 24, 2012 Concepts and Applications of Kriging Konstantin Krivoruchko Eric Krause Outline Intro to interpolation Exploratory
Concepts and Applications of Kriging. Eric Krause Konstantin Krivoruchko
 Concepts and Applications of Kriging Eric Krause Konstantin Krivoruchko Outline Introduction to interpolation Exploratory spatial data analysis (ESDA) Using the Geostatistical Wizard Validating interpolation
Spatial Data Mining. Regression and Classification Techniques
 Spatial Data Mining Regression and Classification Techniques 1 Spatial Regression and Classisfication Discrete class labels (left) vs. continues quantities (right) measured at locations (2D for geographic
Propagation of Errors in Spatial Analysis
 Stephen F. Austin State University SFA ScholarWorks Faculty Presentations Spatial Science 2001 Propagation of Errors in Spatial Analysis Peter P. Siska I-Kuai Hung Arthur Temple College of Forestry and
Report on Kriging in Interpolation
 Tabor Reedy ENVS421 3/12/15 Report on Kriging in Interpolation In this project I explored use of the geostatistical analyst extension and toolbar in the process of creating an interpolated surface through
Statistical Perspectives on Geographic Information Science. Michael F. Goodchild University of California Santa Barbara
 Statistical Perspectives on Geographic Information Science Michael F. Goodchild University of California Santa Barbara Statistical geometry Geometric phenomena subject to chance spatial phenomena emphasis
Comparison of rainfall distribution method
 Team 6 Comparison of rainfall distribution method In this section different methods of rainfall distribution are compared. METEO-France is the French meteorological agency, a public administrative institution
Types of spatial data. The Nature of Geographic Data. Types of spatial data. Spatial Autocorrelation. Continuous spatial data: geostatistics
 The Nature of Geographic Data Types of spatial data Continuous spatial data: geostatistics Samples may be taken at intervals, but the spatial process is continuous e.g. soil quality Discrete data Irregular:
Geostatistics: Kriging
 Geostatistics: Kriging 8.10.2015 Konetekniikka 1, Otakaari 4, 150 10-12 Rangsima Sunila, D.Sc. Background What is Geostatitics Concepts Variogram: experimental, theoretical Anisotropy, Isotropy Lag, Sill,
Spatial analysis. Spatial descriptive analysis. Spatial inferential analysis:
 Spatial analysis Spatial descriptive analysis Point pattern analysis (minimum bounding box, mean center, weighted mean center, standard distance, nearest neighbor analysis) Spatial clustering analysis
Michael Harrigan Office hours: Fridays 2:00-4:00pm Holden Hall
 Announcement New Teaching Assistant Michael Harrigan Office hours: Fridays 2:00-4:00pm Holden Hall 209 Email: michael.harrigan@ttu.edu Guofeng Cao, Texas Tech GIST4302/5302, Lecture 2: Review of Map Projection
Class 9. Query, Measurement & Transformation; Spatial Buffers; Descriptive Summary, Design & Inference
 Class 9 Query, Measurement & Transformation; Spatial Buffers; Descriptive Summary, Design & Inference Spatial Analysis Turns raw data into useful information by adding greater informative content and value
Index. Geostatistics for Environmental Scientists, 2nd Edition R. Webster and M. A. Oliver 2007 John Wiley & Sons, Ltd. ISBN:
 Index Akaike information criterion (AIC) 105, 290 analysis of variance 35, 44, 127 132 angular transformation 22 anisotropy 59, 99 affine or geometric 59, 100 101 anisotropy ratio 101 exploring and displaying
11/8/2018. Spatial Interpolation & Geostatistics. Kriging Step 1
 (Z i Z j ) 2 / 2 (Z i Zj) 2 / 2 Semivariance y 11/8/2018 Spatial Interpolation & Geostatistics Kriging Step 1 Describe spatial variation with Semivariogram Lag Distance between pairs of points Lag Mean
GIST 4302/5302: Spatial Analysis and Modeling
 GIST 4302/5302: Spatial Analysis and Modeling Review Guofeng Cao www.gis.ttu.edu/starlab Department of Geosciences Texas Tech University guofeng.cao@ttu.edu Spring 2016 Course Outlines Spatial Point Pattern
Spatial Data Analysis in Archaeology Anthropology 589b. Kriging Artifact Density Surfaces in ArcGIS
 Spatial Data Analysis in Archaeology Anthropology 589b Fraser D. Neiman University of Virginia 2.19.07 Spring 2007 Kriging Artifact Density Surfaces in ArcGIS 1. The ingredients. -A data file -- in.dbf
Geostatistical Interpolation: Kriging and the Fukushima Data. Erik Hoel Colligium Ramazzini October 30, 2011
 Geostatistical Interpolation: Kriging and the Fukushima Data Erik Hoel Colligium Ramazzini October 30, 2011 Agenda Basics of geostatistical interpolation Fukushima radiation Database Web site Geoanalytic
Spatial Interpolation & Geostatistics
 (Z i Z j ) 2 / 2 Spatial Interpolation & Geostatistics Lag Lag Mean Distance between pairs of points 1 y Kriging Step 1 Describe spatial variation with Semivariogram (Z i Z j ) 2 / 2 Point cloud Map 3
An Introduction to Spatial Autocorrelation and Kriging
 An Introduction to Spatial Autocorrelation and Kriging Matt Robinson and Sebastian Dietrich RenR 690 Spring 2016 Tobler and Spatial Relationships Tobler s 1 st Law of Geography: Everything is related to
VALIDATION OF SPATIAL INTERPOLATION TECHNIQUES IN GIS
 VALIDATION OF SPATIAL INTERPOLATION TECHNIQUES IN GIS V.P.I.S. Wijeratne and L.Manawadu University of Colombo (UOC), Kumarathunga Munidasa Mawatha, Colombo 03, wijeratnesandamali@yahoo.com and lasan@geo.cmb.ac.lk
Econometrics I. Lecture 10: Nonparametric Estimation with Kernels. Paul T. Scott NYU Stern. Fall 2018
 Econometrics I Lecture 10: Nonparametric Estimation with Kernels Paul T. Scott NYU Stern Fall 2018 Paul T. Scott NYU Stern Econometrics I Fall 2018 1 / 12 Nonparametric Regression: Intuition Let s get
Geog183: Cartographic Design and Geovisualization Spring Quarter 2018 Lecture 11: Dasymetric and isarithmic mapping
 Geog183: Cartographic Design and Geovisualization Spring Quarter 2018 Lecture 11: Dasymetric and isarithmic mapping Discrete vs. continuous revisited Choropleth suited to discrete areal, but suffers from
I don t have much to say here: data are often sampled this way but we more typically model them in continuous space, or on a graph
 Spatial analysis Huge topic! Key references Diggle (point patterns); Cressie (everything); Diggle and Ribeiro (geostatistics); Dormann et al (GLMMs for species presence/abundance); Haining; (Pinheiro and
Kriging Luc Anselin, All Rights Reserved
 Kriging Luc Anselin Spatial Analysis Laboratory Dept. Agricultural and Consumer Economics University of Illinois, Urbana-Champaign http://sal.agecon.uiuc.edu Outline Principles Kriging Models Spatial Interpolation
Statistical Learning
 Statistical Learning Supervised learning Assume: Estimate: quantity of interest function predictors to get: error Such that: For prediction and/or inference Model fit vs. Model stability (Bias variance
GIST 4302/5302: Spatial Analysis and Modeling
 GIST 4302/5302: Spatial Analysis and Modeling Lecture 2: Review of Map Projections and Intro to Spatial Analysis Guofeng Cao http://thestarlab.github.io Department of Geosciences Texas Tech University
Overview of Statistical Analysis of Spatial Data
 Overview of Statistical Analysis of Spatial Data Geog 2C Introduction to Spatial Data Analysis Phaedon C. Kyriakidis www.geog.ucsb.edu/ phaedon Department of Geography University of California Santa Barbara
Spatial Analysis I. Spatial data analysis Spatial analysis and inference
 Spatial Analysis I Spatial data analysis Spatial analysis and inference Roadmap Outline: What is spatial analysis? Spatial Joins Step 1: Analysis of attributes Step 2: Preparing for analyses: working with
The Nature of Geographic Data
 4 The Nature of Geographic Data OVERVIEW Elaborates on the spatial is special theme Focuses on how phenomena vary across space and the general nature of geographic variation Describes the main principles
Spatial Analysis with ArcGIS Pro STUDENT EDITION
 Spatial Analysis with ArcGIS Pro STUDENT EDITION Copyright 2018 Esri All rights reserved. Course version 2.0. Version release date November 2018. Printed in the United States of America. The information
Spatial Analyst. By Sumita Rai
 ArcGIS Extentions Spatial Analyst By Sumita Rai Overview What does GIS do? How does GIS work data models Extension to GIS Spatial Analyst Spatial Analyst Tasks & Tools Surface Analysis Surface Creation
A GEOSTATISTICAL APPROACH TO PREDICTING A PHYSICAL VARIABLE THROUGH A CONTINUOUS SURFACE
 Katherine E. Williams University of Denver GEOG3010 Geogrpahic Information Analysis April 28, 2011 A GEOSTATISTICAL APPROACH TO PREDICTING A PHYSICAL VARIABLE THROUGH A CONTINUOUS SURFACE Overview Data
PRODUCING PROBABILITY MAPS TO ASSESS RISK OF EXCEEDING CRITICAL THRESHOLD VALUE OF SOIL EC USING GEOSTATISTICAL APPROACH
 PRODUCING PROBABILITY MAPS TO ASSESS RISK OF EXCEEDING CRITICAL THRESHOLD VALUE OF SOIL EC USING GEOSTATISTICAL APPROACH SURESH TRIPATHI Geostatistical Society of India Assumptions and Geostatistical Variogram
Introduction. Semivariogram Cloud
 Introduction Data: set of n attribute measurements {z(s i ), i = 1,, n}, available at n sample locations {s i, i = 1,, n} Objectives: Slide 1 quantify spatial auto-correlation, or attribute dissimilarity
Practical Statistics for the Analytical Scientist Table of Contents
 Practical Statistics for the Analytical Scientist Table of Contents Chapter 1 Introduction - Choosing the Correct Statistics 1.1 Introduction 1.2 Choosing the Right Statistical Procedures 1.2.1 Planning
GIST 4302/5302: Spatial Analysis and Modeling Lecture 2: Review of Map Projections and Intro to Spatial Analysis
 GIST 4302/5302: Spatial Analysis and Modeling Lecture 2: Review of Map Projections and Intro to Spatial Analysis Guofeng Cao http://www.spatial.ttu.edu Department of Geosciences Texas Tech University guofeng.cao@ttu.edu
Stanford Exploration Project, Report 105, September 5, 2000, pages 41 53
 Stanford Exploration Project, Report 105, September 5, 2000, pages 41 53 40 Stanford Exploration Project, Report 105, September 5, 2000, pages 41 53 Short Note Multiple realizations using standard inversion
Umeå University Sara Sjöstedt-de Luna Time series analysis and spatial statistics
 Umeå University 01-05-5 Sara Sjöstedt-de Luna Time series analysis and spatial statistics Laboration in ArcGIS Geostatistical Analyst These exercises are aiming at helping you understand ArcGIS Geostatistical
It s a Model. Quantifying uncertainty in elevation models using kriging
 It s a Model Quantifying uncertainty in elevation models using kriging By Konstantin Krivoruchko and Kevin Butler, Esri Raster based digital elevation models (DEM) are the basis of some of the most important
ArcGIS for Geostatistical Analyst: An Introduction. Steve Lynch and Eric Krause Redlands, CA.
 ArcGIS for Geostatistical Analyst: An Introduction Steve Lynch and Eric Krause Redlands, CA. Outline - What is geostatistics? - What is Geostatistical Analyst? - Spatial autocorrelation - Geostatistical
2.6 Two-dimensional continuous interpolation 3: Kriging - introduction to geostatistics. References - geostatistics. References geostatistics (cntd.
 .6 Two-dimensional continuous interpolation 3: Kriging - introduction to geostatistics Spline interpolation was originally developed or image processing. In GIS, it is mainly used in visualization o spatial
Multiple realizations using standard inversion techniques a
 Multiple realizations using standard inversion techniques a a Published in SEP report, 105, 67-78, (2000) Robert G Clapp 1 INTRODUCTION When solving a missing data problem, geophysicists and geostatisticians
COMPARISON OF DIGITAL ELEVATION MODELLING METHODS FOR URBAN ENVIRONMENT
 COMPARISON OF DIGITAL ELEVATION MODELLING METHODS FOR URBAN ENVIRONMENT Cahyono Susetyo Department of Urban and Regional Planning, Institut Teknologi Sepuluh Nopember, Indonesia Gedung PWK, Kampus ITS,
Empirical Bayesian Kriging
 Empirical Bayesian Kriging Implemented in ArcGIS Geostatistical Analyst By Konstantin Krivoruchko, Senior Research Associate, Software Development Team, Esri Obtaining reliable environmental measurements
Areal data. Infant mortality, Auckland NZ districts. Number of plant species in 20cm x 20 cm patches of alpine tundra. Wheat yield
 Areal data Reminder about types of data Geostatistical data: Z(s) exists everyhere, varies continuously Can accommodate sudden changes by a model for the mean E.g., soil ph, two soil types with different
CREATION OF DEM BY KRIGING METHOD AND EVALUATION OF THE RESULTS
 CREATION OF DEM BY KRIGING METHOD AND EVALUATION OF THE RESULTS JANA SVOBODOVÁ, PAVEL TUČEK* Jana Svobodová, Pavel Tuček: Creation of DEM by kriging method and evaluation of the results. Geomorphologia
Unequal Probability-Based Spatial
 Unequal Probability-Based Spatial By Konstantin Krivoruchko and Kevin Butler, Esri Sampling The geographic approach involves measuring the earth, organizing the resultant data, and analyzing it to understand
ArcGIS Pro: Analysis and Geoprocessing. Nicholas M. Giner Esri Christopher Gabris Blue Raster
 ArcGIS Pro: Analysis and Geoprocessing Nicholas M. Giner Esri Christopher Gabris Blue Raster Agenda What is Analysis and Geoprocessing? Analysis in ArcGIS Pro - 2D (Spatial xy) - 3D (Elevation - z) - 4D
Hypothesis Testing hypothesis testing approach
 Hypothesis Testing In this case, we d be trying to form an inference about that neighborhood: Do people there shop more often those people who are members of the larger population To ascertain this, we
Lecture 9: Introduction to Kriging
 Lecture 9: Introduction to Kriging Math 586 Beginning remarks Kriging is a commonly used method of interpolation (prediction) for spatial data. The data are a set of observations of some variable(s) of
BAYESIAN MODEL FOR SPATIAL DEPENDANCE AND PREDICTION OF TUBERCULOSIS
 BAYESIAN MODEL FOR SPATIAL DEPENDANCE AND PREDICTION OF TUBERCULOSIS Srinivasan R and Venkatesan P Dept. of Statistics, National Institute for Research Tuberculosis, (Indian Council of Medical Research),
Basics of GIS. by Basudeb Bhatta. Computer Aided Design Centre Department of Computer Science and Engineering Jadavpur University
 Basics of GIS by Basudeb Bhatta Computer Aided Design Centre Department of Computer Science and Engineering Jadavpur University e-governance Training Programme Conducted by National Institute of Electronics
On dealing with spatially correlated residuals in remote sensing and GIS
 On dealing with spatially correlated residuals in remote sensing and GIS Nicholas A. S. Hamm 1, Peter M. Atkinson and Edward J. Milton 3 School of Geography University of Southampton Southampton SO17 3AT
11. Kriging. ACE 492 SA - Spatial Analysis Fall 2003
 11. Kriging ACE 492 SA - Spatial Analysis Fall 2003 c 2003 by Luc Anselin, All Rights Reserved 1 Objectives The goal of this lab is to further familiarize yourself with ESRI s Geostatistical Analyst, extending
Exploratory Spatial Data Analysis (ESDA)
") Exploratory Spatial Data Analysis (ESDA) VANGHR s method of ESDA follows a typical geospatial framework of selecting variables, exploring spatial patterns, and regression analysis. The primary software
Exploratory Spatial Data Analysis (ESDA) VANGHR s method of ESDA follows a typical geospatial framework of selecting variables, exploring spatial patterns, and regression analysis. The primary software
Nature of Spatial Data. Outline. Spatial Is Special
 Nature of Spatial Data Outline Spatial is special Bad news: the pitfalls of spatial data Good news: the potentials of spatial data Spatial Is Special Are spatial data special? Why spatial data require
Types of Spatial Data
 Spatial Data Types of Spatial Data Point pattern Point referenced geostatistical Block referenced Raster / lattice / grid Vector / polygon Point Pattern Data Interested in the location of points, not their
Improving Spatial Data Interoperability
 Improving Spatial Data Interoperability A Framework for Geostatistical Support-To To-Support Interpolation Michael F. Goodchild, Phaedon C. Kyriakidis, Philipp Schneider, Matt Rice, Qingfeng Guan, Jordan
Soil Moisture Modeling using Geostatistical Techniques at the O Neal Ecological Reserve, Idaho
 Final Report: Forecasting Rangeland Condition with GIS in Southeastern Idaho Soil Moisture Modeling using Geostatistical Techniques at the O Neal Ecological Reserve, Idaho Jacob T. Tibbitts, Idaho State
Geog 469 GIS Workshop. Data Analysis
 Geog 469 GIS Workshop Data Analysis Outline 1. What kinds of need-to-know questions can be addressed using GIS data analysis? 2. What is a typology of GIS operations? 3. What kinds of operations are useful
Intensity Analysis of Spatial Point Patterns Geog 210C Introduction to Spatial Data Analysis
 Intensity Analysis of Spatial Point Patterns Geog 210C Introduction to Spatial Data Analysis Chris Funk Lecture 5 Topic Overview 1) Introduction/Unvariate Statistics 2) Bootstrapping/Monte Carlo Simulation/Kernel
Sampling. Where we re heading: Last time. What is the sample? Next week: Lecture Monday. **Lab Tuesday leaving at 11:00 instead of 1:00** Tomorrow:
 Sampling Questions Define: Sampling, statistical inference, statistical vs. biological population, accuracy, precision, bias, random sampling Why do people use sampling techniques in monitoring? How do
Transiogram: A spatial relationship measure for categorical data
 International Journal of Geographical Information Science Vol. 20, No. 6, July 2006, 693 699 Technical Note Transiogram: A spatial relationship measure for categorical data WEIDONG LI* Department of Geography,
GIST 4302/5302: Spatial Analysis and Modeling
 GIST 4302/5302: Spatial Analysis and Modeling Basics of Statistics Guofeng Cao www.myweb.ttu.edu/gucao Department of Geosciences Texas Tech University guofeng.cao@ttu.edu Spring 2015 Outline of This Week
Chapter 1 Statistical Inference
 Chapter 1 Statistical Inference causal inference To infer causality, you need a randomized experiment (or a huge observational study and lots of outside information). inference to populations Generalizations
Sidestepping the box: Designing a supplemental poverty indicator for school neighborhoods
 Sidestepping the box: Designing a supplemental poverty indicator for school neighborhoods Doug Geverdt National Center for Education Statistics Laura Nixon U.S. Census Bureau 2018 Annual meeting of the
Why Is It There? Attribute Data Describe with statistics Analyze with hypothesis testing Spatial Data Describe with maps Analyze with spatial analysis
 6 Why Is It There? Why Is It There? Getting Started with Geographic Information Systems Chapter 6 6.1 Describing Attributes 6.2 Statistical Analysis 6.3 Spatial Description 6.4 Spatial Analysis 6.5 Searching
Analytical Methods. Session 3: Statistics II. UCL Department of Civil, Environmental & Geomatic Engineering. Analytical Methods.
 Analytical Methods Session 3: Statistics II More statistical tests Quite a few more questions that we might want to ask about data that we have. Is one value significantly different to the rest, or to
Spatial Analysis 1. Introduction
 Spatial Analysis 1 Introduction Geo-referenced Data (not any data) x, y coordinates (e.g., lat., long.) ------------------------------------------------------ - Table of Data: Obs. # x y Variables -------------------------------------
Anomaly Density Estimation from Strip Transect Data: Pueblo of Isleta Example
 Anomaly Density Estimation from Strip Transect Data: Pueblo of Isleta Example Sean A. McKenna, Sandia National Laboratories Brent Pulsipher, Pacific Northwest National Laboratory May 5 Distribution Statement
Course in Data Science
 Course in Data Science About the Course: In this course you will get an introduction to the main tools and ideas which are required for Data Scientist/Business Analyst/Data Analyst. The course gives an
Integration of Topographic and Bathymetric Digital Elevation Model using ArcGIS. Interpolation Methods: A Case Study of the Klamath River Estuary
 Integration of Topographic and Bathymetric Digital Elevation Model using ArcGIS Interpolation Methods: A Case Study of the Klamath River Estuary by Rachel R. Rodriguez A Thesis Presented to the FACULTY
Extensibility of Measurement Results of Point Samples of the Soil Protection Information and Monitoring System by different methods
 Extensibility of Measurement Results of Point Samples of the Soil Protection Information and Monitoring System by different methods L. Várallyai a, B. Kovács b, and J. Prokisch b a University of Debrecen,
Spatial Analysis and Modeling (GIST 4302/5302) Guofeng Cao Department of Geosciences Texas Tech University
 Guofeng Cao Department of Geosciences Texas Tech University") Spatial Analysis and Modeling (GIST 4302/5302) Guofeng Cao Department of Geosciences Texas Tech University TTU Graduate Certificate Geographic Information Science and Technology (GIST) 3 Core Courses and
Spatial Analysis and Modeling (GIST 4302/5302) Guofeng Cao Department of Geosciences Texas Tech University TTU Graduate Certificate Geographic Information Science and Technology (GIST) 3 Core Courses and
Advanced analysis and modelling tools for spatial environmental data. Case study: indoor radon data in Switzerland
 EnviroInfo 2004 (Geneva) Sh@ring EnviroInfo 2004 Advanced analysis and modelling tools for spatial environmental data. Case study: indoor radon data in Switzerland Mikhail Kanevski 1, Michel Maignan 1
STATISTICS-STAT (STAT)
") Statistics-STAT (STAT) 1 STATISTICS-STAT (STAT) Courses STAT 158 Introduction to R Programming Credit: 1 (1-0-0) Programming using the R Project for the Statistical Computing. Data objects, for loops,
Statistics-STAT (STAT) 1 STATISTICS-STAT (STAT) Courses STAT 158 Introduction to R Programming Credit: 1 (1-0-0) Programming using the R Project for the Statistical Computing. Data objects, for loops,
Confidence Intervals, Testing and ANOVA Summary
 Confidence Intervals, Testing and ANOVA Summary 1 One Sample Tests 1.1 One Sample z test: Mean (σ known) Let X 1,, X n a r.s. from N(µ, σ) or n > 30. Let The test statistic is H 0 : µ = µ 0. z = x µ 0
An Introduction to Pattern Statistics
 An Introduction to Pattern Statistics Nearest Neighbors The CSR hypothesis Clark/Evans and modification Cuzick and Edwards and controls All events k function Weighted k function Comparative k functions
Display and analysis of weather data from NCDC using ArcGIS
 Display and analysis of weather data from NCDC using ArcGIS Helen M. Cox Associate Professor Geography Department California State University, Northridge and Stephen Krug Graduate Student Geography Department
When to Do the Gridding?
 Part 6: Objective Analysis Optimum Interpolation Composite Analysis When to Do the Gridding? The methods described are applicable to any problem where the data you are given do not fill the domain of interest
Luc Anselin Spatial Analysis Laboratory Dept. Agricultural and Consumer Economics University of Illinois, Urbana-Champaign
 GIS and Spatial Analysis Luc Anselin Spatial Analysis Laboratory Dept. Agricultural and Consumer Economics University of Illinois, Urbana-Champaign http://sal.agecon.uiuc.edu Outline GIS and Spatial Analysis
A MultiGaussian Approach to Assess Block Grade Uncertainty
 A MultiGaussian Approach to Assess Block Grade Uncertainty Julián M. Ortiz 1, Oy Leuangthong 2, and Clayton V. Deutsch 2 1 Department of Mining Engineering, University of Chile 2 Department of Civil &
Chapter 6 Spatial Analysis
 6.1 Introduction Chapter 6 Spatial Analysis Spatial analysis, in a narrow sense, is a set of mathematical (and usually statistical) tools used to find order and patterns in spatial phenomena. Spatial patterns
Interpolation of daily mean air temperature data via spatial and non-spatial copulas
 Interpolation of daily mean air temperature data via spatial and non-spatial copulas F. Alidoost, A. Stein f.alidoost@utwente.nl 6 July 2017 Research problem 2 Assessing near-real time crop and irrigation
ASPECTS REGARDING THE USEFULNESS OF GEOGRAPHICALLY WEIGHTED REGRESSION (GWR) FOR DIGITAL MAPPING OF SOIL PARAMETERS
 FOR DIGITAL MAPPING OF SOIL PARAMETERS") Lucrări Ştiinţifice vol. 52, seria Agronomie ASPECTS REGARDING THE USEFULNESS OF GEOGRAPHICALLY WEIGHTED REGRESSION (GWR) FOR DIGITAL MAPPING OF SOIL PARAMETERS C. PATRICHE 1, I. VASILINIUC 2 1 Romanian
Lucrări Ştiinţifice vol. 52, seria Agronomie ASPECTS REGARDING THE USEFULNESS OF GEOGRAPHICALLY WEIGHTED REGRESSION (GWR) FOR DIGITAL MAPPING OF SOIL PARAMETERS C. PATRICHE 1, I. VASILINIUC 2 1 Romanian
SPACE Workshop NSF NCGIA CSISS UCGIS SDSU. Aldstadt, Getis, Jankowski, Rey, Weeks SDSU F. Goodchild, M. Goodchild, Janelle, Rebich UCSB
 SPACE Workshop NSF NCGIA CSISS UCGIS SDSU Aldstadt, Getis, Jankowski, Rey, Weeks SDSU F. Goodchild, M. Goodchild, Janelle, Rebich UCSB August 2-8, 2004 San Diego State University Some Examples of Spatial
GIS in Water Resources Midterm Exam Fall 2016 There are four questions on this exam. Please do all four. They are not all of equal weight.
 Page 1 of 7 Name: GIS in Water Resources Midterm Exam Fall 2016 There are four questions on this exam. Please do all four. They are not all of equal weight. Question 1. (20%) (a) Three key functions of
Application of eigenvector-based spatial filtering approach to. a multinomial logit model for land use data
 Presented at the Seventh World Conference of the Spatial Econometrics Association, the Key Bridge Marriott Hotel, Washington, D.C., USA, July 10 12, 2013. Application of eigenvector-based spatial filtering
Mustafa H. Tongarlak Bruce E. Ankenman Barry L. Nelson
 Proceedings of the 0 Winter Simulation Conference S. Jain, R. R. Creasey, J. Himmelspach, K. P. White, and M. Fu, eds. RELATIVE ERROR STOCHASTIC KRIGING Mustafa H. Tongarlak Bruce E. Ankenman Barry L.
Introduction to Spatial Statistics and Modeling for Regional Analysis
 Introduction to Spatial Statistics and Modeling for Regional Analysis Dr. Xinyue Ye, Assistant Professor Center for Regional Development (Department of Commerce EDA University Center) & School of Earth,
The Comparative Analysis of Spatial Structure of Ji Wheat 22 Yield Based on Different Stochastic Samplings
 The Comparative Analysis of Spatial Structure of Ji Wheat 22 Yield Based on Different Stochastic Samplings Yujian Yang * and Xueqin Tong S & T Information Engineering Technology Center of Shandong Academy
SF2930: REGRESION ANALYSIS LECTURE 1 SIMPLE LINEAR REGRESSION.
 SF2930: REGRESION ANALYSIS LECTURE 1 SIMPLE LINEAR REGRESSION. Tatjana Pavlenko 17 January 2018 WHAT IS REGRESSION? INTRODUCTION Regression analysis is a statistical technique for investigating and modeling