Class 9. Query, Measurement & Transformation; Spatial Buffers; Descriptive Summary, Design & Inference
|
|
|
- Damian Bond
- 5 years ago
- Views:
Transcription
1 Class 9 Query, Measurement & Transformation; Spatial Buffers; Descriptive Summary, Design & Inference
2 Spatial Analysis Turns raw data into useful information by adding greater informative content and value Reveals patterns, trends, and anomalies that might otherwise be missed Provides a check on human intuition by helping in situations where the eye might deceive
3 Types of Spatial Analyses There are literally thousands of techniques Six categories are used in this course, each having a distinct conceptual basis: Queries and reasoning Measurements Transformations Descriptive summaries Optimization Hypothesis testing
4 Queries and Reasoning A GIS can respond to queries by presenting data in appropriate views and allowing the user to interact with each view It is often useful to be able to display two or more views at once and to link them together linking views is one important technique of exploratory spatial data analysis

5 The Catalog View Shows folders, databases, and files on the left, and a preview of the contents of a selected data set on the right. The preview can be used to query the data set s metadata, or to look at a thumbnail map, or at a table of attributes. This example shows ESRI s ArcCatalog.

6 The Map View A user can interact with a map view to identify objects and query their attributes, to search for objects meeting specified criteria, or to find the coordinates of objects. This illustration uses ESRI s ArcMap.

7 The Table View Here attributes are displayed in the form of a table, linked to a map view. When objects are selected in the table, they are automatically highlighted in the map view, and vice versa. The table view can be used to answer simple queries about objects and their attributes.
8 Measurements Many tasks require measurement from maps measurement of distance between two points measurement of area, e.g. the area of a parcel of land Such measurements are tedious and inaccurate if made by hand measurement using GIS tools and digital databases is fast, reliable, and accurate
9 Measurement of Length A metric is a rule for determining distance from coordinates The Pythagorean metric gives the straight-line distance between two points on a flat plane The Great Circle metric gives the shortest distance between two points on a spherical globe given their latitudes and longitudes
10 Issues with Length Measurement The length of a true curve is almost always longer than the length of its polyline or polygon representation
11 Issues with Length Measurement Measurements in GIS are often made on horizontal projections of objects length and area may be substantially lower than on a true three-dimensional surface
12 Measurement of Shape Shape measures capture the degree of contortedness of areas, relative to the most compact circular shape by comparing perimeter to the square root of area normalized so that the shape of a circle is 1 the more contorted the area, the higher the shape measure Pattern metrics landscape, class, patch

13 Shape as an Indicator of Gerrymandering in Elections The 12 th Congressional District of North Carolina was drawn in 1992 using a GIS, and designed to be a majorityminority district: with a majority of African American voters, it could be expected to return an African American to Congress. This objective was achieved at the cost of a very contorted shape. The U.S. Supreme Court eventually rejected the design.
14 Slope Angle & Slope Aspect Calculated from a grid of elevations (a digital elevation model) Slope and aspect are calculated at each point in the grid, by comparing the point s elevation to that of its neighbors usually its eight neighbors but the exact method varies in a scientific study, it is important to know exactly what method is used when calculating slope, and exactly how slope is defined
15 Transformations Create new objects and attributes, based on simple rules involving geometric construction or calculation may also create new fields, from existing fields or from discrete objects
16
17
18
19
20
21
22
23 Buffering (Dilation) Create a new object consisting of areas within a user-defined distance of an existing object e.g., to determine areas impacted by a proposed highway e.g., to determine the service area of a proposed hospital Feasible in either raster or vector mode
24 Buffering Polyline Point Polygon
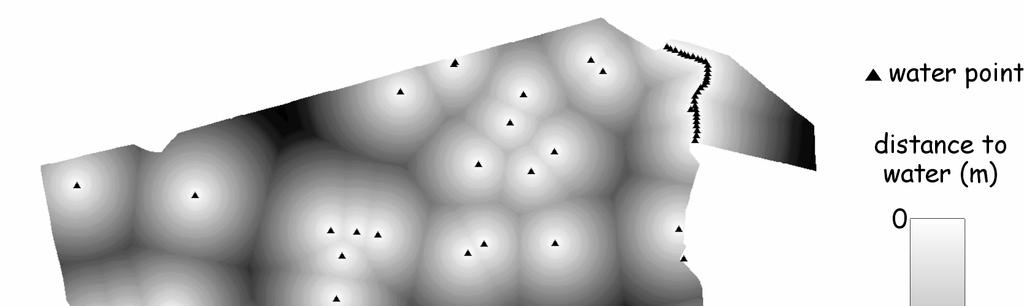
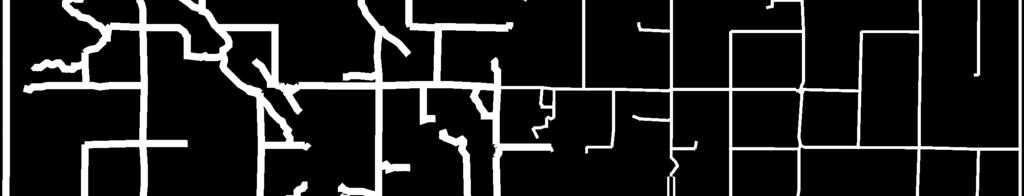
25 Raster Buffering Vary the distance buffered according to values in a friction layer City limits Areas reachable in 5 minutes Areas reachable in 10 minutes Other areas
26
27
28
29
30 Point-in-Polygon Transformation Determine whether a point lies inside or outside a polygon generalization: assign many points to containing polygons used to assign crimes to police precincts, voters to voting districts, accidents to reporting counties
31 Polygon Overlay Two complete layers of polygons are input, representing two classifications of the same area e.g., soil type and land ownership The layers are overlaid, and all intersections are computed creating a new layer each polygon in the new layer has both a soil type and a land ownership the attributes are said to be concatenated The task is often performed in raster
32
33


34
35
36
37
38
39
40
41
42
43

44


45
46 Spatial Interpolation Specifying the likely distance decay linear: w ij = -b d ij negative power: w ij = d ij -b negative exponential: w ij = e -bdij Isotropic and regular relevance to all geographic phenomena? Inductive vs. deductive approaches
47 Spatial interpolation: Spatial Interpolation - estimate continuous (or discretized continuous) surfaces from data at known points Why do this? we have sparse data samples that do not completely cover a study area, and we want complete coverage usually done to represent phenomena that are continuous in reality Examples: turn spot/point samples of elevation heights into a DEM turn temperature samples from weather stations into a temperature surface
48 Interpolation Characteristics Exact vs. inexact interpolators exact: at sample points, the interpolation returns the same value as the original sample inexact: do not return same value at sample points (usually optimize some other characteristic, e.g. minimze squared deviations of interpolated values from sampled values) Global vs. local interpolators global: utilize all sample points to create interpolated surface local: utilize subset of sample points in neighborhood of each location being estimated to create interpolated surface All spatial interpolation is based on a simple (but powerful) observation: Everything in the universe is related to everything else, but closer things are more related. (Tobler s Law)
 many obvious drawbacks including what spatial phenomena does this approximate?")
49 Thiessen (Voronoi) Polygons exact, local probably simplest (and crudest) method of interpolation method: assign value of nearest sample point sample point Do this in ArcView: Analysis Assign Proximity (Spatial Analyst extension) many obvious drawbacks including what spatial phenomena does this approximate? discontinuities at polygon edges
50 local, exact Inverse Distance Weighting basic idea: estimates value at location in output surface by weighting the relative influence of input points in the local area by some inverse function of their distance from the location being estimated issues: effect of distance decay exponent choice (number, selection) of input points used for estimation
51 Spatial Interpolation Values of a field have been measured at a number of sample points There is a need to estimate the complete field to estimate values at points where the field was not measured to create a contour map by drawing isolines between the data points Methods of spatial interpolation are designed to solve this problem
52 Inverse Distance Weighting (IDW) The unknown value of a field at a point is estimated by taking an average over the known values weighting each known value by its distance from the point, giving greatest weight to the nearest points an implementation of Tobler s Law
53 point i known value z i location x i weight w i distance d i unknown value (to be interpolated) location x z (x) = i w z i i i w i The estimate is a weighted average w = i 2 1 d i Weights decline with distance
54 Issues with IDW The range of interpolated values cannot exceed the range of observed values it is important to position sample points to include the extremes of the field this can be very difficult

55 Spatial Pattern & Quadrat Counts
56 Kriging: Spatial Interpolation
57 Quadrat Counts & Nearest Neighbor Analysis Spatial pattern can be described as regular or irregular and further subdivided into clustered, random, or anti-clustered. Application is to discern the locational characteristics of the points rather than their attributes.
58 Quadrat Counts Assessing spatial pattern using a consistently sized and shaped sample unit (e.g., rectangle, square, circle); Poisson distribution model is used in which expected (mean number of points/quadrat) vs. observed patterns are considered; Chi-square analysis is used. Size of quadrat affects Chi-square results. Diffusion of innovation or disease, commercial store patterns in urban areas, sightings of birds, dispersal of seeds.
59 Nearest Neighbor Analysis Measures distances between sample points and their nearest neighbors; mean of the NN distance (observed) is compared to the expected mean distance. Distance may be sample location to nearest point, or point to nearest point.
60 Trend Surface Analysis Data exploratory technique. Uses a general linear model or a 2 nd (linear and quadratic) or 3 rd order (powers and cross-products). Mapping residuals from the fitted trend surface may shed light on the underlying spatial structure of the data.
61 Gravity Models A popular spatial interaction model Force of attraction of two bodies (gravity) is proportional to the product of their masses, but inversely proportional to the squared distance separating them. Interactions between cities of two different populations; cities closer to each other have greater interaction than cities further apart; larger cities exert a greater influence than smaller ones. Model may be expanded to include interactions among a set of centers, variables other than population, measures of intervening opportunity and an agglomeration effect such as in the case of shopping centers and clustering of services.
62 Data Mining Analysis of massive data sets in search for patterns, anomalies, and trends spatial analysis applied on a large scale must be semi-automated because of data volumes widely used in practice, e.g. to detect unusual patterns in credit card use
63 Descriptive Summaries Attempt to summarize useful properties of data sets in one or two statistics The mean or average is widely used to summarize data centers are the spatial equivalent there are several ways of defining centers
64 The Centroid Found for a point set by taking the weighted average of coordinates The balance point
65 Dispersion A measure of the spread of points around a center Useful for determining positional error Related to the width of the kernel used in density estimation
66 Fragmentation Statistics Measure the patchiness of data sets e.g., of vegetation cover in an area Useful in landscape ecology, because of the importance of habitat fragmentation in determining the success of animal and bird populations populations are less likely to survive in highly fragmented landscapes
67 Optimization Spatial analysis can be used to solve many problems of design A spatial decision support system (SDSS) is an adaptation of GIS aimed at solving a particular design problem

68
69
70
71
72
73
74 Location-Allocation Problems Design locations for services, and allocate demand to them, to achieve specified goals Goals might include: minimizing total distance traveled minimizing the largest distance traveled by any customer maximizing profit minimizing a combination of travel distance and facility operating cost
75 Routing Problems Search for optimum routes among several destinations The traveling salesman problem find the shortest tour from an origin, through a set of destinations, and back to the origin
76 Network Analysis Characterized by a set of geographic locations interconnected in a system by a number of routes; a system of lines topologically structured and connecting points. Network indices -- Alpha (number of circuits vs. maximum number), Beta (relations between the edge and the vertex in the network), Gamma (degree of connectivity), Dispersion (overall distribution of the network), Accessibility (spatial relation between a given element of a structure and the remainder of the network), and Smeed s (efficiency of the road network). Location /Allocation supply, demand, impedance, spatial interactions.
77 Optimum Paths Find the best path across a continuous cost surface between defined origin and destination to minimize total cost cost may combine construction, environmental impact, land acquisition, and operating cost used to locate highways, power lines, pipelines requires a raster representation
78 Hypothesis Testing Hypothesis testing is a recognized branch of statistics A sample is analyzed, and inferences are made about the population from which the sample was drawn The sample must normally be drawn randomly and independently from the population
79 Hypothesis Testing with Spatial Data Frequently the data represent all that are available e.g., all of the census tracts of Los Angeles It is consequently difficult to think of such data as a random sample of anything not a random sample of all census tracts Tobler s Law guarantees that independence is problematic unless samples are drawn very far apart
80 Possible Approaches to Inference Treat the data as one of a very large number of possible spatial arrangements useful for testing for significant spatial patterns Discard data until cases are independent no one likes to discard data Use models that account directly for spatial dependence Be content with descriptions and avoid inference
81 Spatial Sampling Sample frames Probability of selection All geographic representations are samples Geographic data are only as good as the sampling scheme used to create them
82 Sample Designs Types of samples Random samples Stratified samples Clustered samples Weighting of observations
83 Examples of Sampling Designs
Outline. 15. Descriptive Summary, Design, and Inference. Descriptive summaries. Data mining. The centroid
 Outline 15. Descriptive Summary, Design, and Inference Geographic Information Systems and Science SECOND EDITION Paul A. Longley, Michael F. Goodchild, David J. Maguire, David W. Rhind 2005 John Wiley
SPATIAL ANALYSIS. Transformation. Cartogram Central. 14 & 15. Query, Measurement, Transformation, Descriptive Summary, Design, and Inference
 14 & 15. Query, Measurement, Transformation, Descriptive Summary, Design, and Inference Geographic Information Systems and Science SECOND EDITION Paul A. Longley, Michael F. Goodchild, David J. Maguire,
Spatial Analysis I. Spatial data analysis Spatial analysis and inference
 Spatial Analysis I Spatial data analysis Spatial analysis and inference Roadmap Outline: What is spatial analysis? Spatial Joins Step 1: Analysis of attributes Step 2: Preparing for analyses: working with
GEOGRAPHY 350/550 Final Exam Fall 2005 NAME:
 1) A GIS data model using an array of cells to store spatial data is termed: a) Topology b) Vector c) Object d) Raster 2) Metadata a) Usually includes map projection, scale, data types and origin, resolution
Types of spatial data. The Nature of Geographic Data. Types of spatial data. Spatial Autocorrelation. Continuous spatial data: geostatistics
 The Nature of Geographic Data Types of spatial data Continuous spatial data: geostatistics Samples may be taken at intervals, but the spatial process is continuous e.g. soil quality Discrete data Irregular:
Introduction to GIS. Dr. M.S. Ganesh Prasad
 Introduction to GIS Dr. M.S. Ganesh Prasad Department of Civil Engineering The National Institute of Engineering, MYSORE ganeshprasad.nie@gmail.com 9449153758 Geographic Information System (GIS) Information
Popular Mechanics, 1954
 Introduction to GIS Popular Mechanics, 1954 1986 $2,599 1 MB of RAM 2017, $750, 128 GB memory, 2 GB of RAM Computing power has increased exponentially over the past 30 years, Allowing the existence of
Geog 469 GIS Workshop. Data Analysis
 Geog 469 GIS Workshop Data Analysis Outline 1. What kinds of need-to-know questions can be addressed using GIS data analysis? 2. What is a typology of GIS operations? 3. What kinds of operations are useful
Basics of GIS. by Basudeb Bhatta. Computer Aided Design Centre Department of Computer Science and Engineering Jadavpur University
 Basics of GIS by Basudeb Bhatta Computer Aided Design Centre Department of Computer Science and Engineering Jadavpur University e-governance Training Programme Conducted by National Institute of Electronics
Transit Time Shed Analyzing Accessibility to Employment and Services
 Transit Time Shed Analyzing Accessibility to Employment and Services presented by Ammar Naji, Liz Thompson and Abdulnaser Arafat Shimberg Center for Housing Studies at the University of Florida www.shimberg.ufl.edu
Introducing GIS analysis
 1 Introducing GIS analysis GIS analysis lets you see patterns and relationships in your geographic data. The results of your analysis will give you insight into a place, help you focus your actions, or
Lecture 4. Spatial Statistics
 Lecture 4 Spatial Statistics Lecture 4 Outline Statistics in GIS Spatial Metrics Cell Statistics Neighborhood Functions Neighborhood and Zonal Statistics Mapping Density (Density surfaces) Hot Spot Analysis
Lecture 5 Geostatistics
 Lecture 5 Geostatistics Lecture Outline Spatial Estimation Spatial Interpolation Spatial Prediction Sampling Spatial Interpolation Methods Spatial Prediction Methods Interpolating Raster Surfaces with
Luc Anselin Spatial Analysis Laboratory Dept. Agricultural and Consumer Economics University of Illinois, Urbana-Champaign
 GIS and Spatial Analysis Luc Anselin Spatial Analysis Laboratory Dept. Agricultural and Consumer Economics University of Illinois, Urbana-Champaign http://sal.agecon.uiuc.edu Outline GIS and Spatial Analysis
Chapter 6. Fundamentals of GIS-Based Data Analysis for Decision Support. Table 6.1. Spatial Data Transformations by Geospatial Data Types
 Chapter 6 Fundamentals of GIS-Based Data Analysis for Decision Support FROM: Points Lines Polygons Fields Table 6.1. Spatial Data Transformations by Geospatial Data Types TO: Points Lines Polygons Fields
Why Is It There? Attribute Data Describe with statistics Analyze with hypothesis testing Spatial Data Describe with maps Analyze with spatial analysis
 6 Why Is It There? Why Is It There? Getting Started with Geographic Information Systems Chapter 6 6.1 Describing Attributes 6.2 Statistical Analysis 6.3 Spatial Description 6.4 Spatial Analysis 6.5 Searching
ENGRG Introduction to GIS
 ENGRG 59910 Introduction to GIS Michael Piasecki October 13, 2017 Lecture 06: Spatial Analysis Outline Today Concepts What is spatial interpolation Why is necessary Sample of interpolation (size and pattern)
Spatial Analyst. By Sumita Rai
 ArcGIS Extentions Spatial Analyst By Sumita Rai Overview What does GIS do? How does GIS work data models Extension to GIS Spatial Analyst Spatial Analyst Tasks & Tools Surface Analysis Surface Creation
GIS for ChEs Introduction to Geographic Information Systems
 GIS for ChEs Introduction to Geographic Information Systems AIChE Webinar John Cirucci 1 GIS for ChEs Introduction to Geographic Information Systems What is GIS? Tools and Methods Applications Examples
What is GIS? Introduction to data. Introduction to data modeling
 What is GIS? Introduction to data Introduction to data modeling 2 A GIS is similar, layering mapped information in a computer to help us view our world as a system A Geographic Information System is a
Representation of Geographic Data
 GIS 5210 Week 2 The Nature of Spatial Variation Three principles of the nature of spatial variation: proximity effects are key to understanding spatial variation issues of geographic scale and level of
Introduction to GIS I
 Introduction to GIS Introduction How to answer geographical questions such as follows: What is the population of a particular city? What are the characteristics of the soils in a particular land parcel?
What are the five components of a GIS? A typically GIS consists of five elements: - Hardware, Software, Data, People and Procedures (Work Flows)
") LECTURE 1 - INTRODUCTION TO GIS Section I - GIS versus GPS What is a geographic information system (GIS)? GIS can be defined as a computerized application that combines an interactive map with a database
LECTURE 1 - INTRODUCTION TO GIS Section I - GIS versus GPS What is a geographic information system (GIS)? GIS can be defined as a computerized application that combines an interactive map with a database
Lecture 9: Geocoding & Network Analysis
 Massachusetts Institute of Technology - Department of Urban Studies and Planning 11.520: A Workshop on Geographic Information Systems 11.188: Urban Planning and Social Science Laboratory Lecture 9: Geocoding
GIS IN ECOLOGY: ANALYZING RASTER DATA
 GIS IN ECOLOGY: ANALYZING RASTER DATA Contents Introduction... 2 Raster Tools and Functionality... 2 Data Sources... 3 Tasks... 4 Getting Started... 4 Creating Raster Data... 5 Statistics... 8 Surface
Canadian Board of Examiners for Professional Surveyors Core Syllabus Item C 5: GEOSPATIAL INFORMATION SYSTEMS
 Study Guide: Canadian Board of Examiners for Professional Surveyors Core Syllabus Item C 5: GEOSPATIAL INFORMATION SYSTEMS This guide presents some study questions with specific referral to the essential
NR402 GIS Applications in Natural Resources
 NR402 GIS Applications in Natural Resources Lesson 1 Introduction to GIS Eva Strand, University of Idaho Map of the Pacific Northwest from http://www.or.blm.gov/gis/ Welcome to NR402 GIS Applications in
Neighborhood Locations and Amenities
 University of Maryland School of Architecture, Planning and Preservation Fall, 2014 Neighborhood Locations and Amenities Authors: Cole Greene Jacob Johnson Maha Tariq Under the Supervision of: Dr. Chao
Nature of Spatial Data. Outline. Spatial Is Special
 Nature of Spatial Data Outline Spatial is special Bad news: the pitfalls of spatial data Good news: the potentials of spatial data Spatial Is Special Are spatial data special? Why spatial data require
Outline. Chapter 1. A history of products. What is ArcGIS? What is GIS? Some GIS applications Introducing the ArcGIS products How does GIS work?
 Outline Chapter 1 Introducing ArcGIS What is GIS? Some GIS applications Introducing the ArcGIS products How does GIS work? Basic data formats The ArcCatalog interface 1-1 1-2 A history of products Arc/Info
IMPERIAL COUNTY PLANNING AND DEVELOPMENT
 IMPERIAL COUNTY PLANNING AND DEVELOPMENT GEODATABASE USER MANUAL FOR COUNTY BUSINESS DEVELOPMENT GIS June 2010 Prepared for: Prepared by: County of Imperial Planning and Development 801 Main Street El
Quality and Coverage of Data Sources
 Quality and Coverage of Data Sources Objectives Selecting an appropriate source for each item of information to be stored in the GIS database is very important for GIS Data Capture. Selection of quality
GIS Level 2. MIT GIS Services
 GIS Level 2 MIT GIS Services http://libraries.mit.edu/gis Email: gishelp@mit.edu TOOLS IN THIS WORKSHOP - Definition Queries - Create a new field in the attribute table - Field Calculator - Add XY Data
Unit 1 Part 2. Concepts Underlying The Geographic Perspective
 Unit 1 Part 2 Concepts Underlying The Geographic Perspective Unit Expectations 1.B Enduring Understanding: Students will be able to.. Know that Geography offers asset of concepts, skills, and tools that
Lecture 8. Spatial Estimation
 Lecture 8 Spatial Estimation Lecture Outline Spatial Estimation Spatial Interpolation Spatial Prediction Sampling Spatial Interpolation Methods Spatial Prediction Methods Interpolating Raster Surfaces
SRJC Applied Technology 54A Introduction to GIS
 SRJC Applied Technology 54A Introduction to GIS Overview Lecture of Geographic Information Systems Fall 2004 Santa Rosa Junior College Presented By: Tim Pudoff, GIS Coordinator, County of Sonoma, Information
Raster Spatial Analysis Specific Theory
 RSATheory.doc 1 Raster Spatial Analysis Specific Theory... 1 Spatial resampling... 1 Mosaic... 3 Reclassification... 4 Slicing... 4 Zonal Operations... 5 References... 5 Raster Spatial Analysis Specific
Michael Harrigan Office hours: Fridays 2:00-4:00pm Holden Hall
 Announcement New Teaching Assistant Michael Harrigan Office hours: Fridays 2:00-4:00pm Holden Hall 209 Email: michael.harrigan@ttu.edu Guofeng Cao, Texas Tech GIST4302/5302, Lecture 2: Review of Map Projection
Spatial Analysis II. Spatial data analysis Spatial analysis and inference
 Spatial Analysis II Spatial data analysis Spatial analysis and inference Roadmap Spatial Analysis I Outline: What is spatial analysis? Spatial Joins Step 1: Analysis of attributes Step 2: Preparing for
INTRODUCTION TO GEOGRAPHIC INFORMATION SYSTEM By Reshma H. Patil
 INTRODUCTION TO GEOGRAPHIC INFORMATION SYSTEM By Reshma H. Patil ABSTRACT:- The geographical information system (GIS) is Computer system for capturing, storing, querying analyzing, and displaying geospatial
Introduction to the 176A labs and ArcGIS
 Introduction to the 176A labs and ArcGIS Acknowledgement: Slides by David Maidment, U Texas-Austin and Francisco Olivera (TAMU) Purpose of the labs Hands-on experience with one software pakage Introduction
Geometric Algorithms in GIS
 Geometric Algorithms in GIS GIS Software Dr. M. Gavrilova GIS System What is a GIS system? A system containing spatially referenced data that can be analyzed and converted to new information for a specific
GIS CONCEPTS ARCGIS METHODS AND. 2 nd Edition, July David M. Theobald, Ph.D. Natural Resource Ecology Laboratory Colorado State University
 GIS CONCEPTS AND ARCGIS METHODS 2 nd Edition, July 2005 David M. Theobald, Ph.D. Natural Resource Ecology Laboratory Colorado State University Copyright Copyright 2005 by David M. Theobald. All rights
GIS = Geographic Information Systems;
 What is GIS GIS = Geographic Information Systems; What Information are we talking about? Information about anything that has a place (e.g. locations of features, address of people) on Earth s surface,
Introduction to Geographic Information Systems (GIS): Environmental Science Focus
: Environmental Science Focus") Introduction to Geographic Information Systems (GIS): Environmental Science Focus September 9, 2013 We will begin at 9:10 AM. Login info: Username:!cnrguest Password: gocal_bears Instructor: Domain: CAMPUS
Introduction to Geographic Information Systems (GIS): Environmental Science Focus September 9, 2013 We will begin at 9:10 AM. Login info: Username:!cnrguest Password: gocal_bears Instructor: Domain: CAMPUS
Acknowledgments xiii Preface xv. GIS Tutorial 1 Introducing GIS and health applications 1. What is GIS? 2
 Acknowledgments xiii Preface xv GIS Tutorial 1 Introducing GIS and health applications 1 What is GIS? 2 Spatial data 2 Digital map infrastructure 4 Unique capabilities of GIS 5 Installing ArcView and the
ENV208/ENV508 Applied GIS. Week 1: What is GIS?
 ENV208/ENV508 Applied GIS Week 1: What is GIS? 1 WHAT IS GIS? A GIS integrates hardware, software, and data for capturing, managing, analyzing, and displaying all forms of geographically referenced information.
Welcome to NR502 GIS Applications in Natural Resources. You can take this course for 1 or 2 credits. There is also an option for 3 credits.
 Welcome to NR502 GIS Applications in Natural Resources. You can take this course for 1 or 2 credits. There is also an option for 3 credits. The 1st credit consists of a series of readings, demonstration,
NCTCOG GIS File Locations
 Boundaries Area Codes k:\bnd\region\area_codes.shp Area Type k:\bnd\region\areatype.shp Ciry Centroids (World) k:\bnd\usa_world\cities.shp City Centroids (NCTCOG Region) k:\bnd\region\city_point.shp vector.vector.bnd_city_point
GEOGRAPHIC INFORMATION SYSTEMS (GIS)
") AN INTRODUCTION TO GEOGRAPHIC INFORMATION SYSTEMS (GIS) Joana Magos Brehm 1, Ali Shehadeh 2 1 Botanical Garden, National Museum of Natural History, University of Lisbon (Portugal) 2 Genetic Resources Unit,
AN INTRODUCTION TO GEOGRAPHIC INFORMATION SYSTEMS (GIS) Joana Magos Brehm 1, Ali Shehadeh 2 1 Botanical Garden, National Museum of Natural History, University of Lisbon (Portugal) 2 Genetic Resources Unit,
Data Structures & Database Queries in GIS
 Data Structures & Database Queries in GIS Objective In this lab we will show you how to use ArcGIS for analysis of digital elevation models (DEM s), in relationship to Rocky Mountain bighorn sheep (Ovis
Texas A&M University
 Texas A&M University CVEN 658 Civil Engineering Applications of GIS Hotspot Analysis of Highway Accident Spatial Pattern Based on Network Spatial Weights Instructor: Dr. Francisco Olivera Author: Zachry
Learning ArcGIS: Introduction to ArcCatalog 10.1
 Learning ArcGIS: Introduction to ArcCatalog 10.1 Estimated Time: 1 Hour Information systems help us to manage what we know by making it easier to organize, access, manipulate, and apply knowledge to the
Applications: Introduction Task 1: Introduction to ArcCatalog Task 2: Introduction to ArcMap Challenge Question References
 CHAPTER 1 INTRODUCTION 1.1 GIS? 1.1.1 Components of a GIS 1.1.2 A Brief History of GIS 1.1.3 GIS Software Products Box 1.1 A List of GIS Software Producers and Their Main Products 1.2 GIS Applications
GIS CONCEPTS ARCGIS METHODS AND. 3 rd Edition, July David M. Theobald, Ph.D. Warner College of Natural Resources Colorado State University
 GIS CONCEPTS AND ARCGIS METHODS 3 rd Edition, July 2007 David M. Theobald, Ph.D. Warner College of Natural Resources Colorado State University Copyright Copyright 2007 by David M. Theobald. All rights
EEOS Spatial Databases and GIS Applications
 EEOS 381 - Spatial Databases and GIS Applications Lecture 7 Spatial Analysis What is Spatial Analysis? The crux of GIS, Real GIS Methods of turning spatial data into usable information Answers questions
Midterm Exam. 2) What are three important things to keep in mind when selecting colors for a map? (5)
 What are three important things to keep in mind when selecting colors for a map? (5)") Midterm Exam File Name: LASTNAME_Midterm.pdf Make sure to include your Name, UWNetID, course number, and quarter and year, on the document (points will be deducted if you have not identified your work).
Midterm Exam File Name: LASTNAME_Midterm.pdf Make sure to include your Name, UWNetID, course number, and quarter and year, on the document (points will be deducted if you have not identified your work).
Are You Maximizing The Value Of All Your Data?
 Are You Maximizing The Value Of All Your Data? Using The SAS Bridge for ESRI With ArcGIS Business Analyst In A Retail Market Analysis SAS and ESRI: Bringing GIS Mapping and SAS Data Together Presented
Sampling The World. presented by: Tim Haithcoat University of Missouri Columbia
 Sampling The World presented by: Tim Haithcoat University of Missouri Columbia Compiled with materials from: Charles Parson, Bemidji State University and Timothy Nyerges, University of Washington Introduction
GIS & Spatial Analysis in MCH
 GIS & Spatial Analysis in MCH Russell S. Kirby, University of Alabama at Birmingham rkirby@uab.edu, office 205-934-2985 Dianne Enright, North Carolina State Center for Health Statistics dianne.enright@ncmail.net
In this exercise we will learn how to use the analysis tools in ArcGIS with vector and raster data to further examine potential building sites.
 GIS Level 2 In the Introduction to GIS workshop we filtered data and visually examined it to determine where to potentially build a new mixed use facility. In order to get a low interest loan, the building
Give 4 advantages of using ICT in the collection of data. Give. Give 4 disadvantages in the use of ICT in the collection of data
 Give 4 advantages of using ICT in the collection of data can use a handheld GPS to get accurate location information which can be used to show data linked to specific locations within a GIS can collect
Concepts and Applications of Kriging. Eric Krause
 Concepts and Applications of Kriging Eric Krause Sessions of note Tuesday ArcGIS Geostatistical Analyst - An Introduction 8:30-9:45 Room 14 A Concepts and Applications of Kriging 10:15-11:30 Room 15 A
Tutorial 8 Raster Data Analysis
 Objectives Tutorial 8 Raster Data Analysis This tutorial is designed to introduce you to a basic set of raster-based analyses including: 1. Displaying Digital Elevation Model (DEM) 2. Slope calculations
GIS Quick Facts. CIVL 1101 GIS Quick Facts 1/5.
 CIVL 1101 1/5 What is GIS? Geographic Information Systems (GIS) provide a platform for displaying and analyzing spatial data. GIS systems allow you to view multiple layers of data simultaneously. GIS is
Concepts and Applications of Kriging. Eric Krause Konstantin Krivoruchko
 Concepts and Applications of Kriging Eric Krause Konstantin Krivoruchko Outline Introduction to interpolation Exploratory spatial data analysis (ESDA) Using the Geostatistical Wizard Validating interpolation
Understanding and Measuring Urban Expansion
 VOLUME 1: AREAS AND DENSITIES 21 CHAPTER 3 Understanding and Measuring Urban Expansion THE CLASSIFICATION OF SATELLITE IMAGERY The maps of the urban extent of cities in the global sample were created using
Applying MapCalc Map Analysis Software
 Applying MapCalc Map Analysis Software Generating Surface Maps from Point Data: A farmer wants to generate a set of maps from soil samples he has been collecting for several years. Previously, he would
John Laznik 273 Delaplane Ave Newark, DE (302)
") Office Address: John Laznik 273 Delaplane Ave Newark, DE 19711 (302) 831-0479 Center for Applied Demography and Survey Research College of Human Services, Education and Public Policy University of Delaware
Office Address: John Laznik 273 Delaplane Ave Newark, DE 19711 (302) 831-0479 Center for Applied Demography and Survey Research College of Human Services, Education and Public Policy University of Delaware
Theory, Concepts and Terminology
 GIS Workshop: Theory, Concepts and Terminology 1 Theory, Concepts and Terminology Suggestion: Have Maptitude with a map open on computer so that we can refer to it for specific menu and interface items.
A Basic Introduction to Geographic Information Systems (GIS) ~~~~~~~~~~
 ~~~~~~~~~~") A Basic Introduction to Geographic Information Systems (GIS) ~~~~~~~~~~ Rev. Ronald J. Wasowski, C.S.C. Associate Professor of Environmental Science University of Portland Portland, Oregon 3 September
A Basic Introduction to Geographic Information Systems (GIS) ~~~~~~~~~~ Rev. Ronald J. Wasowski, C.S.C. Associate Professor of Environmental Science University of Portland Portland, Oregon 3 September
ArcMap - EXPLORING THE DATABASE Part I. SPATIAL DATA FORMATS Part II
 Week 5 ArcMap - EXPLORING THE DATABASE Part I SPATIAL DATA FORMATS Part II topics of the week Exploring the Database More on the Table of Contents Exploration tools Identify, Find, Measure, Map tips, Hyperlink,
Outline. Geographic Information Analysis & Spatial Data. Spatial Analysis is a Key Term. Lecture #1
 Geographic Information Analysis & Spatial Data Lecture #1 Outline Introduction Spatial Data Types: Objects vs. Fields Scale of Attribute Measures GIS and Spatial Analysis Spatial Analysis is a Key Term
GIS Test Drive What a Geographic Information System Is and What it Can Do. Alison Davis-Holland
 GIS Test Drive What a Geographic Information System Is and What it Can Do Alison Davis-Holland adavisholland@gmail.com WHO AM I? Geospatial Analyst M.S. in Geographic and Cartographic Sciences Use GIS
4. GIS Implementation of the TxDOT Hydrology Extensions
 4. GIS Implementation of the TxDOT Hydrology Extensions A Geographic Information System (GIS) is a computer-assisted system for the capture, storage, retrieval, analysis and display of spatial data. It
Spatial Thinking and Modeling of Network-Based Problems
 Spatial Thinking and Modeling of Network-Based Problems Presentation at the SPACE Workshop Columbus, Ohio, July 1, 25 Shih-Lung Shaw Professor Department of Geography University of Tennessee Knoxville,
The Attractive Side of Corpus Christi: A Study of the City s Downtown Economic Growth
 The Attractive Side of Corpus Christi: A Study of the City s Downtown Economic Growth GISC PROJECT DR. LUCY HUANG SPRING 2012 DIONNE BRYANT Introduction Background As a GIS Intern working with the City
Introduction-Overview. Why use a GIS? What can a GIS do? Spatial (coordinate) data model Relational (tabular) data model
 data model Relational (tabular) data model") Introduction-Overview Why use a GIS? What can a GIS do? How does a GIS work? GIS definitions Spatial (coordinate) data model Relational (tabular) data model intro_gis.ppt 1 Why use a GIS? An extension
Introduction-Overview Why use a GIS? What can a GIS do? How does a GIS work? GIS definitions Spatial (coordinate) data model Relational (tabular) data model intro_gis.ppt 1 Why use a GIS? An extension
GIS for the Non-Expert
 GIS for the Non-Expert Ann Forsyth University of Minnesota February 2006 GIS for the Non-Expert 1. Definitions and problems 2. Measures being tested in Twin Cities Walking Study Basic approach, data, variables
11/8/2018. Spatial Interpolation & Geostatistics. Kriging Step 1
 (Z i Z j ) 2 / 2 (Z i Zj) 2 / 2 Semivariance y 11/8/2018 Spatial Interpolation & Geostatistics Kriging Step 1 Describe spatial variation with Semivariogram Lag Distance between pairs of points Lag Mean
The Nature of Geographic Data
 4 The Nature of Geographic Data OVERVIEW Elaborates on the spatial is special theme Focuses on how phenomena vary across space and the general nature of geographic variation Describes the main principles
GIS IN ECOLOGY: ANALYZING RASTER DATA
 GIS IN ECOLOGY: ANALYZING RASTER DATA Contents Introduction... 2 Tools and Functionality for Raster Data... 2 Data Sources... 3 Tasks... 4 Getting Started... 4 Creating Raster Data... 5 Summary Statistics...
USING GIS IN WATER SUPPLY AND SEWER MODELLING AND MANAGEMENT
 USING GIS IN WATER SUPPLY AND SEWER MODELLING AND MANAGEMENT HENRIETTE TAMAŠAUSKAS*, L.C. LARSEN, O. MARK DHI Water and Environment, Agern Allé 5 2970 Hørsholm, Denmark *Corresponding author, e-mail: htt@dhigroup.com
THE 3D SIMULATION INFORMATION SYSTEM FOR ASSESSING THE FLOODING LOST IN KEELUNG RIVER BASIN
 THE 3D SIMULATION INFORMATION SYSTEM FOR ASSESSING THE FLOODING LOST IN KEELUNG RIVER BASIN Kuo-Chung Wen *, Tsung-Hsing Huang ** * Associate Professor, Chinese Culture University, Taipei **Master, Chinese
Abstract: Contents. Literature review. 2 Methodology.. 2 Applications, results and discussion.. 2 Conclusions 12. Introduction
 Abstract: Landfill is one of the primary methods for municipal solid waste disposal. In order to reduce the environmental damage and to protect the public health and welfare, choosing the site for landfill
GIST 4302/5302: Spatial Analysis and Modeling Lecture 2: Review of Map Projections and Intro to Spatial Analysis
 GIST 4302/5302: Spatial Analysis and Modeling Lecture 2: Review of Map Projections and Intro to Spatial Analysis Guofeng Cao http://www.spatial.ttu.edu Department of Geosciences Texas Tech University guofeng.cao@ttu.edu
ArcGIS Pro: Analysis and Geoprocessing. Nicholas M. Giner Esri Christopher Gabris Blue Raster
 ArcGIS Pro: Analysis and Geoprocessing Nicholas M. Giner Esri Christopher Gabris Blue Raster Agenda What is Analysis and Geoprocessing? Analysis in ArcGIS Pro - 2D (Spatial xy) - 3D (Elevation - z) - 4D
Introduction To Raster Based GIS Dr. Zhang GISC 1421 Fall 2016, 10/19
 Introduction To Raster Based GIS Dr. Zhang GISC 1421 Fall 2016, 10/19 Model of the course Using and making maps Navigating GIS maps Map design Working with spatial data Geoprocessing Spatial data infrastructure
Introduction to Geographic Information Systems
 Introduction to Geographic Information Systems Lynn_Carlson@brown.edu 401-863-9917 The Environmental And Remote TecHnologies Lab MacMillan Hall, Room 105 http://www.brown.edu/research/earthlab/ Outline
BASIC SPATIAL ANALYSIS TOOLS IN A GIS. data set queries basic statistics buffering overlay reclassification
 BASIC SPATIAL ANALYSIS TOOLS IN A GIS data set queries basic statistics buffering overlay reclassification GIS ANALYSIS TOOLS GIS ANALYSIS TOOLS Database tools: query and summarize (similar to spreadsheet
Introduction to GIS. Phil Guertin School of Natural Resources and the Environment GeoSpatial Technologies
 Introduction to GIS Phil Guertin School of Natural Resources and the Environment dguertin@cals.arizona.edu Mapping GeoSpatial Technologies Traditional Survey Global Positioning Systems (GPS) Remote Sensing
GIST 4302/5302: Spatial Analysis and Modeling
 GIST 4302/5302: Spatial Analysis and Modeling Lecture 2: Review of Map Projections and Intro to Spatial Analysis Guofeng Cao http://thestarlab.github.io Department of Geosciences Texas Tech University
Geographical Information Systems
 Geographical Information Systems Geographical Information Systems (GIS) is a relatively new technology that is now prominent in the ecological sciences. This tool allows users to map geographic features
Spatial analysis. Spatial descriptive analysis. Spatial inferential analysis:
 Spatial analysis Spatial descriptive analysis Point pattern analysis (minimum bounding box, mean center, weighted mean center, standard distance, nearest neighbor analysis) Spatial clustering analysis
Trip Distribution Modeling Milos N. Mladenovic Assistant Professor Department of Built Environment
 Trip Distribution Modeling Milos N. Mladenovic Assistant Professor Department of Built Environment 25.04.2017 Course Outline Forecasting overview and data management Trip generation modeling Trip distribution
SPACE Workshop NSF NCGIA CSISS UCGIS SDSU. Aldstadt, Getis, Jankowski, Rey, Weeks SDSU F. Goodchild, M. Goodchild, Janelle, Rebich UCSB
 SPACE Workshop NSF NCGIA CSISS UCGIS SDSU Aldstadt, Getis, Jankowski, Rey, Weeks SDSU F. Goodchild, M. Goodchild, Janelle, Rebich UCSB August 2-8, 2004 San Diego State University Some Examples of Spatial
ESRI INTERNATIONAL USER CONFERENCE July 11 15, 2011 San Diego, CA - USA. Spatial analysis of health facilities in Yola, Nigeria, using GIS
 ESRI INTERNATIONAL USER CONFERENCE July 11 15, 2011 San Diego, CA - USA Spatial analysis of health facilities in Yola, Nigeria, using GIS Abdurrahman Belel ISMAILA 1 belelismaila@yahoo.com Nurünnisa USUL
The Use of Geographic Information Systems (GIS) by Local Governments. Giving municipal decision-makers the power to make better decisions
 by Local Governments. Giving municipal decision-makers the power to make better decisions") The Use of Geographic Information Systems (GIS) by Local Governments Giving municipal decision-makers the power to make better decisions Case Study: Examples of GIS Usage by Local Governments in North
The Use of Geographic Information Systems (GIS) by Local Governments Giving municipal decision-makers the power to make better decisions Case Study: Examples of GIS Usage by Local Governments in North
Spatial Interpolation & Geostatistics
 (Z i Z j ) 2 / 2 Spatial Interpolation & Geostatistics Lag Lag Mean Distance between pairs of points 1 y Kriging Step 1 Describe spatial variation with Semivariogram (Z i Z j ) 2 / 2 Point cloud Map 3
Developing Spatial Awareness :-
 Developing Spatial Awareness :- We begin to exercise our geographic skill by examining he types of objects and features we encounter. Four different spatial objects in the real world: Point, Line, Areas