SF2930: REGRESION ANALYSIS LECTURE 1 SIMPLE LINEAR REGRESSION.
|
|
|
- Virginia Garrison
- 5 years ago
- Views:
Transcription
1 SF2930: REGRESION ANALYSIS LECTURE 1 SIMPLE LINEAR REGRESSION. Tatjana Pavlenko 17 January 2018
2 WHAT IS REGRESSION? INTRODUCTION Regression analysis is a statistical technique for investigating and modeling the relationship between variables. The reason why it is so widely applied is because it provides the answer to an everyday question, namely how a response variable of special interest depends on several other, explanatory variables.
3 WHAT IS REGRESSION? EXAMPLES Applications of regression techniques are numerous; example include engineering, medical, biological and social sciences, physical and chemical sciences, economics,... Regression is probably is the most widely used statistical methodology. Examples of applied problems and questions in which regression might be helpful: how the apartment prise depends on size, location, floor, closeness to subway,... how growing of plants depends on fertilizer, soil quality,... how home insurance premium depends on age of homeowner, value of the home and its contents, region,... In various quantitative settings, the regression techniques models the relationship between the response variable of special interests (Y ) and a (set) x 1,... x k of explanatory or predictor variables.
4 REGRESSION MATHEMATICS Linking the response variable to the predictors: Y = f (x 1,..., x k ) }{{} deterministic + }{{} ε, random ε is the error term which is can neither be controlled or predicted. The goal is to learn about the function f ( ). In full generality, finding f ( ) without any conditions is very difficult: function space is infinite-dimensional! Solution: restrict the form of f ( ). Linear modeling: Y = β 0 + β 1 x β k x k + ε. Finding f boils down to determining β 0, β 1,..., β k from the data.
5 REGRESSION AND MODEL BUILDING Why modeling? It is stated once by George Box that All models are wrong, but some are useful. Certain degree of variability (uncertainty) is present in almost all processes. Most of this variability can not be modeled with deterministic methods of mathematics. Statistics (mathematics under uncertainty) provides a powerful toll of modeling phenomena under uncertainty. Larger data collected in real-world applications demand models in order to extract big knowledge of big data! In this course we start with simple but highly applicable, linear regression models. We then turn to more advance subjects.
6 REGRESSION AND MODEL BUILDING (CONT.) In this course we start with highly applicable, simple linear regression models. It is rather simple modes but the tools constructed within the simple linear regression will be naturally extended to the multiple case. Later in the course we turn to more advance subject such as multiple linear regression logistic regression Generalized linear models containing Poisson and negative binomial regression

7 EXAMPLE FIGURE: The wash water tank on SAS aircrafts. It is impossible to predict exactly the amount of wash water needed, therefore the tank is always filled to 100% at Arlanda airport. The project on minimizing the amount of water is performed with the main goal to lower the weight of the aircraft, and as a result reduce fuel consumption and cost. Goal: to investigate (to model!) the relationship between wash water consumption (target variable) and number of passengers, duration of a flight, time of the flight (night/day),... (explanatory variables). Statistical approach: multiple linear regression analysis.

8 EXAMPLE: LINEAR REGRESSION FOR ADVERTISING DATA FIGURE: The Advertising data set. The plots displays sales for a particular product as a function of advertising budget for TV, radio and newspaper, for 200 different markes. Each blue line represents the simple model that can be used to predict sales from each feature variable.
9 LINEAR REGRESSION FOR ADVERTISING DATA. Advertising data, see Ch. 2 in ISL. The goal is using the data, to design a marketing plan (for the next year) that will result in high product sales. Specific questions are (see Intro to Ch. 3 in ISL): Q1: Is there a (linear) relationship between advertising budget and sales? Q2: How strong is the relationship between advertising budget and sales? Q3: Which media contribute to sales (Which predictors are associated with response)? Q4: How to estimate effect of each variable on sales? How accurate are these estimates? Q5: How can we predict future sales? Q6: Is the synergy among the advertising media?
10 LINEAR REGRESSION - AN APPROACH FOR MODELING AND PREDICTION The goals of such regression analysis are usually two-fold: to model the relation between output Y and input vector x = (x 1,..., x k ), and to specify which of the predictor variables have effect on the output variable Y, as well as to quantify the strength of this relation (The regression equation, inference). Using the regression equation, to predict the expected response value of Y for an arbitrary (new) configuration of x 1,..., x k. The dependence of Y on x = (x 1,..., x k ) is assumed to be linear, i.e. the model formula is Y = β 0 + β 1 x 1 + β k x k + ε, where β 0,..., β k are unknown coefficients or parameters, and ε is the random error, which accounts for measurement error and effect of other variables not explicitly considered in the model.
11 GOALS IN REGRESSION ANALYSIS A good fit. Estimating a (hyper)-plane over x 1,...,x k to explain the response such that the errors are small. The standard tool is Least Squares estimates, LS. Good parameter estimates are useful to describe the change of the response when varying some some predictor variable(s). Good prediction is useful to predict a new response as a function of new predictor variables. Uncertainties and significance with the three goals above. Development of a good model: In an interactive process, with the help of methods for the above goals, we may change parts of the model to come up with a better mode.
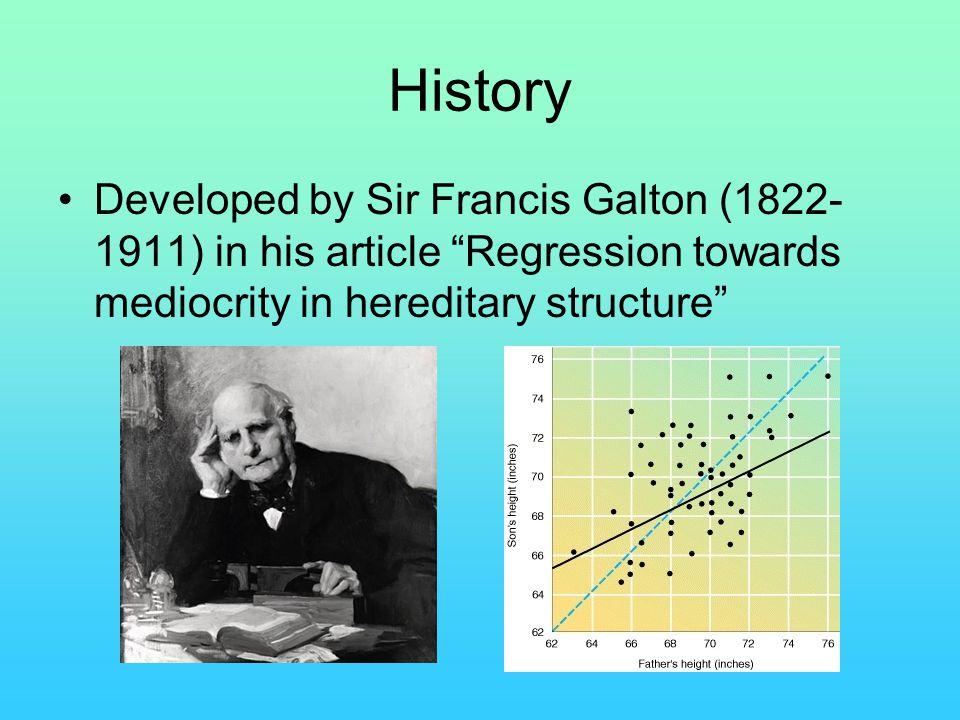
12 WHY CALL REGRESSION?
13 HOW REGRESSION GOT ITS NAME? In the late 1800 s, a scientist Sir Francis Galton was working with large observational studies on humans, in part with the data on the heights of fathers and first sons. In terms of simple regression model x was the height of the father and Y was the height of the first, fully grown, son. Goal: to predict Y in terms of x. Galton concluded: For father s whose heights were taller than the average, the LS line predicts the son to be shorter than the father. Likewise, for father s whose heights were shorter than the average, the line predicts the son to be taller than the father. There is a regression towards the mean effect!
14 SIMPLE LINEAR REGRESSION We begin with a mathematically most simple way of describing the relation between the variables: the linear relationship between a continuous response variable Y in dependence on a single explanatory variable x (simple linear regression model) several explanatory variables x 1,..., x k (multiple regression model) Later in the course we will consider modeling of the nonlinear relationship between a binary response Y and a set of explanatory variables x 1,..., x k (logistic regression). additional models when Y is discrete.
15 SIMPLE LINEAR REGRESSION The simple linear regression model is Y = β 0 + β 1 x + ε, where the intercept β 0 and the slope β 1 are unknown constants, and ε is a random error component. Model, interpretation of variables and parameters: Y is a continuous dependent variable, assumed to be random and called for response or outcome. x is independent variable assumed to be non-random, i.e. we focus on a fixed x-case. (Random X -case will be considered later in the course). For the random error ε, assume that E (ε) = 0 and V (ε) = σ 2 (σ 2 is unknown) β 0 and β 1 are called regression coefficients, assumed non-random. E (Y ) = β 0 + β 1 x and V (Y ) = σ 2, because β 0, β 1 and x are non-random.
16 BRING THE data INTO CONSIDERATION Given is a set of paired data points (y i, x i ) obtained for i = 1,..., n observational units; each y i is the observed value of a r.v. Y i, i.e. a generic observation i is modeled as Y i = β 0 + β 1 x i + ε i. Besides linearity of the model, we assume that The linear regression equation is correct: E (ε i ) = 0 for all i. All x s are exact, i.e we can observe x i s perfectly. The variance of the errors is constant (homoscedasticity), i.e. V (ε i ) = σ 2 for all i. ε i are pairwise uncorrelated, i.e Cov(ε i, ε j ) = 0 for all i = j. Since the only random element in the model is ε i, Y i s have also E (Y i ) = β 0 + β 1 x i and common variance σ 2. For purpose of making tests of significance, we assume that ε i are iid N(0, σ 2 ). Then Y i are iid and Y i N(β 0 + β 1 x i, σ 2 ).
17 A LINEAR FIT Sales TV FIGURE: Drawing the linear regression line for Advertising+ data (see Ex 1 in Ch 3 of ISL). The plot displays the regression of sales+ onto TV+. The linear fit is obtained by minimizing the sum of squared errors. Each gray vertical line represents an error and the fit make a compromise by averaging the squares of errors.
18 LEAST SQUARES FIT Example with Advertising+ above. Q: How to fit a straight line that fits the data well? Our strategy is to fit the line in such a way such that the squared errors are minimal. This is called Least Squares (LS) fitting. Residuals vs. errors. The residual e i = y i ŷ i is the the difference between the observed and the fitted y-value for the ith observation. Residuals are numerical realizations of random errors ε i. Illustration of residuals: see white board. LS fitting strategy: to fit the regression line for which the sum of squared residuals is minimized, i. e. n i=1 ei 2 min.
19 LEAST SQUARES FIT (CONT.) More precisely, given a set of observations (y i, x i ), i = 1,..., n the goal is to obtain estimators of β 0 and β 1, (say ˆβ 0 and ˆβ 1 ) which minimize the LS objective function S(β 0, β 1 ) = n i=1 (y i (β 0 + β 1 x i )) 2. Solution strategy: taking partial derivatives on S(β 0, β 1 ) with respect to β 0 and β 1, and setting them to zero. S(β 0, β 1 ) β 0 ˆβ 0, ˆβ 1 = 0, S(β 0, β 1 ) β 1 ˆβ 0, ˆβ 1 = 0. This results in a system of linear equations, called for normal equations. These can be solved simultaneously to yield computing formulas for the LS estimates, ˆβ 0 and ˆβ 1 in terms of the observed data (y i, x i ), i = 1,..., n.
20 LEAST SQUARES SOLUTION The LS estimates of β 0 and β 1 are computed as ˆβ 0 = ȳ ˆβ 1 x, ˆβ 1 = n i=1 (x i x)(y i ȳ) n i=1 (x i x) 2 = S xy S xx. The fitted model: ŷ = ˆβ 0 + ˆβ 1 x Residuals: e i = y i ŷ i = observed predicted. SS Res = n ei 2 = i=1 n i=1 (y i ŷ i ) 2. A convenient working formula: SS Res = SS T ˆβ 1 S xy, where SS T = n i=1 (y i ȳ) 2. See mathematics on the board. We also obtain the estimate of the variance of the error term (residual mean square measure of residuals variability): ˆσ 2 = s 2 = 1 n 2 n i=1 (y i ŷ) 2 = 1 n 2 n ei 2 i=1 = SS Res n 2 = MS Res.
21 PROPERTIES OF LS ESTIMATORS The LS estimators of β 0 and β 1 have several important properties: ˆβ 0 and ˆβ 1 are linear combinations of the observations y i : ˆβ 1 = S n xy = S xx c i y i, c i = x i x, i = 1,..., n. i=1 S xx Assuming that the model is correct i.e. E (Y i ) = β 0 + β 1 x i, ˆβ 0 and ˆβ 1 are unbiased: E ( ˆβ 0 ) = β 0, E ( ˆβ 1 ) = β 1 The variances of ˆβ 0 and ˆβ 1 are found as (see math and interpretation of V ( ˆβ 1 ) on the board) ( 1 V ( ˆβ 0 ) = σ 2 n + x 2 ), V ( ˆβ 1 ) = σ2. S xx S xx
22 OPTIMALITY OF LS ESTIMATORS Gauss-Markov theorem states the result on the mathematical optimality of the LS: assuming that the following conditions are met, E (ε i ) = 0, (i.e. the relation is a straight line), V (ε i ) = σ for i = 1,..., n, Cov(ε i, ε j ) = 0 for i = j = 1,..., n, (the errors are uncorrelated), the LS estimators are unbiased and have minimum variance when compared with all other unbiased estimators that are linear combinations of y i. By Gauss-Markov thm, LS estimators are Best Linear Unbiased Estimators, (BLUE), where best means minimum variance. Later on in the course: Gauss-Markov theorem for the more general multiple regression, of which simple linear regression is a special case.
23 BENEFITS OF LS APPROACH Mathematically... The fitted line goes through the center of gravity ( x, ȳ) of the data. The LS technique is simple in the sense that the solutions, ˆβ 0 and ˆβ 1, are obtained in closed form as functions of (x i, y i ). ˆβ 0 and ˆβ 1 are unbiased estimators Large sample properties of the LS estimates have some deeper mathematical advantages (approximate normality of coefficient estimators), and exact properties assuming Gaussian errors. Will be presented later in the course.
STAT5044: Regression and Anova. Inyoung Kim
 STAT5044: Regression and Anova Inyoung Kim 2 / 47 Outline 1 Regression 2 Simple Linear regression 3 Basic concepts in regression 4 How to estimate unknown parameters 5 Properties of Least Squares Estimators:
Ch 2: Simple Linear Regression
 Ch 2: Simple Linear Regression 1. Simple Linear Regression Model A simple regression model with a single regressor x is y = β 0 + β 1 x + ɛ, where we assume that the error ɛ is independent random component
Simple Linear Regression
 Simple Linear Regression ST 430/514 Recall: A regression model describes how a dependent variable (or response) Y is affected, on average, by one or more independent variables (or factors, or covariates)
Chapter 1. Linear Regression with One Predictor Variable
 Chapter 1. Linear Regression with One Predictor Variable 1.1 Statistical Relation Between Two Variables To motivate statistical relationships, let us consider a mathematical relation between two mathematical
15.0 Linear Regression
 15.0 Linear Regression 1 Answer Questions Lines Correlation Regression 15.1 Lines The algebraic equation for a line is Y = β 0 + β 1 X 2 The use of coordinate axes to show functional relationships was
Regression Models - Introduction
 Regression Models - Introduction In regression models there are two types of variables that are studied: A dependent variable, Y, also called response variable. It is modeled as random. An independent
Regression Models - Introduction
 Regression Models - Introduction In regression models, two types of variables that are studied: A dependent variable, Y, also called response variable. It is modeled as random. An independent variable,
Lecture 5: Clustering, Linear Regression
 Lecture 5: Clustering, Linear Regression Reading: Chapter 10, Sections 3.1-3.2 STATS 202: Data mining and analysis October 4, 2017 1 / 22 .0.0 5 5 1.0 7 5 X2 X2 7 1.5 1.0 0.5 3 1 2 Hierarchical clustering
Lecture 5: Clustering, Linear Regression
 Lecture 5: Clustering, Linear Regression Reading: Chapter 10, Sections 3.1-3.2 STATS 202: Data mining and analysis October 4, 2017 1 / 22 Hierarchical clustering Most algorithms for hierarchical clustering
Chapter 1 Linear Regression with One Predictor
 STAT 525 FALL 2018 Chapter 1 Linear Regression with One Predictor Professor Min Zhang Goals of Regression Analysis Serve three purposes Describes an association between X and Y In some applications, the
27. SIMPLE LINEAR REGRESSION II
 27. SIMPLE LINEAR REGRESSION II The Model In linear regression analysis, we assume that the relationship between X and Y is linear. This does not mean, however, that Y can be perfectly predicted from X.
Statistics for Engineers Lecture 9 Linear Regression
 Statistics for Engineers Lecture 9 Linear Regression Chong Ma Department of Statistics University of South Carolina chongm@email.sc.edu April 17, 2017 Chong Ma (Statistics, USC) STAT 509 Spring 2017 April
Introduction to Estimation Methods for Time Series models. Lecture 1
 Introduction to Estimation Methods for Time Series models Lecture 1 Fulvio Corsi SNS Pisa Fulvio Corsi Introduction to Estimation () Methods for Time Series models Lecture 1 SNS Pisa 1 / 19 Estimation
Simple linear regression
 Simple linear regression Prof. Giuseppe Verlato Unit of Epidemiology & Medical Statistics, Dept. of Diagnostics & Public Health, University of Verona Statistics with two variables two nominal variables:
Lecture 5: Clustering, Linear Regression
 Lecture 5: Clustering, Linear Regression Reading: Chapter 10, Sections 3.1-2 STATS 202: Data mining and analysis Sergio Bacallado September 19, 2018 1 / 23 Announcements Starting next week, Julia Fukuyama
STAT 100C: Linear models
 STAT 100C: Linear models Arash A. Amini June 9, 2018 1 / 56 Table of Contents Multiple linear regression Linear model setup Estimation of β Geometric interpretation Estimation of σ 2 Hat matrix Gram matrix
Estadística II Chapter 4: Simple linear regression
 Estadística II Chapter 4: Simple linear regression Chapter 4. Simple linear regression Contents Objectives of the analysis. Model specification. Least Square Estimators (LSE): construction and properties
Lecture 14 Simple Linear Regression
 Lecture 4 Simple Linear Regression Ordinary Least Squares (OLS) Consider the following simple linear regression model where, for each unit i, Y i is the dependent variable (response). X i is the independent
Homoskedasticity. Var (u X) = σ 2. (23)
 = σ 2. (23)") Homoskedasticity How big is the difference between the OLS estimator and the true parameter? To answer this question, we make an additional assumption called homoskedasticity: Var (u X) = σ 2. (23) This
Homoskedasticity How big is the difference between the OLS estimator and the true parameter? To answer this question, we make an additional assumption called homoskedasticity: Var (u X) = σ 2. (23) This
1. Simple Linear Regression
 1. Simple Linear Regression Suppose that we are interested in the average height of male undergrads at UF. We put each male student s name (population) in a hat and randomly select 100 (sample). Then their
Linear Regression. 1 Introduction. 2 Least Squares
 Linear Regression 1 Introduction It is often interesting to study the effect of a variable on a response. In ANOVA, the response is a continuous variable and the variables are discrete / categorical. What
Regression - Modeling a response
 Regression - Modeling a response We often wish to construct a model to Explain the association between two or more variables Predict the outcome of a variable given values of other variables. Regression
Section 3: Simple Linear Regression
 Section 3: Simple Linear Regression Carlos M. Carvalho The University of Texas at Austin McCombs School of Business http://faculty.mccombs.utexas.edu/carlos.carvalho/teaching/ 1 Regression: General Introduction
Simple linear regression
 Simple linear regression Biometry 755 Spring 2008 Simple linear regression p. 1/40 Overview of regression analysis Evaluate relationship between one or more independent variables (X 1,...,X k ) and a single
Marcel Dettling. Applied Statistical Regression AS 2012 Week 05. ETH Zürich, October 22, Institute for Data Analysis and Process Design
 Marcel Dettling Institute for Data Analysis and Process Design Zurich University of Applied Sciences marcel.dettling@zhaw.ch http://stat.ethz.ch/~dettling ETH Zürich, October 22, 2012 1 What is Regression?
Economics 620, Lecture 2: Regression Mechanics (Simple Regression)
") 1 Economics 620, Lecture 2: Regression Mechanics (Simple Regression) Observed variables: y i ; x i i = 1; :::; n Hypothesized (model): Ey i = + x i or y i = + x i + (y i Ey i ) ; renaming we get: y i =
1 Economics 620, Lecture 2: Regression Mechanics (Simple Regression) Observed variables: y i ; x i i = 1; :::; n Hypothesized (model): Ey i = + x i or y i = + x i + (y i Ey i ) ; renaming we get: y i =
Mathematics for Economics MA course
 Mathematics for Economics MA course Simple Linear Regression Dr. Seetha Bandara Simple Regression Simple linear regression is a statistical method that allows us to summarize and study relationships between
Simple Linear Regression. (Chs 12.1, 12.2, 12.4, 12.5)
") 10 Simple Linear Regression (Chs 12.1, 12.2, 12.4, 12.5) Simple Linear Regression Rating 20 40 60 80 0 5 10 15 Sugar 2 Simple Linear Regression Rating 20 40 60 80 0 5 10 15 Sugar 3 Simple Linear Regression
10 Simple Linear Regression (Chs 12.1, 12.2, 12.4, 12.5) Simple Linear Regression Rating 20 40 60 80 0 5 10 15 Sugar 2 Simple Linear Regression Rating 20 40 60 80 0 5 10 15 Sugar 3 Simple Linear Regression
Applied Econometrics (QEM)
") Applied Econometrics (QEM) The Simple Linear Regression Model based on Prinicples of Econometrics Jakub Mućk Department of Quantitative Economics Jakub Mućk Applied Econometrics (QEM) Meeting #2 The Simple
Applied Econometrics (QEM) The Simple Linear Regression Model based on Prinicples of Econometrics Jakub Mućk Department of Quantitative Economics Jakub Mućk Applied Econometrics (QEM) Meeting #2 The Simple
Measuring the fit of the model - SSR
 Measuring the fit of the model - SSR Once we ve determined our estimated regression line, we d like to know how well the model fits. How far/close are the observations to the fitted line? One way to do
The regression model with one fixed regressor cont d
 The regression model with one fixed regressor cont d 3150/4150 Lecture 4 Ragnar Nymoen 27 January 2012 The model with transformed variables Regression with transformed variables I References HGL Ch 2.8
3 Multiple Linear Regression
 3 Multiple Linear Regression 3.1 The Model Essentially, all models are wrong, but some are useful. Quote by George E.P. Box. Models are supposed to be exact descriptions of the population, but that is
Chapter 1: Linear Regression with One Predictor Variable also known as: Simple Linear Regression Bivariate Linear Regression
 BSTT523: Kutner et al., Chapter 1 1 Chapter 1: Linear Regression with One Predictor Variable also known as: Simple Linear Regression Bivariate Linear Regression Introduction: Functional relation between
Business Statistics. Tommaso Proietti. Linear Regression. DEF - Università di Roma 'Tor Vergata'
 Business Statistics Tommaso Proietti DEF - Università di Roma 'Tor Vergata' Linear Regression Specication Let Y be a univariate quantitative response variable. We model Y as follows: Y = f(x) + ε where
Fitting a regression model
 Fitting a regression model We wish to fit a simple linear regression model: y = β 0 + β 1 x + ɛ. Fitting a model means obtaining estimators for the unknown population parameters β 0 and β 1 (and also for
MAT2377. Rafa l Kulik. Version 2015/November/26. Rafa l Kulik
 MAT2377 Rafa l Kulik Version 2015/November/26 Rafa l Kulik Bivariate data and scatterplot Data: Hydrocarbon level (x) and Oxygen level (y): x: 0.99, 1.02, 1.15, 1.29, 1.46, 1.36, 0.87, 1.23, 1.55, 1.40,
Lecture 6: Linear Regression
 Lecture 6: Linear Regression Reading: Sections 3.1-3 STATS 202: Data mining and analysis Jonathan Taylor, 10/5 Slide credits: Sergio Bacallado 1 / 30 Simple linear regression Model: y i = β 0 + β 1 x i
Hypothesis testing Goodness of fit Multicollinearity Prediction. Applied Statistics. Lecturer: Serena Arima
 Applied Statistics Lecturer: Serena Arima Hypothesis testing for the linear model Under the Gauss-Markov assumptions and the normality of the error terms, we saw that β N(β, σ 2 (X X ) 1 ) and hence s
Simple Linear Regression
 Simple Linear Regression In simple linear regression we are concerned about the relationship between two variables, X and Y. There are two components to such a relationship. 1. The strength of the relationship.
Linear Regression. In this problem sheet, we consider the problem of linear regression with p predictors and one intercept,
 Linear Regression In this problem sheet, we consider the problem of linear regression with p predictors and one intercept, y = Xβ + ɛ, where y t = (y 1,..., y n ) is the column vector of target values,
Applied Regression Analysis
 Applied Regression Analysis Lecture 2 January 27, 2005 Lecture #2-1/27/2005 Slide 1 of 46 Today s Lecture Simple linear regression. Partitioning the sum of squares. Tests of significance.. Regression diagnostics
Lecture 8 CORRELATION AND LINEAR REGRESSION
 Announcements CBA5 open in exam mode - deadline midnight Friday! Question 2 on this week s exercises is a prize question. The first good attempt handed in to me by 12 midday this Friday will merit a prize...
Linear regression. Linear regression is a simple approach to supervised learning. It assumes that the dependence of Y on X 1,X 2,...X p is linear.
 Linear regression Linear regression is a simple approach to supervised learning. It assumes that the dependence of Y on X 1,X 2,...X p is linear. 1/48 Linear regression Linear regression is a simple approach
Machine Learning Linear Regression. Prof. Matteo Matteucci
 Machine Learning Linear Regression Prof. Matteo Matteucci Outline 2 o Simple Linear Regression Model Least Squares Fit Measures of Fit Inference in Regression o Multi Variate Regession Model Least Squares
TMA4255 Applied Statistics V2016 (5)
") TMA4255 Applied Statistics V2016 (5) Part 2: Regression Simple linear regression [11.1-11.4] Sum of squares [11.5] Anna Marie Holand To be lectured: January 26, 2016 wiki.math.ntnu.no/tma4255/2016v/start
TMA4255 Applied Statistics V2016 (5) Part 2: Regression Simple linear regression [11.1-11.4] Sum of squares [11.5] Anna Marie Holand To be lectured: January 26, 2016 wiki.math.ntnu.no/tma4255/2016v/start
Data Analysis and Statistical Methods Statistics 651
 y 1 2 3 4 5 6 7 x Data Analysis and Statistical Methods Statistics 651 http://www.stat.tamu.edu/~suhasini/teaching.html Lecture 32 Suhasini Subba Rao Previous lecture We are interested in whether a dependent
Lecture 2. Simple linear regression
 Lecture 2. Simple linear regression Jesper Rydén Department of Mathematics, Uppsala University jesper@math.uu.se Regression and Analysis of Variance autumn 2014 Overview of lecture Introduction, short
Applied Econometrics (QEM)
") Applied Econometrics (QEM) based on Prinicples of Econometrics Jakub Mućk Department of Quantitative Economics Jakub Mućk Applied Econometrics (QEM) Meeting #3 1 / 42 Outline 1 2 3 t-test P-value Linear
Applied Econometrics (QEM) based on Prinicples of Econometrics Jakub Mućk Department of Quantitative Economics Jakub Mućk Applied Econometrics (QEM) Meeting #3 1 / 42 Outline 1 2 3 t-test P-value Linear
MS&E 226: Small Data. Lecture 11: Maximum likelihood (v2) Ramesh Johari
 Ramesh Johari") MS&E 226: Small Data Lecture 11: Maximum likelihood (v2) Ramesh Johari ramesh.johari@stanford.edu 1 / 18 The likelihood function 2 / 18 Estimating the parameter This lecture develops the methodology behind
MS&E 226: Small Data Lecture 11: Maximum likelihood (v2) Ramesh Johari ramesh.johari@stanford.edu 1 / 18 The likelihood function 2 / 18 Estimating the parameter This lecture develops the methodology behind
Regression Analysis Chapter 2 Simple Linear Regression
 Regression Analysis Chapter 2 Simple Linear Regression Dr. Bisher Mamoun Iqelan biqelan@iugaza.edu.ps Department of Mathematics The Islamic University of Gaza 2010-2011, Semester 2 Dr. Bisher M. Iqelan
Chapter 2 The Simple Linear Regression Model: Specification and Estimation
 Chapter The Simple Linear Regression Model: Specification and Estimation Page 1 Chapter Contents.1 An Economic Model. An Econometric Model.3 Estimating the Regression Parameters.4 Assessing the Least Squares
STAT 4385 Topic 03: Simple Linear Regression
 STAT 4385 Topic 03: Simple Linear Regression Xiaogang Su, Ph.D. Department of Mathematical Science University of Texas at El Paso xsu@utep.edu Spring, 2017 Outline The Set-Up Exploratory Data Analysis
Regression Analysis. Regression: Methodology for studying the relationship among two or more variables
 Regression Analysis Regression: Methodology for studying the relationship among two or more variables Two major aims: Determine an appropriate model for the relationship between the variables Predict the
Multivariate Regression
 Multivariate Regression The so-called supervised learning problem is the following: we want to approximate the random variable Y with an appropriate function of the random variables X 1,..., X p with the
Inferences for Regression
 Inferences for Regression An Example: Body Fat and Waist Size Looking at the relationship between % body fat and waist size (in inches). Here is a scatterplot of our data set: Remembering Regression In
Inference in Regression Analysis
 Inference in Regression Analysis Dr. Frank Wood Frank Wood, fwood@stat.columbia.edu Linear Regression Models Lecture 4, Slide 1 Today: Normal Error Regression Model Y i = β 0 + β 1 X i + ǫ i Y i value
Chapter 4: Regression Models
 Sales volume of company 1 Textbook: pp. 129-164 Chapter 4: Regression Models Money spent on advertising 2 Learning Objectives After completing this chapter, students will be able to: Identify variables,
9. Least squares data fitting
 L. Vandenberghe EE133A (Spring 2017) 9. Least squares data fitting model fitting regression linear-in-parameters models time series examples validation least squares classification statistics interpretation
This model of the conditional expectation is linear in the parameters. A more practical and relaxed attitude towards linear regression is to say that
 Linear Regression For (X, Y ) a pair of random variables with values in R p R we assume that E(Y X) = β 0 + with β R p+1. p X j β j = (1, X T )β j=1 This model of the conditional expectation is linear
Quantitative Analysis of Financial Markets. Summary of Part II. Key Concepts & Formulas. Christopher Ting. November 11, 2017
 Summary of Part II Key Concepts & Formulas Christopher Ting November 11, 2017 christopherting@smu.edu.sg http://www.mysmu.edu/faculty/christophert/ Christopher Ting 1 of 16 Why Regression Analysis? Understand
BNAD 276 Lecture 10 Simple Linear Regression Model
 1 / 27 BNAD 276 Lecture 10 Simple Linear Regression Model Phuong Ho May 30, 2017 2 / 27 Outline 1 Introduction 2 3 / 27 Outline 1 Introduction 2 4 / 27 Simple Linear Regression Model Managerial decisions
Regression Analysis: Basic Concepts
 The simple linear model Regression Analysis: Basic Concepts Allin Cottrell Represents the dependent variable, y i, as a linear function of one independent variable, x i, subject to a random disturbance
EECS E6690: Statistical Learning for Biological and Information Systems Lecture1: Introduction
 EECS E6690: Statistical Learning for Biological and Information Systems Lecture1: Introduction Prof. Predrag R. Jelenković Time: Tuesday 4:10-6:40pm 1127 Seeley W. Mudd Building Dept. of Electrical Engineering
Multiple Linear Regression
 Multiple Linear Regression Simple linear regression tries to fit a simple line between two variables Y and X. If X is linearly related to Y this explains some of the variability in Y. In most cases, there
Applied Statistics. J. Blanchet and J. Wadsworth. Institute of Mathematics, Analysis, and Applications EPF Lausanne
 Applied Statistics J. Blanchet and J. Wadsworth Institute of Mathematics, Analysis, and Applications EPF Lausanne An MSc Course for Applied Mathematicians, Fall 2012 Outline 1 Motivation: Why Applied Statistics?
The Multiple Regression Model
 Multiple Regression The Multiple Regression Model Idea: Examine the linear relationship between 1 dependent (Y) & or more independent variables (X i ) Multiple Regression Model with k Independent Variables:
STAT 511. Lecture : Simple linear regression Devore: Section Prof. Michael Levine. December 3, Levine STAT 511
 STAT 511 Lecture : Simple linear regression Devore: Section 12.1-12.4 Prof. Michael Levine December 3, 2018 A simple linear regression investigates the relationship between the two variables that is not
AP Statistics. Chapter 9 Re-Expressing data: Get it Straight
 AP Statistics Chapter 9 Re-Expressing data: Get it Straight Objectives: Re-expression of data Ladder of powers Straight to the Point We cannot use a linear model unless the relationship between the two
Linear Regression In God we trust, all others bring data. William Edwards Deming
 Linear Regression ddebarr@uw.edu 2017-01-19 In God we trust, all others bring data. William Edwards Deming Course Outline 1. Introduction to Statistical Learning 2. Linear Regression 3. Classification
Linear Models in Machine Learning
 CS540 Intro to AI Linear Models in Machine Learning Lecturer: Xiaojin Zhu jerryzhu@cs.wisc.edu We briefly go over two linear models frequently used in machine learning: linear regression for, well, regression,
Statistical View of Least Squares
 May 23, 2006 Purpose of Regression Some Examples Least Squares Purpose of Regression Purpose of Regression Some Examples Least Squares Suppose we have two variables x and y Purpose of Regression Some Examples
Basic Business Statistics 6 th Edition
 Basic Business Statistics 6 th Edition Chapter 12 Simple Linear Regression Learning Objectives In this chapter, you learn: How to use regression analysis to predict the value of a dependent variable based
Two-Variable Regression Model: The Problem of Estimation
 Two-Variable Regression Model: The Problem of Estimation Introducing the Ordinary Least Squares Estimator Jamie Monogan University of Georgia Intermediate Political Methodology Jamie Monogan (UGA) Two-Variable
Statistical View of Least Squares
 Basic Ideas Some Examples Least Squares May 22, 2007 Basic Ideas Simple Linear Regression Basic Ideas Some Examples Least Squares Suppose we have two variables x and y Basic Ideas Simple Linear Regression
Scatter plot of data from the study. Linear Regression
 1 2 Linear Regression Scatter plot of data from the study. Consider a study to relate birthweight to the estriol level of pregnant women. The data is below. i Weight (g / 100) i Weight (g / 100) 1 7 25
Ch 3: Multiple Linear Regression
 Ch 3: Multiple Linear Regression 1. Multiple Linear Regression Model Multiple regression model has more than one regressor. For example, we have one response variable and two regressor variables: 1. delivery
Lectures on Simple Linear Regression Stat 431, Summer 2012
 Lectures on Simple Linear Regression Stat 43, Summer 0 Hyunseung Kang July 6-8, 0 Last Updated: July 8, 0 :59PM Introduction Previously, we have been investigating various properties of the population
Linear Regression Model. Badr Missaoui
 Linear Regression Model Badr Missaoui Introduction What is this course about? It is a course on applied statistics. It comprises 2 hours lectures each week and 1 hour lab sessions/tutorials. We will focus
EMERGING MARKETS - Lecture 2: Methodology refresher
 EMERGING MARKETS - Lecture 2: Methodology refresher Maria Perrotta April 4, 2013 SITE http://www.hhs.se/site/pages/default.aspx My contact: maria.perrotta@hhs.se Aim of this class There are many different
Statistical Methods for Data Mining
 Statistical Methods for Data Mining Kuangnan Fang Xiamen University Email: xmufkn@xmu.edu.cn Linear regression Linear regression is a simple approach to supervised learning. It assumes that the dependence
9. Linear Regression and Correlation
 9. Linear Regression and Correlation Data: y a quantitative response variable x a quantitative explanatory variable (Chap. 8: Recall that both variables were categorical) For example, y = annual income,
Lecture 2 Linear Regression: A Model for the Mean. Sharyn O Halloran
 Lecture 2 Linear Regression: A Model for the Mean Sharyn O Halloran Closer Look at: Linear Regression Model Least squares procedure Inferential tools Confidence and Prediction Intervals Assumptions Robustness
The regression model with one stochastic regressor.
 The regression model with one stochastic regressor. 3150/4150 Lecture 6 Ragnar Nymoen 30 January 2012 We are now on Lecture topic 4 The main goal in this lecture is to extend the results of the regression
Simple Linear Regression: The Model
 Simple Linear Regression: The Model task: quantifying the effect of change X in X on Y, with some constant β 1 : Y = β 1 X, linear relationship between X and Y, however, relationship subject to a random
Statistical Inference with Regression Analysis
 Introductory Applied Econometrics EEP/IAS 118 Spring 2015 Steven Buck Lecture #13 Statistical Inference with Regression Analysis Next we turn to calculating confidence intervals and hypothesis testing
Chapter 14 Student Lecture Notes Department of Quantitative Methods & Information Systems. Business Statistics. Chapter 14 Multiple Regression
 Chapter 14 Student Lecture Notes 14-1 Department of Quantitative Methods & Information Systems Business Statistics Chapter 14 Multiple Regression QMIS 0 Dr. Mohammad Zainal Chapter Goals After completing
Lecture 2 Simple Linear Regression STAT 512 Spring 2011 Background Reading KNNL: Chapter 1
 Lecture Simple Linear Regression STAT 51 Spring 011 Background Reading KNNL: Chapter 1-1 Topic Overview This topic we will cover: Regression Terminology Simple Linear Regression with a single predictor
Categorical Predictor Variables
 Categorical Predictor Variables We often wish to use categorical (or qualitative) variables as covariates in a regression model. For binary variables (taking on only 2 values, e.g. sex), it is relatively
Problems. Suppose both models are fitted to the same data. Show that SS Res, A SS Res, B
 Simple Linear Regression 35 Problems 1 Consider a set of data (x i, y i ), i =1, 2,,n, and the following two regression models: y i = β 0 + β 1 x i + ε, (i =1, 2,,n), Model A y i = γ 0 + γ 1 x i + γ 2
Scatter plot of data from the study. Linear Regression
 1 2 Linear Regression Scatter plot of data from the study. Consider a study to relate birthweight to the estriol level of pregnant women. The data is below. i Weight (g / 100) i Weight (g / 100) 1 7 25
The cover page of the Encyclopedia of Health Economics (2014) Introduction to Econometric Application in Health Economics
 Introduction to Econometric Application in Health Economics") PHPM110062 Teaching Demo The cover page of the Encyclopedia of Health Economics (2014) Introduction to Econometric Application in Health Economics Instructor: Mengcen Qian School of Public Health What
PHPM110062 Teaching Demo The cover page of the Encyclopedia of Health Economics (2014) Introduction to Econometric Application in Health Economics Instructor: Mengcen Qian School of Public Health What
Making sense of Econometrics: Basics
 Making sense of Econometrics: Basics Lecture 2: Simple Regression Egypt Scholars Economic Society Happy Eid Eid present! enter classroom at http://b.socrative.com/login/student/ room name c28efb78 Outline
LECTURE 15: SIMPLE LINEAR REGRESSION I
 David Youngberg BSAD 20 Montgomery College LECTURE 5: SIMPLE LINEAR REGRESSION I I. From Correlation to Regression a. Recall last class when we discussed two basic types of correlation (positive and negative).
Y i = η + ɛ i, i = 1,...,n.
 Nonparametric tests If data do not come from a normal population (and if the sample is not large), we cannot use a t-test. One useful approach to creating test statistics is through the use of rank statistics.
Econometrics I Lecture 3: The Simple Linear Regression Model
 Econometrics I Lecture 3: The Simple Linear Regression Model Mohammad Vesal Graduate School of Management and Economics Sharif University of Technology 44716 Fall 1397 1 / 32 Outline Introduction Estimating
4 Multiple Linear Regression
 4 Multiple Linear Regression 4. The Model Definition 4.. random variable Y fits a Multiple Linear Regression Model, iff there exist β, β,..., β k R so that for all (x, x 2,..., x k ) R k where ε N (, σ
Review of Econometrics
 Review of Econometrics Zheng Tian June 5th, 2017 1 The Essence of the OLS Estimation Multiple regression model involves the models as follows Y i = β 0 + β 1 X 1i + β 2 X 2i + + β k X ki + u i, i = 1,...,
Linear Regression. September 27, Chapter 3. Chapter 3 September 27, / 77
 Linear Regression Chapter 3 September 27, 2016 Chapter 3 September 27, 2016 1 / 77 1 3.1. Simple linear regression 2 3.2 Multiple linear regression 3 3.3. The least squares estimation 4 3.4. The statistical
Quantitative Methods I: Regression diagnostics
 Quantitative Methods I: Regression University College Dublin 10 December 2014 1 Assumptions and errors 2 3 4 Outline Assumptions and errors 1 Assumptions and errors 2 3 4 Assumptions: specification Linear
Lecture 6: Linear Regression (continued)
") Lecture 6: Linear Regression (continued) Reading: Sections 3.1-3.3 STATS 202: Data mining and analysis October 6, 2017 1 / 23 Multiple linear regression Y = β 0 + β 1 X 1 + + β p X p + ε Y ε N (0, σ) i.i.d.
Lecture 6: Linear Regression (continued) Reading: Sections 3.1-3.3 STATS 202: Data mining and analysis October 6, 2017 1 / 23 Multiple linear regression Y = β 0 + β 1 X 1 + + β p X p + ε Y ε N (0, σ) i.i.d.