9. Linear Regression and Correlation
|
|
|
- Garey Bennett
- 5 years ago
- Views:
Transcription
1 9. Linear Regression and Correlation Data: y a quantitative response variable x a quantitative explanatory variable (Chap. 8: Recall that both variables were categorical) For example, y = annual income, x = number of years of education y = college GPA, x = high school GPA (or perhaps SAT) We consider: Is there an association? (test of independence) How strong is the association? (uses correlation) How can we describe the nature of the relationship, e.g., by using x to predict y? (regression equation, residuals)
2 Linear Relationships Linear Function (Straight-Line Relation): y = α + β x expresses y as linear function of x with slope β and y- intercept α. For each 1-unit increase in x, y increases β units β > 0 Line slopes upward (positive relationship) β = 0 Horizontal line (y does not depend on x) β < 0 Line slopes downward (negative relation)
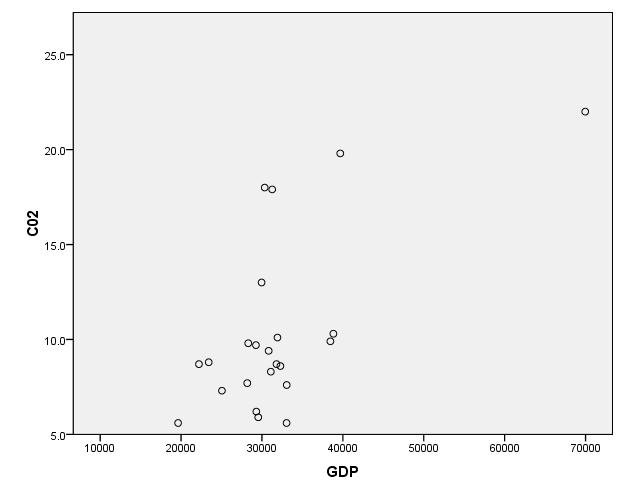
3 Example: Economic Level and CO2 Emissions OECD (Organization for Economic Development, Advanced industrialized nations committed to democracy and the market economy. oecd-data file (from 2004) on p. 62 of text and at text website Let y = carbon dioxide emissions (per capita, in metric tons) Ranges from 5.6 in Portugal to 22.0 in Luxembourg mean = 10.4, standard deviation = 4.6 x = gross domestic product (GDP, in thousands of dollars per capita) Ranges from 19.6 in Portugal to 70.0 in Luxembourg mean = 32.1, standard deviation = 9.6
4 The relationship between x and y can be approximated by y = x. At x = 0, predicted CO2 level y = x = (0) = 0.42 (irrelevant, because no GDP values near 0) At x = 39.7 (value for U.S.), predicted CO2 level y = (39.7) = 12.7 (actual = 19.8 for U.S.) For each increase of 1 thousand dollars in per capita GDP, CO2 use predicted to increase by 0.31 metric tons per capita But, this linear equation is just an approximation. The correlation between x and y for these nations was 0.64, not 1.0 (It is even less, 0.41, if we take out the outlier observation for Luxembourg.) Likewise, we would not expect to be able to predict annual income perfectly using years of education or to predict college GPA perfectly using high school GPA.
5
6 Effect of variable coding? Slope and intercept depend on units of measurement. If x = GDP measured in dollars (instead of thousands of dollars), then y = x because a change of $1 has only 1/1000 the impact of a change of $1000 (so, the slope is multiplied by 0.001). If y = CO2 output in kilograms instead of metric tons (1 metric ton = 1000 kilograms), with x in dollars, then y = 1000( x) = x Suppose x changes from U.S. dollars to British pounds and 1 pound = 2 dollars. What happens?
7 Probabilistic Models In practice, the relationship between y and x is not perfect because y is not completely determined by x. Other sources of variation exist. We let α + β x represent the mean of y-values, as a function of x. We replace equation y = α + β x by E(y) = α + β x (for population) (Recall E(y) is the expected value of y, which is the mean of its probability distribution.) e.g., if y = income, x = no. years of education, we regard E(y) = α + β(12) as the mean income for everyone in population having 12 years education.
8 A regression function is a mathematical function that describes how the mean of the response variable y changes according to the value of an explanatory variable x. A linear regression function is part of a model (a simple representation of reality) for summarizing a relationship. A linear model is OK if the true relationship is approximately linear, not OK if highly nonlinear. In practice, we use data to check whether a particular model is plausible (e.g., by looking at a scatterplot) and to estimate model parameters.
9 Estimating the linear equation A scatterplot is a plot of the n values of (x, y) for the n subjects in the sample Looking at the scatterplot is first step of analysis, to check whether linear model seems plausible Example: Are externalizing behaviors in adolescents (e.g., acting out in negative ways, such as causing fights) associated with feelings of anxiety? (Nolan et al., J. Personality and Social Psych., 2003)
10 Data (some) Subject Externalizing (x) Anxiety (y) As exercise, conduct analyses with x, y reversed
 mean 29.4 6.6 std. dev. 7.0 2.7")
11 Variables Anxiety (y) Externalizing (x) mean std. dev
12 How to choose the line that best fits the data? Criterion: Choose line that minimizes sum of squared vertical distances from observed data points to line. This is called the least squares prediction equation. Solution (using calculus): Denote estimate of α by a, estimate of β by b, estimate of E(y) and the prediction for y by. Then, yˆ = a+ bx with ( xi x )( y i y ) b = and a = y bx 2 ( x x ) i ŷ
13 Example: What causes b > 0 or b < 0? Subject Externalizing (x) Anxiety (y) Numerator of b is Σ( x x)( y y) i i The contribution of subjects 1 and 2 to b is (9-6.6)( ) + (7-6.6)( ) positive negative
14 Motivation for formulas: If observation has both x and y values above means, or both values below means, then (x - x)(y - y ) is positive. Slope estimate b > 0 when most observations like this. a = y bx means that y = a + bx i.e., predicted value of y at mean of x is mean of y. The prediction equation passes through the point with coordinates ( x, y ).

15 Results for anxiety/externalizing data set Least squares estimates are a = and b = That is, yˆ = x
16 Interpretations 1-unit increase in x corresponds to predicted increase of 1.67 in anxiety score. y-intercept of 18.4 is predicted anxiety score for subject having x = 0. The value b = 1.67 > 0 corresponds to a positive sample association between the variables. but, sample size is small, with lots of variability, and it is not clear there would be a positive association for a corresponding population.
17 Residuals (prediction errors) For an observation, difference between observed value of y and predicted value ŷ of y, is called a residual (vertical distance on scatterplot) y yˆ Example: Subject 1 has x = 9, y = 37. Predicted anxiety value is (9) = y yˆ Residual = = = 3.6 Residual positive when y > predicted value Residual negative when y < predicted value The sum (and mean) of the residuals = 0.
18 Prediction equation has least squares property Residual sum of squares (i.e., sum of squared errors): SSE = ( y y ) =Σ[ y ( a + bx )] ˆ 2 2 i i i i The least squares estimates a and b provide the prediction equation with minimum value of SSE For yˆ = x software tells us SSE = Any other equation, such as yˆ = x has a larger value for SSE.
19 The Linear Regression Model Recall the linear regression model is E(y) = α + β x (probabilistic rather than deterministic). This says that the mean of the conditional distribution of y at each fixed value of x follows a straight line. The model has another parameter σ that describes the variability of the conditional distributions; that is, the variability of y values for all subjects having the same x-value. The estimate of the conditional standard deviation of y is s SSE ( y ˆ i yi) = = n 2 n 2 2
20 Example: We have SSE = based on n = 10. s 2 SSE ( y ˆ i yi) = = = = = 5.6 n 2 n 2 8 At any fixed level of x (externalizing behaviors), the estimated standard deviation of anxiety values is 5.6 (Called Std. Error of the Estimate in SPSS printout, a very poor label)
21 df = n 2 is degrees of freedom for the estimate s of σ. (n 2 because we estimated 2 parameters to get predictions) The ratio SSE/(n-2) is called the mean square error and often denoted by MSE. The total sum of squares about the sample mean of y decomposes into the sum of the residual (error) sum of squares and the regression sum of squares Σ( y y) 2 =Σ( y yˆ ) 2 +Σ( yˆ y) 2 i i i i TSS = SSE + Regression SS We ll see that regression is more effective in predicting y using x when SSE is relatively small, regression SS is relatively large.
22 Software shows sums of squares in an ANOVA (analysis of variance) table
23 Example: (text, p. 267, study in undergraduate research journal by student at Indiana Univ. of South Bend) Sample of 50 college students in an introductory psychology course reported y = high school GPA and x = weekly number of hours watching TV The study reported yˆ = x Software reports: Sum of Squares df Mean Square Regression Residual Total
24 The estimate of the conditional std dev is 2 SSE ( y yˆ ) s = = = = n 2 n i.e., predict GPA s vary around x with a standard deviation of 0.49 e.g., at x = 10 hours of TV watching, conditional dist of GPA is estimated to have mean of (10) = 3.14 and a standard deviation of Note: Conditional std. dev. s differs from marginal std. dev. of y, which we studied in Chap. 3 and is based on variability about and ignores x in describing variability of y y
25 Example: y = GPA, x = TV watching We found s = 0.49 for estimated conditional standard deviation of GPA Estimated marginal standard deviation of GPA is s y 2 Σ( yi y) = = = n Normally cond. std. dev. s < marginal std. dev. s y How can they be dramatically different? (picture)
26 Measuring association: The correlation Slope of regression equation describes the direction of association between x and y, but The magnitude of the slope depends on the units of the variables The correlation is a standardized slope that does not depend on units Correlation r relates to slope b of prediction equation by r = b(s x /s y ) where s x and s y are sample standard deviations of x and y.
27 Properties of the correlation r is standardized slope in sense that r reflects what b equals if s x = s y -1 r +1, with r having same sign as b r = 1 or -1 when all sample points fall exactly on prediction line, and r describes strength of linear association r = 0 when b = 0 (can happen when assoc., but not linear) The larger the absolute value, the stronger the assoc.
28
29 Examples For y = anxiety and x = externalizing behavior, = x, and s x = 2.7, s y = 7.0. ŷ The correlation equals r = b(s x /s y ) = 1.67(2.7/7.0) = (moderate positive association) For y = high school GPA and x = TV watching, we ll see that r = (moderate negative association) Beware: Prediction equation and r can be sensitive to outliers (Recall OECD data and effect of Luxembourg observation)
30 Correlation implies that predictions regress toward the mean When x goes up 1, predicted y changes by b When x goes up s x, the predicted y changes by s x b= rs y A 1 standard deviation increase in x corresponds to predicted change of r standard deviations in y. y is predicted to be closer to its mean than x is to its mean; i.e., there is regression toward the mean (Francis Galton 1885) Example: x = parent height, y = child height
31 Be careful not to be fooled by effects that merely represent regression toward the mean. Examples: Exercise 9.50 on effect of special tutoring for students who do poorly on midterm exam Exercise 9.51 how the lightest readers tend to read more at a later time, the heaviest readers tend to read less at a later time.
32 r 2 = proportional reduction in error When we use x in the prediction equation to predict y, a summary measure of prediction error is sum of squared errors When we predict y without using x, best predictor is sample mean of y, and summary measure of prediction error is total sum of squares SSE =Σ( y yˆ ) TSS =Σ( y y) Predictions using x get better as SSE decreases relative to TSS 2 2
33 The proportional reduction in error in using x to predict y (via the prediction equation) instead of using sample mean of y to predict y is r 2 TSS SSE Σ( y y) Σ( y yˆ ) = = 2 TSS Σ( y y) 2 2 i.e., the proportional reduction in error is the square of the correlation! This measure is sometimes called the coefficient of determination, but more commonly just r-squared
34 Example: high school GPA and TV watching Sum of Squares df Mean Square Regression Residual Total So, r 2 = ( )/15.29 = 3.63/15.29 = There is a 23.7% reduction in error when we use x = TV watching to predict y = high school GPA. 23.7% of the variation in high school GPA is explained by TV watching. The correlation r is the negative square root of (because b < 0), which is r =
35 Properties of r 2 Since -1 r +1, 0 r 2 1 Minimum possible SSE = 0, in which case r 2 = 1 and all sample points fall exactly on prediction line If b = 0, then a = y bx = y so ŷ = a+ bx= y and so TSS = SSE and r 2 = 0. r 2 does not depend on units, or distinction between x, y
36 Inference about slope (β) and correlation (ρ) Assumptions: The study used randomization in gathering data The linear regression equation E(y) = α + βx holds The standard deviation σ of the conditional distribution is the same at each x-value. The conditional distribution of y is normal at each value of x (least important, especially for two-sided inference with relatively large n)
37 Test of independence of x and y Parameter: Population slope in regression model (β) Estimator: Least squares estimate b Estimated standard error: decreases (as usual) as n increases H 0 : independence is H 0 : β = 0 (under assumptions above) H a can be two-sided H a : β 0 or one-sided, H a : β > 0 or H a : β < 0 s se = = ( x x) sx Test statistic t = (b 0)/se, with df = n 2 s n 2 1
. For H a : β > 0, P-value = right-tail probability above t = 2.")
38 Example: Anxiety/externalizing behavior revisited From SPSS output below, t = 1.666/0.692 = 2.41, df = n 2 = 10-2 = 8, two-sided P-value = (Interpret) Considerable evidence against H 0 : β = 0. It appears there is positive association in population between externalizing behaviors and feelings of anxiety (a CI will show this). For H a : β > 0, P-value = right-tail probability above t = 2.41, which is 0.043/2 = (Note: Standardized coeff. in a bivariate analysis is the correlation, not beta!)
39 Confidence interval for slope β A CI for β has form b ± t(se) where t-score has df = n-2 and is from t-table with half the error probability in each tail. (Same se as in test) Example: b = 1.666, se = With df = 8, for 95% CI, t-score = t = % CI for β is ± 2.306(0.692), or (0.07, 3.26). We conclude that association in population is positive, with slope in this range (wide CI because n so small) (Recall y = anxiety has mean = 29, std. dev. = 7 x = externalizing behavior has mean = 6.6, std. dev. = 2.7)
40 What is effect of 3-unit increase in x = externalizing behavior? (nearly a standard deviation increase in x) Estimate is now 3b, which has 3(se), and we have 3b ± 3t(se), which is 3(0.07, 3.26) = (0.2, 9.8). Conclusion of two-sided test about H 0 : β = 0 is consistent with conclusion of corresponding CI, with error prob. α that is the significance level of test. Example: Two-sided P-value = 0.04, so reject H 0 : β = 0 at 0.05 level and conclude there is an association. Likewise, 95% CI for β does not contain 0 as a plausible value for β.
41 What if reverse roles of variables? (Now, y = externalizing behavior, x = anxiety Prediction equation changes ( x) Correlation stays same (r = 0.648) Result of t test is same (t = 2.41, P = two-sided) (How about bivariate analyses of categorical var s? What changes and what stays the same?)
42 Some comments Equivalent test of independence uses H 0 : ρ = 0, where ρ is popul. correlation that sample correlation r estimates (Useful when no distinction between response, explanatory variables) Test statistic t = r 2 1 r n 2 Example: r = 0.648, n = 10, so t = 0.648/0.269 = 2.41, df = 8. P-value = for H a : ρ 0. (This formula useful for showing that t increases, P-value decreases, as r and/or n increase, and that t does not depend on response/explanatory distinction) CI for ρ more complex because r has a highly skewed sampling distribution when ρ gets closer to 1.0 (text, exercise 9.64)
43 Linear regression is a model: We don t truly expect exactly a linear relation with constant variability, but it is often a good and simple approximation in practice. Extrapolation beyond observed range of x-values dangerous. For y = high school GPA and x = weekly hours watching TV, yˆ = x. If observe x between 0 and 30, say, does not make sense to plug in x = 100 and get predicted GPA = Observations are very influential if they take extreme values (small or large) of x and fall far from the linear trend the rest of the data follow. These can unduly affect least squares results.
44 Example of effect of outlier For data on y = anxiety and x = externalizing behavior, subject 5 had x = 11, y = 42. Suppose data for that subject had been incorrectly entered in data file as x = 110 and y = 420. ŷ Instead of = x, we get ŷ = x Instead of r = 0.64, get r = Suppose x entered OK but y entered as 420. Then ŷ = x, and r = 0.58.
45 Correlation biased downward if only narrow range of x-values sampled. (see picture for why this happens) Thus, r mainly useful when both X and Y randomly sampled. Example (p. 286): How strong is association between x = SAT exam score and y = college GPA at end of second year of college? We ll find a very weak correlation if we sample only Harvard students, because of the very narrow range of x- values. An alternative way of expressing the regression model E(y) = α + βx is y = α + βx + ε, where ε is a population residual (error term) that varies around 0 (see p. 287 of text)
46 Software reports SS values, test results in an ANOVA (analysis of variance) table The F statistic in the ANOVA table is the square of the t statistic for testing H 0 : β = 0, and it has the same P- value as for the two-sided t test. This is a more general statistic needed when a hypothesis contains more than one regression parameter (Chapter 11).
47 Some review questions for Chapter 9 1. What do we mean by a regression model? 2. What is a residual, and how do residuals relate to summarizing regression prediction errors, least squares, r- squared, residuals for a contingency table? 3. What is the effect of units of measurement on least squares prediction equation, correlation, inferences such as t test about slope? What s effect of interchanging x and y? 4. In what sense is the correlation a standardized slope? How can you interpret it in this way, and how can you interpret it in terms of the effect of a standard deviation change in x?
48 5. What is meant by regression toward the mean and what are some of its implications? (What would have to happen for there to be no regression toward the mean?) 6. When is the correlation misleading as a summary measure of association for quantitative variables? Why? 7. What is meant by a conditional distribution (quantitative, categorical cases)? What is a conditional standard deviation and when is it much less than a marginal standard deviation? 8. How do you do a test of independence for (a) two quantitative variables? (b) two categorical variables? (c) a quantitative and a categorical variable (that is binary)? 9. If for a given data set, predictor x 1 has a stronger correlation with y than does x 2 then how do their SSE values compare? How do their TSS values compare?
y response variable x 1, x 2,, x k -- a set of explanatory variables
 11. Multiple Regression and Correlation y response variable x 1, x 2,, x k -- a set of explanatory variables In this chapter, all variables are assumed to be quantitative. Chapters 12-14 show how to incorporate
Review of Statistics 101
 Review of Statistics 101 We review some important themes from the course 1. Introduction Statistics- Set of methods for collecting/analyzing data (the art and science of learning from data). Provides methods
Unit 6 - Introduction to linear regression
 Unit 6 - Introduction to linear regression Suggested reading: OpenIntro Statistics, Chapter 7 Suggested exercises: Part 1 - Relationship between two numerical variables: 7.7, 7.9, 7.11, 7.13, 7.15, 7.25,
Inferences for Regression
 Inferences for Regression An Example: Body Fat and Waist Size Looking at the relationship between % body fat and waist size (in inches). Here is a scatterplot of our data set: Remembering Regression In
Unit 6 - Simple linear regression
 Sta 101: Data Analysis and Statistical Inference Dr. Çetinkaya-Rundel Unit 6 - Simple linear regression LO 1. Define the explanatory variable as the independent variable (predictor), and the response variable
(quantitative or categorical variables) Numerical descriptions of center, variability, position (quantitative variables)
 Numerical descriptions of center, variability, position (quantitative variables)") 3. Descriptive Statistics Describing data with tables and graphs (quantitative or categorical variables) Numerical descriptions of center, variability, position (quantitative variables) Bivariate descriptions
3. Descriptive Statistics Describing data with tables and graphs (quantitative or categorical variables) Numerical descriptions of center, variability, position (quantitative variables) Bivariate descriptions
(Where does Ch. 7 on comparing 2 means or 2 proportions fit into this?)
") 12. Comparing Groups: Analysis of Variance (ANOVA) Methods Response y Explanatory x var s Method Categorical Categorical Contingency tables (Ch. 8) (chi-squared, etc.) Quantitative Quantitative Regression
12. Comparing Groups: Analysis of Variance (ANOVA) Methods Response y Explanatory x var s Method Categorical Categorical Contingency tables (Ch. 8) (chi-squared, etc.) Quantitative Quantitative Regression
Correlation Analysis
 Simple Regression Correlation Analysis Correlation analysis is used to measure strength of the association (linear relationship) between two variables Correlation is only concerned with strength of the
Can you tell the relationship between students SAT scores and their college grades?
 Correlation One Challenge Can you tell the relationship between students SAT scores and their college grades? A: The higher SAT scores are, the better GPA may be. B: The higher SAT scores are, the lower
Chapter 10. Regression. Understandable Statistics Ninth Edition By Brase and Brase Prepared by Yixun Shi Bloomsburg University of Pennsylvania
 Chapter 10 Regression Understandable Statistics Ninth Edition By Brase and Brase Prepared by Yixun Shi Bloomsburg University of Pennsylvania Scatter Diagrams A graph in which pairs of points, (x, y), are
The Simple Linear Regression Model
 The Simple Linear Regression Model Lesson 3 Ryan Safner 1 1 Department of Economics Hood College ECON 480 - Econometrics Fall 2017 Ryan Safner (Hood College) ECON 480 - Lesson 3 Fall 2017 1 / 77 Bivariate
Estimating σ 2. We can do simple prediction of Y and estimation of the mean of Y at any value of X.
 Estimating σ 2 We can do simple prediction of Y and estimation of the mean of Y at any value of X. To perform inferences about our regression line, we must estimate σ 2, the variance of the error term.
Mathematics for Economics MA course
 Mathematics for Economics MA course Simple Linear Regression Dr. Seetha Bandara Simple Regression Simple linear regression is a statistical method that allows us to summarize and study relationships between
STAT Chapter 11: Regression
 STAT 515 -- Chapter 11: Regression Mostly we have studied the behavior of a single random variable. Often, however, we gather data on two random variables. We wish to determine: Is there a relationship
Inference for the Regression Coefficient
 Inference for the Regression Coefficient Recall, b 0 and b 1 are the estimates of the slope β 1 and intercept β 0 of population regression line. We can shows that b 0 and b 1 are the unbiased estimates
Chapter 9. Correlation and Regression
 Chapter 9 Correlation and Regression Lesson 9-1/9-2, Part 1 Correlation Registered Florida Pleasure Crafts and Watercraft Related Manatee Deaths 100 80 60 40 20 0 1991 1993 1995 1997 1999 Year Boats in
: The model hypothesizes a relationship between the variables. The simplest probabilistic model: or.
 Chapter Simple Linear Regression : comparing means across groups : presenting relationships among numeric variables. Probabilistic Model : The model hypothesizes an relationship between the variables.
Chapter 16. Simple Linear Regression and dcorrelation
 Chapter 16 Simple Linear Regression and dcorrelation 16.1 Regression Analysis Our problem objective is to analyze the relationship between interval variables; regression analysis is the first tool we will
Section 3: Simple Linear Regression
 Section 3: Simple Linear Regression Carlos M. Carvalho The University of Texas at Austin McCombs School of Business http://faculty.mccombs.utexas.edu/carlos.carvalho/teaching/ 1 Regression: General Introduction
INFERENCE FOR REGRESSION
 CHAPTER 3 INFERENCE FOR REGRESSION OVERVIEW In Chapter 5 of the textbook, we first encountered regression. The assumptions that describe the regression model we use in this chapter are the following. We
Final Exam - Solutions
 Ecn 102 - Analysis of Economic Data University of California - Davis March 19, 2010 Instructor: John Parman Final Exam - Solutions You have until 5:30pm to complete this exam. Please remember to put your
REVIEW 8/2/2017 陈芳华东师大英语系
 REVIEW Hypothesis testing starts with a null hypothesis and a null distribution. We compare what we have to the null distribution, if the result is too extreme to belong to the null distribution (p
Inference for Regression Simple Linear Regression
 Inference for Regression Simple Linear Regression IPS Chapter 10.1 2009 W.H. Freeman and Company Objectives (IPS Chapter 10.1) Simple linear regression p Statistical model for linear regression p Estimating
Draft Proof - Do not copy, post, or distribute. Chapter Learning Objectives REGRESSION AND CORRELATION THE SCATTER DIAGRAM
 1 REGRESSION AND CORRELATION As we learned in Chapter 9 ( Bivariate Tables ), the differential access to the Internet is real and persistent. Celeste Campos-Castillo s (015) research confirmed the impact
Simple Linear Regression
 9-1 l Chapter 9 l Simple Linear Regression 9.1 Simple Linear Regression 9.2 Scatter Diagram 9.3 Graphical Method for Determining Regression 9.4 Least Square Method 9.5 Correlation Coefficient and Coefficient
Homework 2: Simple Linear Regression
 STAT 4385 Applied Regression Analysis Homework : Simple Linear Regression (Simple Linear Regression) Thirty (n = 30) College graduates who have recently entered the job market. For each student, the CGPA
appstats27.notebook April 06, 2017
 Chapter 27 Objective Students will conduct inference on regression and analyze data to write a conclusion. Inferences for Regression An Example: Body Fat and Waist Size pg 634 Our chapter example revolves
9 Correlation and Regression
 9 Correlation and Regression SW, Chapter 12. Suppose we select n = 10 persons from the population of college seniors who plan to take the MCAT exam. Each takes the test, is coached, and then retakes the
Sociology 593 Exam 2 Answer Key March 28, 2002
 Sociology 59 Exam Answer Key March 8, 00 I. True-False. (0 points) Indicate whether the following statements are true or false. If false, briefly explain why.. A variable is called CATHOLIC. This probably
Correlation and Linear Regression
 Correlation and Linear Regression Correlation: Relationships between Variables So far, nearly all of our discussion of inferential statistics has focused on testing for differences between group means
Chapter 27 Summary Inferences for Regression
 Chapter 7 Summary Inferences for Regression What have we learned? We have now applied inference to regression models. Like in all inference situations, there are conditions that we must check. We can test
Correlation. A statistics method to measure the relationship between two variables. Three characteristics
 Correlation Correlation A statistics method to measure the relationship between two variables Three characteristics Direction of the relationship Form of the relationship Strength/Consistency Direction
Lecture 10 Multiple Linear Regression
 Lecture 10 Multiple Linear Regression STAT 512 Spring 2011 Background Reading KNNL: 6.1-6.5 10-1 Topic Overview Multiple Linear Regression Model 10-2 Data for Multiple Regression Y i is the response variable
Interactions. Interactions. Lectures 1 & 2. Linear Relationships. y = a + bx. Slope. Intercept
 Interactions Lectures 1 & Regression Sometimes two variables appear related: > smoking and lung cancers > height and weight > years of education and income > engine size and gas mileage > GMAT scores and
Inference for Regression Inference about the Regression Model and Using the Regression Line
 Inference for Regression Inference about the Regression Model and Using the Regression Line PBS Chapter 10.1 and 10.2 2009 W.H. Freeman and Company Objectives (PBS Chapter 10.1 and 10.2) Inference about
Business Statistics. Lecture 9: Simple Regression
 Business Statistics Lecture 9: Simple Regression 1 On to Model Building! Up to now, class was about descriptive and inferential statistics Numerical and graphical summaries of data Confidence intervals
Multiple Regression. Inference for Multiple Regression and A Case Study. IPS Chapters 11.1 and W.H. Freeman and Company
 Multiple Regression Inference for Multiple Regression and A Case Study IPS Chapters 11.1 and 11.2 2009 W.H. Freeman and Company Objectives (IPS Chapters 11.1 and 11.2) Multiple regression Data for multiple
Objectives Simple linear regression. Statistical model for linear regression. Estimating the regression parameters
 Objectives 10.1 Simple linear regression Statistical model for linear regression Estimating the regression parameters Confidence interval for regression parameters Significance test for the slope Confidence
Inference for Regression Inference about the Regression Model and Using the Regression Line, with Details. Section 10.1, 2, 3
 Inference for Regression Inference about the Regression Model and Using the Regression Line, with Details Section 10.1, 2, 3 Basic components of regression setup Target of inference: linear dependency
Applied Regression Modeling: A Business Approach Chapter 3: Multiple Linear Regression Sections
 Applied Regression Modeling: A Business Approach Chapter 3: Multiple Linear Regression Sections 3.1 3.3.2 by Iain Pardoe 3.1 Probability model for (X 1, X 2,...) and Y 2 Multiple linear regression................................................
Chapter 10-Regression
 Chapter 10-Regression 10.1 Regression equation predicting infant mortality from income Y = Infant mortality X = Income Y = 6.70 s Y = 0.698 s 2 Y = 0.487 X = 46.00 s X = 6.289 s 2 X = 39.553 cov XY = 2.7245
Regression Models - Introduction
 Regression Models - Introduction In regression models there are two types of variables that are studied: A dependent variable, Y, also called response variable. It is modeled as random. An independent
Announcements: You can turn in homework until 6pm, slot on wall across from 2202 Bren. Make sure you use the correct slot! (Stats 8, closest to wall)
") Announcements: You can turn in homework until 6pm, slot on wall across from 2202 Bren. Make sure you use the correct slot! (Stats 8, closest to wall) We will cover Chs. 5 and 6 first, then 3 and 4. Mon,
Announcements: You can turn in homework until 6pm, slot on wall across from 2202 Bren. Make sure you use the correct slot! (Stats 8, closest to wall) We will cover Chs. 5 and 6 first, then 3 and 4. Mon,
Data Analysis and Statistical Methods Statistics 651
 y 1 2 3 4 5 6 7 x Data Analysis and Statistical Methods Statistics 651 http://www.stat.tamu.edu/~suhasini/teaching.html Lecture 32 Suhasini Subba Rao Previous lecture We are interested in whether a dependent
Business Statistics. Lecture 10: Course Review
 Business Statistics Lecture 10: Course Review 1 Descriptive Statistics for Continuous Data Numerical Summaries Location: mean, median Spread or variability: variance, standard deviation, range, percentiles,
Chapter 2: Looking at Data Relationships (Part 3)
") Chapter 2: Looking at Data Relationships (Part 3) Dr. Nahid Sultana Chapter 2: Looking at Data Relationships 2.1: Scatterplots 2.2: Correlation 2.3: Least-Squares Regression 2.5: Data Analysis for Two-Way
Chapter 2: Looking at Data Relationships (Part 3) Dr. Nahid Sultana Chapter 2: Looking at Data Relationships 2.1: Scatterplots 2.2: Correlation 2.3: Least-Squares Regression 2.5: Data Analysis for Two-Way
Regression and correlation. Correlation & Regression, I. Regression & correlation. Regression vs. correlation. Involve bivariate, paired data, X & Y
 Regression and correlation Correlation & Regression, I 9.07 4/1/004 Involve bivariate, paired data, X & Y Height & weight measured for the same individual IQ & exam scores for each individual Height of
CHAPTER EIGHT Linear Regression
 7 CHAPTER EIGHT Linear Regression 8. Scatter Diagram Example 8. A chemical engineer is investigating the effect of process operating temperature ( x ) on product yield ( y ). The study results in the following
Sociology 593 Exam 2 March 28, 2002
 Sociology 59 Exam March 8, 00 I. True-False. (0 points) Indicate whether the following statements are true or false. If false, briefly explain why.. A variable is called CATHOLIC. This probably means that
Inferences for Correlation
 Inferences for Correlation Quantitative Methods II Plan for Today Recall: correlation coefficient Bivariate normal distributions Hypotheses testing for population correlation Confidence intervals for population
Linear Regression and Correlation. February 11, 2009
 Linear Regression and Correlation February 11, 2009 The Big Ideas To understand a set of data, start with a graph or graphs. The Big Ideas To understand a set of data, start with a graph or graphs. If
Applied Regression Modeling: A Business Approach Chapter 2: Simple Linear Regression Sections
 Applied Regression Modeling: A Business Approach Chapter 2: Simple Linear Regression Sections 2.1 2.3 by Iain Pardoe 2.1 Probability model for and 2 Simple linear regression model for and....................................
Regression: Main Ideas Setting: Quantitative outcome with a quantitative explanatory variable. Example, cont.
 TCELL 9/4/205 36-309/749 Experimental Design for Behavioral and Social Sciences Simple Regression Example Male black wheatear birds carry stones to the nest as a form of sexual display. Soler et al. wanted
Correlation & Simple Regression
 Chapter 11 Correlation & Simple Regression The previous chapter dealt with inference for two categorical variables. In this chapter, we would like to examine the relationship between two quantitative variables.
Midterm 2 - Solutions
 Ecn 102 - Analysis of Economic Data University of California - Davis February 23, 2010 Instructor: John Parman Midterm 2 - Solutions You have until 10:20am to complete this exam. Please remember to put
Simple Linear Regression Using Ordinary Least Squares
 Simple Linear Regression Using Ordinary Least Squares Purpose: To approximate a linear relationship with a line. Reason: We want to be able to predict Y using X. Definition: The Least Squares Regression
Chapter 14 Simple Linear Regression (A)
") Chapter 14 Simple Linear Regression (A) 1. Characteristics Managerial decisions often are based on the relationship between two or more variables. can be used to develop an equation showing how the variables
Chapter 14 Simple Linear Regression (A) 1. Characteristics Managerial decisions often are based on the relationship between two or more variables. can be used to develop an equation showing how the variables
1 A Review of Correlation and Regression
 1 A Review of Correlation and Regression SW, Chapter 12 Suppose we select n = 10 persons from the population of college seniors who plan to take the MCAT exam. Each takes the test, is coached, and then
A discussion on multiple regression models
 A discussion on multiple regression models In our previous discussion of simple linear regression, we focused on a model in which one independent or explanatory variable X was used to predict the value
Analysing data: regression and correlation S6 and S7
 Basic medical statistics for clinical and experimental research Analysing data: regression and correlation S6 and S7 K. Jozwiak k.jozwiak@nki.nl 2 / 49 Correlation So far we have looked at the association
Answer Key. 9.1 Scatter Plots and Linear Correlation. Chapter 9 Regression and Correlation. CK-12 Advanced Probability and Statistics Concepts 1
 9.1 Scatter Plots and Linear Correlation Answers 1. A high school psychologist wants to conduct a survey to answer the question: Is there a relationship between a student s athletic ability and his/her
Important note: Transcripts are not substitutes for textbook assignments. 1
 In this lesson we will cover correlation and regression, two really common statistical analyses for quantitative (or continuous) data. Specially we will review how to organize the data, the importance
36-309/749 Experimental Design for Behavioral and Social Sciences. Sep. 22, 2015 Lecture 4: Linear Regression
 36-309/749 Experimental Design for Behavioral and Social Sciences Sep. 22, 2015 Lecture 4: Linear Regression TCELL Simple Regression Example Male black wheatear birds carry stones to the nest as a form
ECO220Y Simple Regression: Testing the Slope
 ECO220Y Simple Regression: Testing the Slope Readings: Chapter 18 (Sections 18.3-18.5) Winter 2012 Lecture 19 (Winter 2012) Simple Regression Lecture 19 1 / 32 Simple Regression Model y i = β 0 + β 1 x
AMS 7 Correlation and Regression Lecture 8
 AMS 7 Correlation and Regression Lecture 8 Department of Applied Mathematics and Statistics, University of California, Santa Cruz Suumer 2014 1 / 18 Correlation pairs of continuous observations. Correlation
Simple Linear Regression: One Quantitative IV
 Simple Linear Regression: One Quantitative IV Linear regression is frequently used to explain variation observed in a dependent variable (DV) with theoretically linked independent variables (IV). For example,
Review of Multiple Regression
 Ronald H. Heck 1 Let s begin with a little review of multiple regression this week. Linear models [e.g., correlation, t-tests, analysis of variance (ANOVA), multiple regression, path analysis, multivariate
SSR = The sum of squared errors measures how much Y varies around the regression line n. It happily turns out that SSR + SSE = SSTO.
 Analysis of variance approach to regression If x is useless, i.e. β 1 = 0, then E(Y i ) = β 0. In this case β 0 is estimated by Ȳ. The ith deviation about this grand mean can be written: deviation about
Simple Linear Regression
 Simple Linear Regression In simple linear regression we are concerned about the relationship between two variables, X and Y. There are two components to such a relationship. 1. The strength of the relationship.
Ch. 16: Correlation and Regression
 Ch. 1: Correlation and Regression With the shift to correlational analyses, we change the very nature of the question we are asking of our data. Heretofore, we were asking if a difference was likely to
Chapter 16. Simple Linear Regression and Correlation
 Chapter 16 Simple Linear Regression and Correlation 16.1 Regression Analysis Our problem objective is to analyze the relationship between interval variables; regression analysis is the first tool we will
CHAPTER 5 LINEAR REGRESSION AND CORRELATION
 CHAPTER 5 LINEAR REGRESSION AND CORRELATION Expected Outcomes Able to use simple and multiple linear regression analysis, and correlation. Able to conduct hypothesis testing for simple and multiple linear
Chapter 7 Linear Regression
 Chapter 7 Linear Regression 1 7.1 Least Squares: The Line of Best Fit 2 The Linear Model Fat and Protein at Burger King The correlation is 0.76. This indicates a strong linear fit, but what line? The line
Warm-up Using the given data Create a scatterplot Find the regression line
 Time at the lunch table Caloric intake 21.4 472 30.8 498 37.7 335 32.8 423 39.5 437 22.8 508 34.1 431 33.9 479 43.8 454 42.4 450 43.1 410 29.2 504 31.3 437 28.6 489 32.9 436 30.6 480 35.1 439 33.0 444
Scatterplots and Correlation
 Chapter 4 Scatterplots and Correlation 2/15/2019 Chapter 4 1 Explanatory Variable and Response Variable Correlation describes linear relationships between quantitative variables X is the quantitative explanatory
Business Statistics. Chapter 14 Introduction to Linear Regression and Correlation Analysis QMIS 220. Dr. Mohammad Zainal
 Department of Quantitative Methods & Information Systems Business Statistics Chapter 14 Introduction to Linear Regression and Correlation Analysis QMIS 220 Dr. Mohammad Zainal Chapter Goals After completing
Lecture 18: Simple Linear Regression
 Lecture 18: Simple Linear Regression BIOS 553 Department of Biostatistics University of Michigan Fall 2004 The Correlation Coefficient: r The correlation coefficient (r) is a number that measures the strength
Simple Linear Regression
 Simple Linear Regression EdPsych 580 C.J. Anderson Fall 2005 Simple Linear Regression p. 1/80 Outline 1. What it is and why it s useful 2. How 3. Statistical Inference 4. Examining assumptions (diagnostics)
Inference for Regression
 Inference for Regression Section 9.4 Cathy Poliak, Ph.D. cathy@math.uh.edu Office in Fleming 11c Department of Mathematics University of Houston Lecture 13b - 3339 Cathy Poliak, Ph.D. cathy@math.uh.edu
Lecture 2 Simple Linear Regression STAT 512 Spring 2011 Background Reading KNNL: Chapter 1
 Lecture Simple Linear Regression STAT 51 Spring 011 Background Reading KNNL: Chapter 1-1 Topic Overview This topic we will cover: Regression Terminology Simple Linear Regression with a single predictor
Ch 13 & 14 - Regression Analysis
 Ch 3 & 4 - Regression Analysis Simple Regression Model I. Multiple Choice:. A simple regression is a regression model that contains a. only one independent variable b. only one dependent variable c. more
df=degrees of freedom = n - 1
 One sample t-test test of the mean Assumptions: Independent, random samples Approximately normal distribution (from intro class: σ is unknown, need to calculate and use s (sample standard deviation)) Hypotheses:
Objectives. 2.3 Least-squares regression. Regression lines. Prediction and Extrapolation. Correlation and r 2. Transforming relationships
 Objectives 2.3 Least-squares regression Regression lines Prediction and Extrapolation Correlation and r 2 Transforming relationships Adapted from authors slides 2012 W.H. Freeman and Company Straight Line
Simple Linear Regression
 Simple Linear Regression ST 430/514 Recall: A regression model describes how a dependent variable (or response) Y is affected, on average, by one or more independent variables (or factors, or covariates)
STAT 4385 Topic 03: Simple Linear Regression
 STAT 4385 Topic 03: Simple Linear Regression Xiaogang Su, Ph.D. Department of Mathematical Science University of Texas at El Paso xsu@utep.edu Spring, 2017 Outline The Set-Up Exploratory Data Analysis
STAT 350 Final (new Material) Review Problems Key Spring 2016
 Review Problems Key Spring 2016") 1. The editor of a statistics textbook would like to plan for the next edition. A key variable is the number of pages that will be in the final version. Text files are prepared by the authors using LaTeX,
1. The editor of a statistics textbook would like to plan for the next edition. A key variable is the number of pages that will be in the final version. Text files are prepared by the authors using LaTeX,
11 Correlation and Regression
 Chapter 11 Correlation and Regression August 21, 2017 1 11 Correlation and Regression When comparing two variables, sometimes one variable (the explanatory variable) can be used to help predict the value
Multiple Regression. More Hypothesis Testing. More Hypothesis Testing The big question: What we really want to know: What we actually know: We know:
 Multiple Regression Ψ320 Ainsworth More Hypothesis Testing What we really want to know: Is the relationship in the population we have selected between X & Y strong enough that we can use the relationship
y = a + bx 12.1: Inference for Linear Regression Review: General Form of Linear Regression Equation Review: Interpreting Computer Regression Output
 12.1: Inference for Linear Regression Review: General Form of Linear Regression Equation y = a + bx y = dependent variable a = intercept b = slope x = independent variable Section 12.1 Inference for Linear
Simple Linear Regression: One Qualitative IV
 Simple Linear Regression: One Qualitative IV 1. Purpose As noted before regression is used both to explain and predict variation in DVs, and adding to the equation categorical variables extends regression
ECON3150/4150 Spring 2015
 ECON3150/4150 Spring 2015 Lecture 3&4 - The linear regression model Siv-Elisabeth Skjelbred University of Oslo January 29, 2015 1 / 67 Chapter 4 in S&W Section 17.1 in S&W (extended OLS assumptions) 2
Chapter 1: Linear Regression with One Predictor Variable also known as: Simple Linear Regression Bivariate Linear Regression
 BSTT523: Kutner et al., Chapter 1 1 Chapter 1: Linear Regression with One Predictor Variable also known as: Simple Linear Regression Bivariate Linear Regression Introduction: Functional relation between
Ch Inference for Linear Regression
 Ch. 12-1 Inference for Linear Regression ACT = 6.71 + 5.17(GPA) For every increase of 1 in GPA, we predict the ACT score to increase by 5.17. population regression line β (true slope) μ y = α + βx mean
Lecture 3: Inference in SLR
 Lecture 3: Inference in SLR STAT 51 Spring 011 Background Reading KNNL:.1.6 3-1 Topic Overview This topic will cover: Review of hypothesis testing Inference about 1 Inference about 0 Confidence Intervals
Final Exam - Solutions
 Ecn 102 - Analysis of Economic Data University of California - Davis March 17, 2010 Instructor: John Parman Final Exam - Solutions You have until 12:30pm to complete this exam. Please remember to put your
Chapter 4. Regression Models. Learning Objectives
 Chapter 4 Regression Models To accompany Quantitative Analysis for Management, Eleventh Edition, by Render, Stair, and Hanna Power Point slides created by Brian Peterson Learning Objectives After completing
Formal Statement of Simple Linear Regression Model
 Formal Statement of Simple Linear Regression Model Y i = β 0 + β 1 X i + ɛ i Y i value of the response variable in the i th trial β 0 and β 1 are parameters X i is a known constant, the value of the predictor
Chapter Goals. To understand the methods for displaying and describing relationship among variables. Formulate Theories.
 Chapter Goals To understand the methods for displaying and describing relationship among variables. Formulate Theories Interpret Results/Make Decisions Collect Data Summarize Results Chapter 7: Is There
Relationships Regression
 Relationships Regression BPS chapter 5 2006 W.H. Freeman and Company Objectives (BPS chapter 5) Regression Regression lines The least-squares regression line Using technology Facts about least-squares
The simple linear regression model discussed in Chapter 13 was written as
 1519T_c14 03/27/2006 07:28 AM Page 614 Chapter Jose Luis Pelaez Inc/Blend Images/Getty Images, Inc./Getty Images, Inc. 14 Multiple Regression 14.1 Multiple Regression Analysis 14.2 Assumptions of the Multiple