Multiple Regression. Inference for Multiple Regression and A Case Study. IPS Chapters 11.1 and W.H. Freeman and Company
|
|
|
- Dora Dulcie Hunt
- 6 years ago
- Views:
Transcription
1 Multiple Regression Inference for Multiple Regression and A Case Study IPS Chapters 11.1 and W.H. Freeman and Company
2 Objectives (IPS Chapters 11.1 and 11.2) Multiple regression Data for multiple regression Multiple linear regression model Estimation of the parameters Confidence interval for β j Significance test for β j ANOVA table for multiple regression Squared multiple correlation R 2
3 Data for multiple regression Up to this point we have considered, in detail, the linear regression model in one explanatory variable x. ŷ = b 0 + b 1 x Usually more complex linear models are needed in practical situations. There are many problems in which a knowledge of more than one explanatory variable is necessary in order to obtain a better understanding and better prediction of a particular response. In general, we have data on n cases and p explanatory variables.
4 Multiple linear regression model For p number of explanatory variables, we can express the population mean response (μ y ) as a linear equation: μ y = β 0 + β 1 x 1 + β p x p The statistical model for n sample data (i = 1, 2, n) is then: Data = fit + residual y i = (β 0 + β 1 x 1i + β p x pi ) + (ε i ) Where the ε i are independent and normally distributed N(0, σ). Multiple linear regression assumes equal variance σ 2 of y. The parameters of the model are β 0, β 1 β p.
5 Estimation of the parameters We selected a random sample of n individuals for which p + 1 variables were measured (x 1, x p, y). The least-squares regression method minimizes the sum of squared deviations e i (= y i ŷ i ) to express y as a linear function of the p explanatory variables: ŷ i = b 0 + b 1 x 1i + b k x pi As with simple linear regression, the constant b 0 is the y intercept. The regression coefficients (b 1 b p ) reflect the unique association of each independent variable with the y variable. They are analogous to the slope in simple regression. ŷ μ y b 0 are unbiased estimates of population parameters β 0 b p β p
6 Confidence interval for β j Estimating the regression parameters β 0, β j β p is a case of onesample inference with unknown population variance. We rely on the t distribution, with n p 1 degrees of freedom. A level C confidence interval for β j is: b j ± t* SE b j -SE b j is the standard error of b j we rely on software to obtain SE b j. - t* is the t critical for the t (n 2) distribution with area C between t* and +t*.
 distribution to find the p-value of the test.")
7 Significance test for β j To test the hypothesis H 0 : β j = 0 versus a 1 or 2 sided alternative. We calculate the t statistic t = b j /SE b j which has the t (n p 1) distribution to find the p-value of the test. Note: Software typically provides two-sided p-values.
 distribution. The p-value is P(F > f ).")
8 ANOVA F-test for multiple regression For a multiple linear relationship the ANOVA tests the hypotheses H 0 : β 1 = β 2 = = β p = 0 versus H a : H 0 not true by computing the F statistic: F = MSM / MSE When H 0 is true, F follows the F(1, n p 1) distribution. The p-value is P(F > f ). A significant p-value doesn t mean that all p explanatory variables have a significant influence on y only that at least one does.
9 ANOVA table for multiple regression Source Sum of squares SS df Mean square MS F P-value ( ˆ y) Model 2 p SSM/DFM MSM/MSE Tail area above F y i Error n p 1 SSE/DFE ( y i yˆ i ) Total n 1 ( y) y i 2 2 SST = SSM + SSE DFT = DFM + DFE The standard deviation of the sampling distribution, s, for n sample data points is calculated from the residuals e i = y i ŷ i s 2 = 2 ei y = ( n p 1 n i p yˆ i 1 ) 2 = SSE DFE = MSE s is an unbiased estimate of the regression standard deviation σ.
10 Squared multiple correlation R 2 Just as with simple linear regression, R 2, the squared multiple correlation, is the proportion of the variation in the response variable y that is explained by the model. In the particular case of multiple linear regression, the model is all p explanatory variables taken together. R 2 = ( yˆ ( y i i y) y) 2 2 = SSModel SSTotal
 * SAT math score (SATM, x1, explanatory variable) * SAT verbal score (SATV, x2,")
11 We have data on 224 first-year computer science majors at a large university in a given year. The data for each student include: * Cumulative GPA after 2 semesters at the university (y, response variable) * SAT math score (SATM, x1, explanatory variable) * SAT verbal score (SATV, x2, explanatory variable) * Average high school grade in math (HSM, x3, explanatory variable) * Average high school grade in science (HSS, x4, explanatory variable) * Average high school grade in English (HSE, x5, explanatory variable) Here are the summary statistics for these data given by software SAS:
.")
12 The first step in multiple linear regression is to study all pair-wise relationships between the p + 1 variables. Here is the SAS output for all pair-wise correlation analyses (value of r and 2 sided p-value of H 0 : ρ = 0). Scatterplots for all 15 pair-wise relationships are also necessary to understand the data.
 HSM significant HSS, HSE")
13 For simplicity, let s first run a multiple linear regression using only the three high school grade averages: P-value very significant R 2 is fairly small (20%) HSM significant HSS, HSE not
 only about 20% of the variations in cumulative GPA can be explained by these high school scores.")
14 P-value very significant R 2 is fairly small (20%) The ANOVA for the multiple linear regression using only HSM, HSS, and HSE is very significant at least one of the regression coefficients is significantly different from zero. But R 2 is fairly small (0.205) only about 20% of the variations in cumulative GPA can be explained by these high school scores. (Remember, a small p-value does not imply a large effect.)

15 HSM significant HSS, HSE not The tests of hypotheses for each b within the multiple linear regression reach significance for HSM only. We found a significant correlation between HSS and GPA when analyzed by themselves, so why is b HSS not significant in the multiple regression equation? Well, HHS and HHM are also significantly correlated. When all three high school averages are used together in the multiple regression analysis, only HSM contributes significantly to our ability to predict GPA.
16 We now drop the least significant variable from the previous model: HSS. P-value very significant R 2 is small (20%) The conclusions are about the same. But notice that the actual regression coefficients have changed. predicted GPA= HSM+.045HSE+.034HSS predicted GPA= HSM+.061HSE HSM significant HSE not
 SATM significant SATV not The ANOVA test for β SATM and β SATV is very significant at least one is not zero. R 2 is really small (0.")
17 Let s run a multiple linear regression with the two SAT scores only. P-value very significant R 2 is very small (6%) SATM significant SATV not The ANOVA test for β SATM and β SATV is very significant at least one is not zero. R 2 is really small (0.06) only 6% of GPA variations are explained by these tests. When taken together, only SATM is a significant predictor of GPA (P ).
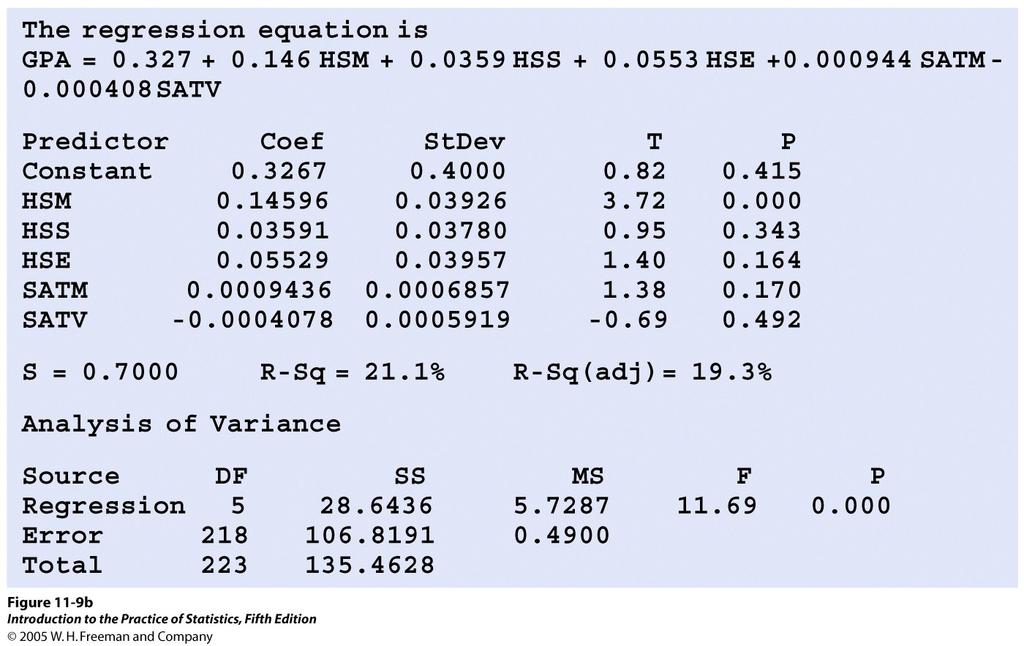
18 We finally run a multiple regression model with all the variables together P-value very significant R 2 fairly small (21%) HSM significant The overall test is significant, but only the average high school math score (HSM) makes a significant contribution in this model to predicting the cumulative GPA. This conclusion applies to computer majors at this large university.

19 Minitab Excel
Inference for Regression Simple Linear Regression
 Inference for Regression Simple Linear Regression IPS Chapter 10.1 2009 W.H. Freeman and Company Objectives (IPS Chapter 10.1) Simple linear regression p Statistical model for linear regression p Estimating
Inference for Regression Inference about the Regression Model and Using the Regression Line
 Inference for Regression Inference about the Regression Model and Using the Regression Line PBS Chapter 10.1 and 10.2 2009 W.H. Freeman and Company Objectives (PBS Chapter 10.1 and 10.2) Inference about
Statistiek II. John Nerbonne. March 17, Dept of Information Science incl. important reworkings by Harmut Fitz
 Dept of Information Science j.nerbonne@rug.nl incl. important reworkings by Harmut Fitz March 17, 2015 Review: regression compares result on two distinct tests, e.g., geographic and phonetic distance of
Inference for the Regression Coefficient
 Inference for the Regression Coefficient Recall, b 0 and b 1 are the estimates of the slope β 1 and intercept β 0 of population regression line. We can shows that b 0 and b 1 are the unbiased estimates
Confidence Interval for the mean response
 Week 3: Prediction and Confidence Intervals at specified x. Testing lack of fit with replicates at some x's. Inference for the correlation. Introduction to regression with several explanatory variables.
Multiple Linear Regression
 Multiple Linear Regression Simple linear regression tries to fit a simple line between two variables Y and X. If X is linearly related to Y this explains some of the variability in Y. In most cases, there
23. Inference for regression
 23. Inference for regression The Practice of Statistics in the Life Sciences Third Edition 2014 W. H. Freeman and Company Objectives (PSLS Chapter 23) Inference for regression The regression model Confidence
Lecture 11 Multiple Linear Regression
 Lecture 11 Multiple Linear Regression STAT 512 Spring 2011 Background Reading KNNL: 6.1-6.5 11-1 Topic Overview Review: Multiple Linear Regression (MLR) Computer Science Case Study 11-2 Multiple Regression
Inferences for Regression
 Inferences for Regression An Example: Body Fat and Waist Size Looking at the relationship between % body fat and waist size (in inches). Here is a scatterplot of our data set: Remembering Regression In
Lecture 18 MA Applied Statistics II D 2004
 Lecture 18 MA 2612 - Applied Statistics II D 2004 Today 1. Examples of multiple linear regression 2. The modeling process (PNC 8.4) 3. The graphical exploration of multivariable data (PNC 8.5) 4. Fitting
Chapter 6 Multiple Regression
 STAT 525 FALL 2018 Chapter 6 Multiple Regression Professor Min Zhang The Data and Model Still have single response variable Y Now have multiple explanatory variables Examples: Blood Pressure vs Age, Weight,
Chapter 14 Student Lecture Notes Department of Quantitative Methods & Information Systems. Business Statistics. Chapter 14 Multiple Regression
 Chapter 14 Student Lecture Notes 14-1 Department of Quantitative Methods & Information Systems Business Statistics Chapter 14 Multiple Regression QMIS 0 Dr. Mohammad Zainal Chapter Goals After completing
Correlation Analysis
 Simple Regression Correlation Analysis Correlation analysis is used to measure strength of the association (linear relationship) between two variables Correlation is only concerned with strength of the
Measuring the fit of the model - SSR
 Measuring the fit of the model - SSR Once we ve determined our estimated regression line, we d like to know how well the model fits. How far/close are the observations to the fitted line? One way to do
Lecture 13 Extra Sums of Squares
 Lecture 13 Extra Sums of Squares STAT 512 Spring 2011 Background Reading KNNL: 7.1-7.4 13-1 Topic Overview Extra Sums of Squares (Defined) Using and Interpreting R 2 and Partial-R 2 Getting ESS and Partial-R
Estimating σ 2. We can do simple prediction of Y and estimation of the mean of Y at any value of X.
 Estimating σ 2 We can do simple prediction of Y and estimation of the mean of Y at any value of X. To perform inferences about our regression line, we must estimate σ 2, the variance of the error term.
Intro to Linear Regression
 Intro to Linear Regression Introduction to Regression Regression is a statistical procedure for modeling the relationship among variables to predict the value of a dependent variable from one or more predictor
STOR 455 STATISTICAL METHODS I
 STOR 455 STATISTICAL METHODS I Jan Hannig Mul9variate Regression Y=X β + ε X is a regression matrix, β is a vector of parameters and ε are independent N(0,σ) Es9mated parameters b=(x X) - 1 X Y Predicted
Intro to Linear Regression
 Intro to Linear Regression Introduction to Regression Regression is a statistical procedure for modeling the relationship among variables to predict the value of a dependent variable from one or more predictor
Can you tell the relationship between students SAT scores and their college grades?
 Correlation One Challenge Can you tell the relationship between students SAT scores and their college grades? A: The higher SAT scores are, the better GPA may be. B: The higher SAT scores are, the lower
The Multiple Regression Model
 Multiple Regression The Multiple Regression Model Idea: Examine the linear relationship between 1 dependent (Y) & or more independent variables (X i ) Multiple Regression Model with k Independent Variables:
Lecture 10 Multiple Linear Regression
 Lecture 10 Multiple Linear Regression STAT 512 Spring 2011 Background Reading KNNL: 6.1-6.5 10-1 Topic Overview Multiple Linear Regression Model 10-2 Data for Multiple Regression Y i is the response variable
Econ 3790: Business and Economics Statistics. Instructor: Yogesh Uppal
 Econ 3790: Business and Economics Statistics Instructor: Yogesh Uppal yuppal@ysu.edu Sampling Distribution of b 1 Expected value of b 1 : Variance of b 1 : E(b 1 ) = 1 Var(b 1 ) = σ 2 /SS x Estimate of
Simple Linear Regression
 Simple Linear Regression In simple linear regression we are concerned about the relationship between two variables, X and Y. There are two components to such a relationship. 1. The strength of the relationship.
Ch 2: Simple Linear Regression
 Ch 2: Simple Linear Regression 1. Simple Linear Regression Model A simple regression model with a single regressor x is y = β 0 + β 1 x + ɛ, where we assume that the error ɛ is independent random component
Chapter 4. Regression Models. Learning Objectives
 Chapter 4 Regression Models To accompany Quantitative Analysis for Management, Eleventh Edition, by Render, Stair, and Hanna Power Point slides created by Brian Peterson Learning Objectives After completing
STA 108 Applied Linear Models: Regression Analysis Spring Solution for Homework #6
 STA 8 Applied Linear Models: Regression Analysis Spring 011 Solution for Homework #6 6. a) = 11 1 31 41 51 1 3 4 5 11 1 31 41 51 β = β1 β β 3 b) = 1 1 1 1 1 11 1 31 41 51 1 3 4 5 β = β 0 β1 β 6.15 a) Stem-and-leaf
1-Way ANOVA MATH 143. Spring Department of Mathematics and Statistics Calvin College
 1-Way ANOVA MATH 143 Department of Mathematics and Statistics Calvin College Spring 2010 The basic ANOVA situation Two variables: 1 Categorical, 1 Quantitative Main Question: Do the (means of) the quantitative
INFERENCE FOR REGRESSION
 CHAPTER 3 INFERENCE FOR REGRESSION OVERVIEW In Chapter 5 of the textbook, we first encountered regression. The assumptions that describe the regression model we use in this chapter are the following. We
Chapter 4: Regression Models
 Sales volume of company 1 Textbook: pp. 129-164 Chapter 4: Regression Models Money spent on advertising 2 Learning Objectives After completing this chapter, students will be able to: Identify variables,
11 Correlation and Regression
 Chapter 11 Correlation and Regression August 21, 2017 1 11 Correlation and Regression When comparing two variables, sometimes one variable (the explanatory variable) can be used to help predict the value
STAT 350 Final (new Material) Review Problems Key Spring 2016
 Review Problems Key Spring 2016") 1. The editor of a statistics textbook would like to plan for the next edition. A key variable is the number of pages that will be in the final version. Text files are prepared by the authors using LaTeX,
1. The editor of a statistics textbook would like to plan for the next edition. A key variable is the number of pages that will be in the final version. Text files are prepared by the authors using LaTeX,
Business Statistics. Chapter 14 Introduction to Linear Regression and Correlation Analysis QMIS 220. Dr. Mohammad Zainal
 Department of Quantitative Methods & Information Systems Business Statistics Chapter 14 Introduction to Linear Regression and Correlation Analysis QMIS 220 Dr. Mohammad Zainal Chapter Goals After completing
Basic Business Statistics, 10/e
 Chapter 4 4- Basic Business Statistics th Edition Chapter 4 Introduction to Multiple Regression Basic Business Statistics, e 9 Prentice-Hall, Inc. Chap 4- Learning Objectives In this chapter, you learn:
ANOVA: Analysis of Variation
 ANOVA: Analysis of Variation The basic ANOVA situation Two variables: 1 Categorical, 1 Quantitative Main Question: Do the (means of) the quantitative variables depend on which group (given by categorical
Inference for Regression Inference about the Regression Model and Using the Regression Line, with Details. Section 10.1, 2, 3
 Inference for Regression Inference about the Regression Model and Using the Regression Line, with Details Section 10.1, 2, 3 Basic components of regression setup Target of inference: linear dependency
Correlation and Linear Regression
 Correlation and Linear Regression Correlation: Relationships between Variables So far, nearly all of our discussion of inferential statistics has focused on testing for differences between group means
28. SIMPLE LINEAR REGRESSION III
 28. SIMPLE LINEAR REGRESSION III Fitted Values and Residuals To each observed x i, there corresponds a y-value on the fitted line, y = βˆ + βˆ x. The are called fitted values. ŷ i They are the values of
Lecture 12 Inference in MLR
 Lecture 12 Inference in MLR STAT 512 Spring 2011 Background Reading KNNL: 6.6-6.7 12-1 Topic Overview Review MLR Model Inference about Regression Parameters Estimation of Mean Response Prediction 12-2
Objectives Simple linear regression. Statistical model for linear regression. Estimating the regression parameters
 Objectives 10.1 Simple linear regression Statistical model for linear regression Estimating the regression parameters Confidence interval for regression parameters Significance test for the slope Confidence
Lecture 2 Simple Linear Regression STAT 512 Spring 2011 Background Reading KNNL: Chapter 1
 Lecture Simple Linear Regression STAT 51 Spring 011 Background Reading KNNL: Chapter 1-1 Topic Overview This topic we will cover: Regression Terminology Simple Linear Regression with a single predictor
Inference for Regression
 Inference for Regression Section 9.4 Cathy Poliak, Ph.D. cathy@math.uh.edu Office in Fleming 11c Department of Mathematics University of Houston Lecture 13b - 3339 Cathy Poliak, Ph.D. cathy@math.uh.edu
9. Linear Regression and Correlation
 9. Linear Regression and Correlation Data: y a quantitative response variable x a quantitative explanatory variable (Chap. 8: Recall that both variables were categorical) For example, y = annual income,
Multiple Regression. More Hypothesis Testing. More Hypothesis Testing The big question: What we really want to know: What we actually know: We know:
 Multiple Regression Ψ320 Ainsworth More Hypothesis Testing What we really want to know: Is the relationship in the population we have selected between X & Y strong enough that we can use the relationship
SIMPLE REGRESSION ANALYSIS. Business Statistics
 SIMPLE REGRESSION ANALYSIS Business Statistics CONTENTS Ordinary least squares (recap for some) Statistical formulation of the regression model Assessing the regression model Testing the regression coefficients
Mathematics for Economics MA course
 Mathematics for Economics MA course Simple Linear Regression Dr. Seetha Bandara Simple Regression Simple linear regression is a statistical method that allows us to summarize and study relationships between
STAT Chapter 11: Regression
 STAT 515 -- Chapter 11: Regression Mostly we have studied the behavior of a single random variable. Often, however, we gather data on two random variables. We wish to determine: Is there a relationship
Basic Business Statistics 6 th Edition
 Basic Business Statistics 6 th Edition Chapter 12 Simple Linear Regression Learning Objectives In this chapter, you learn: How to use regression analysis to predict the value of a dependent variable based
Chapter 14 Simple Linear Regression (A)
") Chapter 14 Simple Linear Regression (A) 1. Characteristics Managerial decisions often are based on the relationship between two or more variables. can be used to develop an equation showing how the variables
Chapter 14 Simple Linear Regression (A) 1. Characteristics Managerial decisions often are based on the relationship between two or more variables. can be used to develop an equation showing how the variables
Statistics for Managers using Microsoft Excel 6 th Edition
 Statistics for Managers using Microsoft Excel 6 th Edition Chapter 13 Simple Linear Regression 13-1 Learning Objectives In this chapter, you learn: How to use regression analysis to predict the value of
The simple linear regression model discussed in Chapter 13 was written as
 1519T_c14 03/27/2006 07:28 AM Page 614 Chapter Jose Luis Pelaez Inc/Blend Images/Getty Images, Inc./Getty Images, Inc. 14 Multiple Regression 14.1 Multiple Regression Analysis 14.2 Assumptions of the Multiple
Inference with Simple Regression
 1 Introduction Inference with Simple Regression Alan B. Gelder 06E:071, The University of Iowa 1 Moving to infinite means: In this course we have seen one-mean problems, twomean problems, and problems
Lecture 3: Inference in SLR
 Lecture 3: Inference in SLR STAT 51 Spring 011 Background Reading KNNL:.1.6 3-1 Topic Overview This topic will cover: Review of hypothesis testing Inference about 1 Inference about 0 Confidence Intervals
: The model hypothesizes a relationship between the variables. The simplest probabilistic model: or.
 Chapter Simple Linear Regression : comparing means across groups : presenting relationships among numeric variables. Probabilistic Model : The model hypothesizes an relationship between the variables.
Statistical Techniques II EXST7015 Simple Linear Regression
 Statistical Techniques II EXST7015 Simple Linear Regression 03a_SLR 1 Y - the dependent variable 35 30 25 The objective Given points plotted on two coordinates, Y and X, find the best line to fit the data.
Chapter 1: Linear Regression with One Predictor Variable also known as: Simple Linear Regression Bivariate Linear Regression
 BSTT523: Kutner et al., Chapter 1 1 Chapter 1: Linear Regression with One Predictor Variable also known as: Simple Linear Regression Bivariate Linear Regression Introduction: Functional relation between
This document contains 3 sets of practice problems.
 P RACTICE PROBLEMS This document contains 3 sets of practice problems. Correlation: 3 problems Regression: 4 problems ANOVA: 8 problems You should print a copy of these practice problems and bring them
Chapter 14 Student Lecture Notes 14-1
 Chapter 14 Student Lecture Notes 14-1 Business Statistics: A Decision-Making Approach 6 th Edition Chapter 14 Multiple Regression Analysis and Model Building Chap 14-1 Chapter Goals After completing this
Lecture 18: Simple Linear Regression
 Lecture 18: Simple Linear Regression BIOS 553 Department of Biostatistics University of Michigan Fall 2004 The Correlation Coefficient: r The correlation coefficient (r) is a number that measures the strength
AMS 315/576 Lecture Notes. Chapter 11. Simple Linear Regression
 AMS 315/576 Lecture Notes Chapter 11. Simple Linear Regression 11.1 Motivation A restaurant opening on a reservations-only basis would like to use the number of advance reservations x to predict the number
Example: Four levels of herbicide strength in an experiment on dry weight of treated plants.
 The idea of ANOVA Reminders: A factor is a variable that can take one of several levels used to differentiate one group from another. An experiment has a one-way, or completely randomized, design if several
df=degrees of freedom = n - 1
 One sample t-test test of the mean Assumptions: Independent, random samples Approximately normal distribution (from intro class: σ is unknown, need to calculate and use s (sample standard deviation)) Hypotheses:
Lecture 1 Linear Regression with One Predictor Variable.p2
 Lecture Linear Regression with One Predictor Variablep - Basics - Meaning of regression parameters p - β - the slope of the regression line -it indicates the change in mean of the probability distn of
Regression Analysis. Regression: Methodology for studying the relationship among two or more variables
 Regression Analysis Regression: Methodology for studying the relationship among two or more variables Two major aims: Determine an appropriate model for the relationship between the variables Predict the
Correlation. A statistics method to measure the relationship between two variables. Three characteristics
 Correlation Correlation A statistics method to measure the relationship between two variables Three characteristics Direction of the relationship Form of the relationship Strength/Consistency Direction
STAT 512 MidTerm I (2/21/2013) Spring 2013 INSTRUCTIONS
 Spring 2013 INSTRUCTIONS") STAT 512 MidTerm I (2/21/2013) Spring 2013 Name: Key INSTRUCTIONS 1. This exam is open book/open notes. All papers (but no electronic devices except for calculators) are allowed. 2. There are 5 pages in
STAT 512 MidTerm I (2/21/2013) Spring 2013 Name: Key INSTRUCTIONS 1. This exam is open book/open notes. All papers (but no electronic devices except for calculators) are allowed. 2. There are 5 pages in
Homework 2: Simple Linear Regression
 STAT 4385 Applied Regression Analysis Homework : Simple Linear Regression (Simple Linear Regression) Thirty (n = 30) College graduates who have recently entered the job market. For each student, the CGPA
Math Section MW 1-2:30pm SR 117. Bekki George 206 PGH
 Math 3339 Section 21155 MW 1-2:30pm SR 117 Bekki George bekki@math.uh.edu 206 PGH Office Hours: M 11-12:30pm & T,TH 10:00 11:00 am and by appointment Linear Regression (again) Consider the relationship
Math 3330: Solution to midterm Exam
 Math 3330: Solution to midterm Exam Question 1: (14 marks) Suppose the regression model is y i = β 0 + β 1 x i + ε i, i = 1,, n, where ε i are iid Normal distribution N(0, σ 2 ). a. (2 marks) Compute the
Chapter 10. Regression. Understandable Statistics Ninth Edition By Brase and Brase Prepared by Yixun Shi Bloomsburg University of Pennsylvania
 Chapter 10 Regression Understandable Statistics Ninth Edition By Brase and Brase Prepared by Yixun Shi Bloomsburg University of Pennsylvania Scatter Diagrams A graph in which pairs of points, (x, y), are
DESAIN EKSPERIMEN Analysis of Variances (ANOVA) Semester Genap 2017/2018 Jurusan Teknik Industri Universitas Brawijaya
 Semester Genap 2017/2018 Jurusan Teknik Industri Universitas Brawijaya") DESAIN EKSPERIMEN Analysis of Variances (ANOVA) Semester Jurusan Teknik Industri Universitas Brawijaya Outline Introduction The Analysis of Variance Models for the Data Post-ANOVA Comparison of Means Sample
DESAIN EKSPERIMEN Analysis of Variances (ANOVA) Semester Jurusan Teknik Industri Universitas Brawijaya Outline Introduction The Analysis of Variance Models for the Data Post-ANOVA Comparison of Means Sample
Unit 6 - Introduction to linear regression
 Unit 6 - Introduction to linear regression Suggested reading: OpenIntro Statistics, Chapter 7 Suggested exercises: Part 1 - Relationship between two numerical variables: 7.7, 7.9, 7.11, 7.13, 7.15, 7.25,
Chapte The McGraw-Hill Companies, Inc. All rights reserved.
 12er12 Chapte Bivariate i Regression (Part 1) Bivariate Regression Visual Displays Begin the analysis of bivariate data (i.e., two variables) with a scatter plot. A scatter plot - displays each observed
Six Sigma Black Belt Study Guides
 Six Sigma Black Belt Study Guides 1 www.pmtutor.org Powered by POeT Solvers Limited. Analyze Correlation and Regression Analysis 2 www.pmtutor.org Powered by POeT Solvers Limited. Variables and relationships
Regression Models - Introduction
 Regression Models - Introduction In regression models there are two types of variables that are studied: A dependent variable, Y, also called response variable. It is modeled as random. An independent
Confidence Intervals, Testing and ANOVA Summary
 Confidence Intervals, Testing and ANOVA Summary 1 One Sample Tests 1.1 One Sample z test: Mean (σ known) Let X 1,, X n a r.s. from N(µ, σ) or n > 30. Let The test statistic is H 0 : µ = µ 0. z = x µ 0
ST Correlation and Regression
 Chapter 5 ST 370 - Correlation and Regression Readings: Chapter 11.1-11.4, 11.7.2-11.8, Chapter 12.1-12.2 Recap: So far we ve learned: Why we want a random sample and how to achieve it (Sampling Scheme)
Formal Statement of Simple Linear Regression Model
 Formal Statement of Simple Linear Regression Model Y i = β 0 + β 1 X i + ɛ i Y i value of the response variable in the i th trial β 0 and β 1 are parameters X i is a known constant, the value of the predictor
Regression Models. Chapter 4. Introduction. Introduction. Introduction
 Chapter 4 Regression Models Quantitative Analysis for Management, Tenth Edition, by Render, Stair, and Hanna 008 Prentice-Hall, Inc. Introduction Regression analysis is a very valuable tool for a manager
Chapter Learning Objectives. Regression Analysis. Correlation. Simple Linear Regression. Chapter 12. Simple Linear Regression
 Chapter 12 12-1 North Seattle Community College BUS21 Business Statistics Chapter 12 Learning Objectives In this chapter, you learn:! How to use regression analysis to predict the value of a dependent
LECTURE 6. Introduction to Econometrics. Hypothesis testing & Goodness of fit
 LECTURE 6 Introduction to Econometrics Hypothesis testing & Goodness of fit October 25, 2016 1 / 23 ON TODAY S LECTURE We will explain how multiple hypotheses are tested in a regression model We will define
Ch 13 & 14 - Regression Analysis
 Ch 3 & 4 - Regression Analysis Simple Regression Model I. Multiple Choice:. A simple regression is a regression model that contains a. only one independent variable b. only one dependent variable c. more
Unit 6 - Simple linear regression
 Sta 101: Data Analysis and Statistical Inference Dr. Çetinkaya-Rundel Unit 6 - Simple linear regression LO 1. Define the explanatory variable as the independent variable (predictor), and the response variable
Simple Linear Regression
 9-1 l Chapter 9 l Simple Linear Regression 9.1 Simple Linear Regression 9.2 Scatter Diagram 9.3 Graphical Method for Determining Regression 9.4 Least Square Method 9.5 Correlation Coefficient and Coefficient
Lectures on Simple Linear Regression Stat 431, Summer 2012
 Lectures on Simple Linear Regression Stat 43, Summer 0 Hyunseung Kang July 6-8, 0 Last Updated: July 8, 0 :59PM Introduction Previously, we have been investigating various properties of the population
Ch Inference for Linear Regression
 Ch. 12-1 Inference for Linear Regression ACT = 6.71 + 5.17(GPA) For every increase of 1 in GPA, we predict the ACT score to increase by 5.17. population regression line β (true slope) μ y = α + βx mean
Lecture 15 Multiple regression I Chapter 6 Set 2 Least Square Estimation The quadratic form to be minimized is
 Lecture 15 Multiple regression I Chapter 6 Set 2 Least Square Estimation The quadratic form to be minimized is Q = (Y i β 0 β 1 X i1 β 2 X i2 β p 1 X i.p 1 ) 2, which in matrix notation is Q = (Y Xβ) (Y
LAB 5 INSTRUCTIONS LINEAR REGRESSION AND CORRELATION
 LAB 5 INSTRUCTIONS LINEAR REGRESSION AND CORRELATION In this lab you will learn how to use Excel to display the relationship between two quantitative variables, measure the strength and direction of the
Simple Linear Regression. (Chs 12.1, 12.2, 12.4, 12.5)
") 10 Simple Linear Regression (Chs 12.1, 12.2, 12.4, 12.5) Simple Linear Regression Rating 20 40 60 80 0 5 10 15 Sugar 2 Simple Linear Regression Rating 20 40 60 80 0 5 10 15 Sugar 3 Simple Linear Regression
10 Simple Linear Regression (Chs 12.1, 12.2, 12.4, 12.5) Simple Linear Regression Rating 20 40 60 80 0 5 10 15 Sugar 2 Simple Linear Regression Rating 20 40 60 80 0 5 10 15 Sugar 3 Simple Linear Regression
Correlation & Simple Regression
 Chapter 11 Correlation & Simple Regression The previous chapter dealt with inference for two categorical variables. In this chapter, we would like to examine the relationship between two quantitative variables.
Simple Linear Regression: One Qualitative IV
 Simple Linear Regression: One Qualitative IV 1. Purpose As noted before regression is used both to explain and predict variation in DVs, and adding to the equation categorical variables extends regression
Simple Linear Regression: A Model for the Mean. Chap 7
 Simple Linear Regression: A Model for the Mean Chap 7 An Intermediate Model (if the groups are defined by values of a numeric variable) Separate Means Model Means fall on a straight line function of the
y = a + bx 12.1: Inference for Linear Regression Review: General Form of Linear Regression Equation Review: Interpreting Computer Regression Output
 12.1: Inference for Linear Regression Review: General Form of Linear Regression Equation y = a + bx y = dependent variable a = intercept b = slope x = independent variable Section 12.1 Inference for Linear
Topic 16: Multicollinearity and Polynomial Regression
 Topic 16: Multicollinearity and Polynomial Regression Outline Multicollinearity Polynomial regression An example (KNNL p256) The P-value for ANOVA F-test is
Review of Statistics 101
 Review of Statistics 101 We review some important themes from the course 1. Introduction Statistics- Set of methods for collecting/analyzing data (the art and science of learning from data). Provides methods
Ch. 1: Data and Distributions
 Ch. 1: Data and Distributions Populations vs. Samples How to graphically display data Histograms, dot plots, stem plots, etc Helps to show how samples are distributed Distributions of both continuous and
Analysis of Variance. ภาว น ศ ร ประภาน ก ล คณะเศรษฐศาสตร มหาว ทยาล ยธรรมศาสตร
 Analysis of Variance ภาว น ศ ร ประภาน ก ล คณะเศรษฐศาสตร มหาว ทยาล ยธรรมศาสตร pawin@econ.tu.ac.th Outline Introduction One Factor Analysis of Variance Two Factor Analysis of Variance ANCOVA MANOVA Introduction
STA121: Applied Regression Analysis
 STA121: Applied Regression Analysis Linear Regression Analysis - Chapters 3 and 4 in Dielman Artin Department of Statistical Science September 15, 2009 Outline 1 Simple Linear Regression Analysis 2 Using
LINEAR REGRESSION ANALYSIS. MODULE XVI Lecture Exercises
 LINEAR REGRESSION ANALYSIS MODULE XVI Lecture - 44 Exercises Dr. Shalabh Department of Mathematics and Statistics Indian Institute of Technology Kanpur Exercise 1 The following data has been obtained on
Chapter 3 Multiple Regression Complete Example
 Department of Quantitative Methods & Information Systems ECON 504 Chapter 3 Multiple Regression Complete Example Spring 2013 Dr. Mohammad Zainal Review Goals After completing this lecture, you should be