Correlation and Linear Regression
|
|
|
- Chad Oliver
- 6 years ago
- Views:
Transcription

1 Correlation and Linear Regression
2 Correlation: Relationships between Variables So far, nearly all of our discussion of inferential statistics has focused on testing for differences between group means or proportions However, researchers are often interested in graded relationships between variables, such as how well one variable can predict another Examples: How well do SAT scores predict a student s GPA? How is the amount of time a student takes to complete an exam related to her grade on that exam? How well do IQ scores correlate with income? How does a child s height correlate with his running speed? How does class size affect student performance? 2
3 Height Weight
4 Characteristics of the Correlation Correlation and Regression A Correlation coefficient is a single number describing the relationship between two variables. This number describes: The direction of the relationship Variables sharing a positive correlation tend to change in the same direction (e.g., height and weight). As the value of one of the variables (height) increases, the value of other variable (weight) also increases Variables sharing a negative correlation tend to change in opposite directions (e.g., snowfall and beach visitors). As the value of one of the variables (amount of snowfall) increases, the value of the other variable (number of beach visitors) decreases. The strength of the relationship Variables that share a strong correlation (close to +1 or -1) strongly predict one another, while variables that share a weak correlation (near 0) do not. 4
5 Positive versus Negative Correlations Correlation and Regression Positive Correlation Negative Correlation 5
6 Strong versus Weak Correlations Correlation and Regression 6
7 Correlation is not Causation 7
8 Possible Sources of Correlation Correlation and Regression The relationship is causal. Manipulating the predictor variable causes an increase or decrease in the criterion variable. E.g., leg strength and sprinting speed The causal relationship is backwards (reverse causality). Manipulating the criterion variable causes changes in the predictor variable E.g., relationship between hospital visits and illness The two variables work together systematically to cause an effect The relationship may be due to one or more confounding variables Changes in both variables reflect the effect of a confounding variable E.g., intelligence as an explanation for correlated performance on different exams E.g., increasing density in cities increases the number of physicians and the number of crimes 8
9 Measuring Correlation: Pearson s r Correlation and Regression To compute a correlation you need a pair of scores, X and Y, for each individual in the sample. The most commonly used measure of correlation is Pearson s product-moment correlation coefficient, or more simply, Pearson s r. Conceptually, Pearson s r is a ratio between the degree to which two variables (X and Y) vary together and the degree to which they vary separately. r = co-variability( XY, ) variability( X) variability( Y) 9
10 The Covariance The term in the numerator of Pearson s r is the covariance, an unnormalized statistic representing the degree to which two variables (X and Y) vary together. ( )( ) cov XY = E X E[ X] Y EY [ ] = ( X E[ X] )( Y EY [ ]) n Mathematically, it is the average of the product of the deviations of two paired variables The covariance depends both on how consistently X and Y tend to vary together and on the individual variability of the variables (X and Y). 10
11 Computing Pearson s r Pearson s r is computed by dividing the covariance by the product of the standard deviations of each of the variables This removes the effect of the variability of the individual variables [ ( ) ( )] ρ = E z X zy = cov σ σ X XY Y ˆ ρ = r = cov s s X XY Y 11
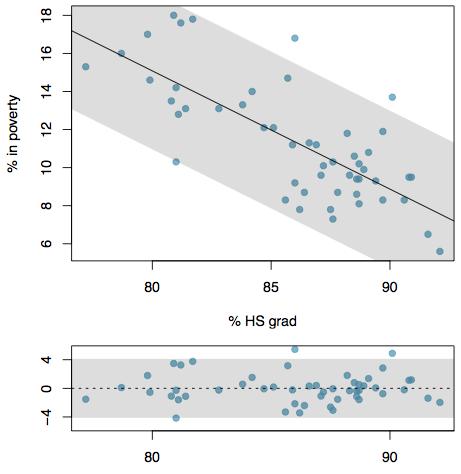
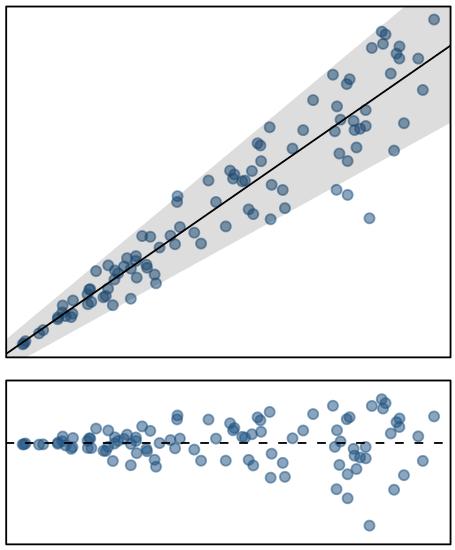
12 Linear Correlation: Assumptions Correlation and Regression 1. Linearity Assumes that the relationship between the paired scores is best described by a straight line 2. Normality Technically, assumes that the marginal score distributions, their joint distribution, and any conditional distributions are normally distributed However, most important assumption is that the residuals are normally distributed 3. Homoscedasticity (constant variance) Assumes that the variability around the regression line is homogeneous across different score values 12
13 Breaking Linearity and Normality Assumptions r = for all of the above 13
14 Which has the strongest correlation coefficient? 14
15 Other Correlation Coefficients Correlation and Regression Spearman s correlation coefficient (r s ) for ranked data As the name suggests, Spearman s correlation is used when the scores for both X and Y consist of (or have been converted to) ordinal ranks The point biserial correlation coefficient (r pb ) This correlation is used when one of the scores is continuous and the other is dichotomous, taking on one of only two possible values The phi correlation coefficient (r ϕ ) The phi correlation is used when both scores are dichotomous All of the above can be computed in the same manner as Pearson s correlation. 15
16 Converting Data for Spearman s Correlation Original Data Age Height r =
17 Converting Data for Spearman s Correlation Original Data Converted Scores Age Height Age Rank Height rank r = 0.86 r =
18 The Coefficient of Determination Correlation and Regression For linear correlations (and regression generally) the strength of fit of a model is most commonly evaluated using the r 2, the coefficient of determination. r 2 is calculated as the square of the correlation coefficient r, and represents the proportion of variability explained by the model. The remainder of the variability in the data that cannot be explained by the variables included in the model is called residual error 18
19 Testing for Significance of r Under a null hypothesis of ρ = 0 (and assuming normal residuals), the point estimate r is distributed as a t variable, with standard error: 2 1 r ˆ σ r = sr =, where dfr = n 2 df r This means that we can test whether r is significantly different from 0 by computing a the t-statistic: t r s df 1 r r ( df r ) = = r 2 r And computing the tail probability associated with the corresponding t distribution. 19
20 Introduction to Linear Regression Correlation and Regression Regression is a statistical procedure for modeling the relationship among variables to predict the value of a response ( or dependent) variable from one or more explanatory (or predictor) variables. Linear regression is the model assumed in computing a correlation coefficient In regression, the statistical model is made explicit. Imagine that I ask you to guess the weight of a college-aged male who is hidden from view What would your best guess be? 20
21 Introduction to Regression µ weight = σ weight =
22 Introduction to Regression Regression is a statistical procedure for modeling the relationship among variables to predict the value of a dependent variable from one or more predictor variables. Imagine that I ask you to guess the weight of a college-aged male who is hidden from view What would your best guess be? What if I also gave you his height? Intuitively, it should be clear that you can do better 22
23 Introduction to Regression 23
24 Introduction to Regression The Pearson correlation (ρ or r) measures the degree to which a set of data points form a linear (straight line) relationship. Simple regression describes the linear relationship between a dependent variable (Y) and one predictor variable (X) The resulting line is called the regression line. 24
25 Regression and Linear Equations Correlation and Regression You should remember the following from your high school algebra course: Any straight line can be represented by an equation of the form Y = b 1 X + b 0, where b 1 and b 0 are constants. The value of b 1 is called the slope and determines the direction and degree to which the line is tilted. The value of b 0 is called the Y-intercept and determines the point where the line crosses the Y-axis. In the context of linear regression, b 0 and b 1 are called regression coefficients 25
26 Regression and Linear Equations Correlation and Regression b b 1 0 = 0.5 = 1.0 Yˆ = bx+ b = 0.5X
27 Residuals: Errors of Prediction Correlation and Regression How well a regression line fits a set of data points can be measured by calculating the distance between the data points and the line. Using the formula Ŷ = b 1 X + b 0, it is possible to find the predicted value of Ŷ for any X. The residual, or error of prediction, between the predicted value and the actual value can be found by computing the difference Y -Ŷ The regression line is selected to be the best fit in the leastsquares sense. This means that we want to compute the line that minimizes the sum of squared residuals: SS ( Y ) 2 residual = Yˆ 27
28 Residuals: Errors of Prediction Correlation and Regression Yˆ = bx+ b 1 0 ( XY, ) ( Y Yˆ ) 28
29 Residuals: Errors of Prediction Correlation and Regression 29
30 The Standard Error of Estimate Correlation and Regression The measure of unpredicted variability or error for the regression line is called the standard error of estimate (s e or s Y-Ŷ ) You can think of it as analogous to the standard deviation if we were to use the mean Y as our estimate of the variable Y s SS Y = = df Y ( Y Y ) 2 n 1 s Y Yˆ SS residual = = df residual ( Y Yˆ ) 2 n 2 30
31 Computing Regression Coefficients Correlation and Regression Slope b 1 change in Y (as a function of X) = = change in X SP SS XY X or rs s Y X Intercept b0 = Y bx 1 31
32 Testing for Significance of b 1 Earlier, I pointed out that the sample correlation coefficient r is distributed as a t variable, with standard error 2 1 r ˆ σ r = sr =, where dfr = n 2 df r The slope b 1 is similarly distributed, but with a standard error s σ b1 b df n 1 s n 1 Y Yˆ ˆ = s =, with = 2 X This one s a bit more tricky to explain, but you can use the same procedure (a t-test) to evaluate the significance of the slope. 32
33 Prediction Using the linear model to predict the value of the response variable for a given value of the explanatory variable is called prediction, simply by plugging in the value of x in the linear model equation. There will be some uncertainty associated with the predicted value. 33
34 Example: Predicting Y from X Correlation and Regression You are told that a college student is 74 inches tall. Given the computed regression coefficients, what is your best estimate of his weight? X : height Y : weight b b 0 1 = = 5.44 Yˆ = bx + b = 5.44X ( ) Y ˆ = = =
35 Example: Computing Accuracy of Prediction Just as σ or s can be used to compute confidence intervals for population means, s Y-Ŷ can be used to compute predictive intervals for Y t ( ) ˆ df s crit Y Y 35
 s 1 Y Yˆ + ( x X ) 2 + nss SS X X Note that the actual formula for the predictive interval is slightly more complicated and depends on")
36 Example: Computing Accuracy of Prediction Just as σ or s can be used to compute confidence intervals for population means, s Y-Ŷ can be used to compute predictive intervals for Y t ci r t ( df ) s 1 Y Yˆ + ( x X ) 2 + nss SS X X Note that the actual formula for the predictive interval is slightly more complicated and depends on x. 36
37 Extrapolation Applying a model estimate to values outside of the realm of the original data is called extrapolation. Sometimes the intercept might be an extrapolation. 37
38 The Hazards of Extrapolation 38

39 The Hazards of Extrapolation 39

40 The Hazards of Extrapolation 40
41 41
42 42
43 43
44 44
Correlation: Relationships between Variables
 Correlation Correlation: Relationships between Variables So far, nearly all of our discussion of inferential statistics has focused on testing for differences between group means However, researchers are
Reminder: Student Instructional Rating Surveys
 Reminder: Student Instructional Rating Surveys You have until May 7 th to fill out the student instructional rating surveys at https://sakai.rutgers.edu/portal/site/sirs The survey should be available
Intro to Linear Regression
 Intro to Linear Regression Introduction to Regression Regression is a statistical procedure for modeling the relationship among variables to predict the value of a dependent variable from one or more predictor
Intro to Linear Regression
 Intro to Linear Regression Introduction to Regression Regression is a statistical procedure for modeling the relationship among variables to predict the value of a dependent variable from one or more predictor
Can you tell the relationship between students SAT scores and their college grades?
 Correlation One Challenge Can you tell the relationship between students SAT scores and their college grades? A: The higher SAT scores are, the better GPA may be. B: The higher SAT scores are, the lower
REVIEW 8/2/2017 陈芳华东师大英语系
 REVIEW Hypothesis testing starts with a null hypothesis and a null distribution. We compare what we have to the null distribution, if the result is too extreme to belong to the null distribution (p
Correlation. A statistics method to measure the relationship between two variables. Three characteristics
 Correlation Correlation A statistics method to measure the relationship between two variables Three characteristics Direction of the relationship Form of the relationship Strength/Consistency Direction
Chapter 16: Correlation
 Chapter : Correlation So far We ve focused on hypothesis testing Is the relationship we observe between x and y in our sample true generally (i.e. for the population from which the sample came) Which answers
Business Statistics. Lecture 10: Correlation and Linear Regression
 Business Statistics Lecture 10: Correlation and Linear Regression Scatterplot A scatterplot shows the relationship between two quantitative variables measured on the same individuals. It displays the Form
Chapter 16: Correlation
 Chapter 16: Correlation Correlations: Measuring and Describing Relationships A correlation is a statistical method used to measure and describe the relationship between two variables. A relationship exists
Ch. 16: Correlation and Regression
 Ch. 1: Correlation and Regression With the shift to correlational analyses, we change the very nature of the question we are asking of our data. Heretofore, we were asking if a difference was likely to
Unit 6 - Introduction to linear regression
 Unit 6 - Introduction to linear regression Suggested reading: OpenIntro Statistics, Chapter 7 Suggested exercises: Part 1 - Relationship between two numerical variables: 7.7, 7.9, 7.11, 7.13, 7.15, 7.25,
Unit 6 - Simple linear regression
 Sta 101: Data Analysis and Statistical Inference Dr. Çetinkaya-Rundel Unit 6 - Simple linear regression LO 1. Define the explanatory variable as the independent variable (predictor), and the response variable
Chs. 15 & 16: Correlation & Regression
 Chs. 15 & 16: Correlation & Regression With the shift to correlational analyses, we change the very nature of the question we are asking of our data. Heretofore, we were asking if a difference was likely
Inference for the Regression Coefficient
 Inference for the Regression Coefficient Recall, b 0 and b 1 are the estimates of the slope β 1 and intercept β 0 of population regression line. We can shows that b 0 and b 1 are the unbiased estimates
11 Correlation and Regression
 Chapter 11 Correlation and Regression August 21, 2017 1 11 Correlation and Regression When comparing two variables, sometimes one variable (the explanatory variable) can be used to help predict the value
Measuring Associations : Pearson s correlation
 Measuring Associations : Pearson s correlation Scatter Diagram A scatter diagram is a graph that shows that the relationship between two variables measured on the same individual. Each individual in the
Chs. 16 & 17: Correlation & Regression
 Chs. 16 & 17: Correlation & Regression With the shift to correlational analyses, we change the very nature of the question we are asking of our data. Heretofore, we were asking if a difference was likely
CORELATION - Pearson-r - Spearman-rho
 CORELATION - Pearson-r - Spearman-rho Scatter Diagram A scatter diagram is a graph that shows that the relationship between two variables measured on the same individual. Each individual in the set is
Readings Howitt & Cramer (2014) Overview
 Overview") Readings Howitt & Cramer (4) Ch 7: Relationships between two or more variables: Diagrams and tables Ch 8: Correlation coefficients: Pearson correlation and Spearman s rho Ch : Statistical significance
Readings Howitt & Cramer (4) Ch 7: Relationships between two or more variables: Diagrams and tables Ch 8: Correlation coefficients: Pearson correlation and Spearman s rho Ch : Statistical significance
9. Linear Regression and Correlation
 9. Linear Regression and Correlation Data: y a quantitative response variable x a quantitative explanatory variable (Chap. 8: Recall that both variables were categorical) For example, y = annual income,
Multiple Regression. Inference for Multiple Regression and A Case Study. IPS Chapters 11.1 and W.H. Freeman and Company
 Multiple Regression Inference for Multiple Regression and A Case Study IPS Chapters 11.1 and 11.2 2009 W.H. Freeman and Company Objectives (IPS Chapters 11.1 and 11.2) Multiple regression Data for multiple
Inferences for Regression
 Inferences for Regression An Example: Body Fat and Waist Size Looking at the relationship between % body fat and waist size (in inches). Here is a scatterplot of our data set: Remembering Regression In
Chapter 14. Statistical versus Deterministic Relationships. Distance versus Speed. Describing Relationships: Scatterplots and Correlation
 Chapter 14 Describing Relationships: Scatterplots and Correlation Chapter 14 1 Statistical versus Deterministic Relationships Distance versus Speed (when travel time is constant). Income (in millions of
9 Correlation and Regression
 9 Correlation and Regression SW, Chapter 12. Suppose we select n = 10 persons from the population of college seniors who plan to take the MCAT exam. Each takes the test, is coached, and then retakes the
Readings Howitt & Cramer (2014)
") Readings Howitt & Cramer (014) Ch 7: Relationships between two or more variables: Diagrams and tables Ch 8: Correlation coefficients: Pearson correlation and Spearman s rho Ch 11: Statistical significance
Readings Howitt & Cramer (014) Ch 7: Relationships between two or more variables: Diagrams and tables Ch 8: Correlation coefficients: Pearson correlation and Spearman s rho Ch 11: Statistical significance
Variance. Standard deviation VAR = = value. Unbiased SD = SD = 10/23/2011. Functional Connectivity Correlation and Regression.
 10/3/011 Functional Connectivity Correlation and Regression Variance VAR = Standard deviation Standard deviation SD = Unbiased SD = 1 10/3/011 Standard error Confidence interval SE = CI = = t value for
Answer Key. 9.1 Scatter Plots and Linear Correlation. Chapter 9 Regression and Correlation. CK-12 Advanced Probability and Statistics Concepts 1
 9.1 Scatter Plots and Linear Correlation Answers 1. A high school psychologist wants to conduct a survey to answer the question: Is there a relationship between a student s athletic ability and his/her
Correlation and regression
 NST 1B Experimental Psychology Statistics practical 1 Correlation and regression Rudolf Cardinal & Mike Aitken 11 / 12 November 2003 Department of Experimental Psychology University of Cambridge Handouts:
Review of Statistics 101
 Review of Statistics 101 We review some important themes from the course 1. Introduction Statistics- Set of methods for collecting/analyzing data (the art and science of learning from data). Provides methods
Statistics Introductory Correlation
 Statistics Introductory Correlation Session 10 oscardavid.barrerarodriguez@sciencespo.fr April 9, 2018 Outline 1 Statistics are not used only to describe central tendency and variability for a single variable.
INFERENCE FOR REGRESSION
 CHAPTER 3 INFERENCE FOR REGRESSION OVERVIEW In Chapter 5 of the textbook, we first encountered regression. The assumptions that describe the regression model we use in this chapter are the following. We
Correlation. What Is Correlation? Why Correlations Are Used
 Correlation 1 What Is Correlation? Correlation is a numerical value that describes and measures three characteristics of the relationship between two variables, X and Y The direction of the relationship
Correlation Analysis
 Simple Regression Correlation Analysis Correlation analysis is used to measure strength of the association (linear relationship) between two variables Correlation is only concerned with strength of the
Relationship Between Interval and/or Ratio Variables: Correlation & Regression. Sorana D. BOLBOACĂ
 Relationship Between Interval and/or Ratio Variables: Correlation & Regression Sorana D. BOLBOACĂ OUTLINE Correlation Definition Deviation Score Formula, Z score formula Hypothesis Test Regression - Intercept
Chapter 10. Regression. Understandable Statistics Ninth Edition By Brase and Brase Prepared by Yixun Shi Bloomsburg University of Pennsylvania
 Chapter 10 Regression Understandable Statistics Ninth Edition By Brase and Brase Prepared by Yixun Shi Bloomsburg University of Pennsylvania Scatter Diagrams A graph in which pairs of points, (x, y), are
Chapter 7 Linear Regression
 Chapter 7 Linear Regression 1 7.1 Least Squares: The Line of Best Fit 2 The Linear Model Fat and Protein at Burger King The correlation is 0.76. This indicates a strong linear fit, but what line? The line
regression analysis is a type of inferential statistics which tells us whether relationships between two or more variables exist
 regression analysis is a type of inferential statistics which tells us whether relationships between two or more variables exist sales $ (y - dependent variable) advertising $ (x - independent variable)
AP Statistics Unit 6 Note Packet Linear Regression. Scatterplots and Correlation
 Scatterplots and Correlation Name Hr A scatterplot shows the relationship between two quantitative variables measured on the same individuals. variable (y) measures an outcome of a study variable (x) may
Chapter 27 Summary Inferences for Regression
 Chapter 7 Summary Inferences for Regression What have we learned? We have now applied inference to regression models. Like in all inference situations, there are conditions that we must check. We can test
B. Weaver (24-Mar-2005) Multiple Regression Chapter 5: Multiple Regression Y ) (5.1) Deviation score = (Y i
 Multiple Regression Chapter 5: Multiple Regression Y ) (5.1) Deviation score = (Y i") B. Weaver (24-Mar-2005) Multiple Regression... 1 Chapter 5: Multiple Regression 5.1 Partial and semi-partial correlation Before starting on multiple regression per se, we need to consider the concepts
B. Weaver (24-Mar-2005) Multiple Regression... 1 Chapter 5: Multiple Regression 5.1 Partial and semi-partial correlation Before starting on multiple regression per se, we need to consider the concepts
Mathematics for Economics MA course
 Mathematics for Economics MA course Simple Linear Regression Dr. Seetha Bandara Simple Regression Simple linear regression is a statistical method that allows us to summarize and study relationships between
Objectives Simple linear regression. Statistical model for linear regression. Estimating the regression parameters
 Objectives 10.1 Simple linear regression Statistical model for linear regression Estimating the regression parameters Confidence interval for regression parameters Significance test for the slope Confidence
Chapter 8: Correlation & Regression
 Chapter 8: Correlation & Regression We can think of ANOVA and the two-sample t-test as applicable to situations where there is a response variable which is quantitative, and another variable that indicates
Area1 Scaled Score (NAPLEX) .535 ** **.000 N. Sig. (2-tailed)
 .535 ** **.000 N. Sig. (2-tailed)") Institutional Assessment Report Texas Southern University College of Pharmacy and Health Sciences "An Analysis of 2013 NAPLEX, P4-Comp. Exams and P3 courses The following analysis illustrates relationships
Institutional Assessment Report Texas Southern University College of Pharmacy and Health Sciences "An Analysis of 2013 NAPLEX, P4-Comp. Exams and P3 courses The following analysis illustrates relationships
How can we explore the association between two quantitative variables?
 How can we explore the association between two quantitative variables? An association exists between two variables if a particular value of one variable is more likely to occur with certain values of the
STAT 350 Final (new Material) Review Problems Key Spring 2016
 Review Problems Key Spring 2016") 1. The editor of a statistics textbook would like to plan for the next edition. A key variable is the number of pages that will be in the final version. Text files are prepared by the authors using LaTeX,
1. The editor of a statistics textbook would like to plan for the next edition. A key variable is the number of pages that will be in the final version. Text files are prepared by the authors using LaTeX,
Business Statistics. Lecture 9: Simple Regression
 Business Statistics Lecture 9: Simple Regression 1 On to Model Building! Up to now, class was about descriptive and inferential statistics Numerical and graphical summaries of data Confidence intervals
Multiple Regression. More Hypothesis Testing. More Hypothesis Testing The big question: What we really want to know: What we actually know: We know:
 Multiple Regression Ψ320 Ainsworth More Hypothesis Testing What we really want to know: Is the relationship in the population we have selected between X & Y strong enough that we can use the relationship
Chapter 5 Friday, May 21st
 Chapter 5 Friday, May 21 st Overview In this Chapter we will see three different methods we can use to describe a relationship between two quantitative variables. These methods are: Scatterplot Correlation
Simple Linear Regression
 Simple Linear Regression EdPsych 580 C.J. Anderson Fall 2005 Simple Linear Regression p. 1/80 Outline 1. What it is and why it s useful 2. How 3. Statistical Inference 4. Examining assumptions (diagnostics)
Sampling Distributions: Central Limit Theorem
 Review for Exam 2 Sampling Distributions: Central Limit Theorem Conceptually, we can break up the theorem into three parts: 1. The mean (µ M ) of a population of sample means (M) is equal to the mean (µ)
Chapter 9 - Correlation and Regression
 Chapter 9 - Correlation and Regression 9. Scatter diagram of percentage of LBW infants (Y) and high-risk fertility rate (X ) in Vermont Health Planning Districts. 9.3 Correlation between percentage of
Chapter Goals. To understand the methods for displaying and describing relationship among variables. Formulate Theories.
 Chapter Goals To understand the methods for displaying and describing relationship among variables. Formulate Theories Interpret Results/Make Decisions Collect Data Summarize Results Chapter 7: Is There
Example: Forced Expiratory Volume (FEV) Program L13. Example: Forced Expiratory Volume (FEV) Example: Forced Expiratory Volume (FEV)
 Program L13. Example: Forced Expiratory Volume (FEV) Example: Forced Expiratory Volume (FEV)") Program L13 Relationships between two variables Correlation, cont d Regression Relationships between more than two variables Multiple linear regression Two numerical variables Linear or curved relationship?
Program L13 Relationships between two variables Correlation, cont d Regression Relationships between more than two variables Multiple linear regression Two numerical variables Linear or curved relationship?
Final Exam - Solutions
 Ecn 102 - Analysis of Economic Data University of California - Davis March 19, 2010 Instructor: John Parman Final Exam - Solutions You have until 5:30pm to complete this exam. Please remember to put your
Correlation and Regression Bangkok, 14-18, Sept. 2015
 Analysing and Understanding Learning Assessment for Evidence-based Policy Making Correlation and Regression Bangkok, 14-18, Sept. 2015 Australian Council for Educational Research Correlation The strength
Psychology 282 Lecture #4 Outline Inferences in SLR
 Psychology 282 Lecture #4 Outline Inferences in SLR Assumptions To this point we have not had to make any distributional assumptions. Principle of least squares requires no assumptions. Can use correlations
AMS 315/576 Lecture Notes. Chapter 11. Simple Linear Regression
 AMS 315/576 Lecture Notes Chapter 11. Simple Linear Regression 11.1 Motivation A restaurant opening on a reservations-only basis would like to use the number of advance reservations x to predict the number
23. Inference for regression
 23. Inference for regression The Practice of Statistics in the Life Sciences Third Edition 2014 W. H. Freeman and Company Objectives (PSLS Chapter 23) Inference for regression The regression model Confidence
Eco 391, J. Sandford, spring 2013 April 5, Midterm 3 4/5/2013
 Midterm 3 4/5/2013 Instructions: You may use a calculator, and one sheet of notes. You will never be penalized for showing work, but if what is asked for can be computed directly, points awarded will depend
Hypothesis Testing hypothesis testing approach
 Hypothesis Testing In this case, we d be trying to form an inference about that neighborhood: Do people there shop more often those people who are members of the larger population To ascertain this, we
Lecture 14. Analysis of Variance * Correlation and Regression. The McGraw-Hill Companies, Inc., 2000
 Lecture 14 Analysis of Variance * Correlation and Regression Outline Analysis of Variance (ANOVA) 11-1 Introduction 11-2 Scatter Plots 11-3 Correlation 11-4 Regression Outline 11-5 Coefficient of Determination
Lecture 14. Outline. Outline. Analysis of Variance * Correlation and Regression Analysis of Variance (ANOVA)
") Outline Lecture 14 Analysis of Variance * Correlation and Regression Analysis of Variance (ANOVA) 11-1 Introduction 11- Scatter Plots 11-3 Correlation 11-4 Regression Outline 11-5 Coefficient of Determination
Outline Lecture 14 Analysis of Variance * Correlation and Regression Analysis of Variance (ANOVA) 11-1 Introduction 11- Scatter Plots 11-3 Correlation 11-4 Regression Outline 11-5 Coefficient of Determination
Notes 6: Correlation
 Notes 6: Correlation 1. Correlation correlation: this term usually refers to the degree of relationship or association between two quantitative variables, such as IQ and GPA, or GPA and SAT, or HEIGHT
Inverse of a Square Matrix. For an N N square matrix A, the inverse of A, 1
 Inverse of a Square Matrix For an N N square matrix A, the inverse of A, 1 A, exists if and only if A is of full rank, i.e., if and only if no column of A is a linear combination 1 of the others. A is
ANCOVA. ANCOVA allows the inclusion of a 3rd source of variation into the F-formula (called the covariate) and changes the F-formula
 and changes the F-formula") ANCOVA Workings of ANOVA & ANCOVA ANCOVA, Semi-Partial correlations, statistical control Using model plotting to think about ANCOVA & Statistical control You know how ANOVA works the total variation among
ANCOVA Workings of ANOVA & ANCOVA ANCOVA, Semi-Partial correlations, statistical control Using model plotting to think about ANCOVA & Statistical control You know how ANOVA works the total variation among
DETAILED CONTENTS PART I INTRODUCTION AND DESCRIPTIVE STATISTICS. 1. Introduction to Statistics
 DETAILED CONTENTS About the Author Preface to the Instructor To the Student How to Use SPSS With This Book PART I INTRODUCTION AND DESCRIPTIVE STATISTICS 1. Introduction to Statistics 1.1 Descriptive and
Chapter 10. Correlation and Regression. McGraw-Hill, Bluman, 7th ed., Chapter 10 1
 Chapter 10 Correlation and Regression McGraw-Hill, Bluman, 7th ed., Chapter 10 1 Chapter 10 Overview Introduction 10-1 Scatter Plots and Correlation 10- Regression 10-3 Coefficient of Determination and
CRP 272 Introduction To Regression Analysis
 CRP 272 Introduction To Regression Analysis 30 Relationships Among Two Variables: Interpretations One variable is used to explain another variable X Variable Independent Variable Explaining Variable Exogenous
Key Algebraic Results in Linear Regression
 Key Algebraic Results in Linear Regression James H. Steiger Department of Psychology and Human Development Vanderbilt University James H. Steiger (Vanderbilt University) 1 / 30 Key Algebraic Results in
Lecture 10 Multiple Linear Regression
 Lecture 10 Multiple Linear Regression STAT 512 Spring 2011 Background Reading KNNL: 6.1-6.5 10-1 Topic Overview Multiple Linear Regression Model 10-2 Data for Multiple Regression Y i is the response variable
This document contains 3 sets of practice problems.
 P RACTICE PROBLEMS This document contains 3 sets of practice problems. Correlation: 3 problems Regression: 4 problems ANOVA: 8 problems You should print a copy of these practice problems and bring them
Business Statistics. Lecture 10: Course Review
 Business Statistics Lecture 10: Course Review 1 Descriptive Statistics for Continuous Data Numerical Summaries Location: mean, median Spread or variability: variance, standard deviation, range, percentiles,
Lecture 3: Inference in SLR
 Lecture 3: Inference in SLR STAT 51 Spring 011 Background Reading KNNL:.1.6 3-1 Topic Overview This topic will cover: Review of hypothesis testing Inference about 1 Inference about 0 Confidence Intervals
Chapter 11. Correlation and Regression
 Chapter 11. Correlation and Regression The word correlation is used in everyday life to denote some form of association. We might say that we have noticed a correlation between foggy days and attacks of
Nature vs. nurture? Lecture 18 - Regression: Inference, Outliers, and Intervals. Regression Output. Conditions for inference.
 Understanding regression output from software Nature vs. nurture? Lecture 18 - Regression: Inference, Outliers, and Intervals In 1966 Cyril Burt published a paper called The genetic determination of differences
Econometrics Review questions for exam
 Econometrics Review questions for exam Nathaniel Higgins nhiggins@jhu.edu, 1. Suppose you have a model: y = β 0 x 1 + u You propose the model above and then estimate the model using OLS to obtain: ŷ =
Lecture 18: Simple Linear Regression
 Lecture 18: Simple Linear Regression BIOS 553 Department of Biostatistics University of Michigan Fall 2004 The Correlation Coefficient: r The correlation coefficient (r) is a number that measures the strength
Statistics in medicine
 Statistics in medicine Lecture 4: and multivariable regression Fatma Shebl, MD, MS, MPH, PhD Assistant Professor Chronic Disease Epidemiology Department Yale School of Public Health Fatma.shebl@yale.edu
Prob/Stats Questions? /32
 Prob/Stats 10.4 Questions? 1 /32 Prob/Stats 10.4 Homework Apply p551 Ex 10-4 p 551 7, 8, 9, 10, 12, 13, 28 2 /32 Prob/Stats 10.4 Objective Compute the equation of the least squares 3 /32 Regression A scatter
The Simple Linear Regression Model
 The Simple Linear Regression Model Lesson 3 Ryan Safner 1 1 Department of Economics Hood College ECON 480 - Econometrics Fall 2017 Ryan Safner (Hood College) ECON 480 - Lesson 3 Fall 2017 1 / 77 Bivariate
Draft Proof - Do not copy, post, or distribute. Chapter Learning Objectives REGRESSION AND CORRELATION THE SCATTER DIAGRAM
 1 REGRESSION AND CORRELATION As we learned in Chapter 9 ( Bivariate Tables ), the differential access to the Internet is real and persistent. Celeste Campos-Castillo s (015) research confirmed the impact
Section 3: Simple Linear Regression
 Section 3: Simple Linear Regression Carlos M. Carvalho The University of Texas at Austin McCombs School of Business http://faculty.mccombs.utexas.edu/carlos.carvalho/teaching/ 1 Regression: General Introduction
STAT Chapter 11: Regression
 STAT 515 -- Chapter 11: Regression Mostly we have studied the behavior of a single random variable. Often, however, we gather data on two random variables. We wish to determine: Is there a relationship
Inference for Regression Inference about the Regression Model and Using the Regression Line
 Inference for Regression Inference about the Regression Model and Using the Regression Line PBS Chapter 10.1 and 10.2 2009 W.H. Freeman and Company Objectives (PBS Chapter 10.1 and 10.2) Inference about
Multiple Linear Regression
 Multiple Linear Regression Simple linear regression tries to fit a simple line between two variables Y and X. If X is linearly related to Y this explains some of the variability in Y. In most cases, there
Bivariate Relationships Between Variables
 Bivariate Relationships Between Variables BUS 735: Business Decision Making and Research 1 Goals Specific goals: Detect relationships between variables. Be able to prescribe appropriate statistical methods
Review of Statistics
 Review of Statistics Topics Descriptive Statistics Mean, Variance Probability Union event, joint event Random Variables Discrete and Continuous Distributions, Moments Two Random Variables Covariance and
ST430 Exam 1 with Answers
 ST430 Exam 1 with Answers Date: October 5, 2015 Name: Guideline: You may use one-page (front and back of a standard A4 paper) of notes. No laptop or textook are permitted but you may use a calculator.
Chapter 10-Regression
 Chapter 10-Regression 10.1 Regression equation predicting infant mortality from income Y = Infant mortality X = Income Y = 6.70 s Y = 0.698 s 2 Y = 0.487 X = 46.00 s X = 6.289 s 2 X = 39.553 cov XY = 2.7245
Multiple Linear Regression
 1. Purpose To Model Dependent Variables Multiple Linear Regression Purpose of multiple and simple regression is the same, to model a DV using one or more predictors (IVs) and perhaps also to obtain a prediction
Psychology Seminar Psych 406 Dr. Jeffrey Leitzel
 Psychology Seminar Psych 406 Dr. Jeffrey Leitzel Structural Equation Modeling Topic 1: Correlation / Linear Regression Outline/Overview Correlations (r, pr, sr) Linear regression Multiple regression interpreting
Simple Linear Regression: One Quantitative IV
 Simple Linear Regression: One Quantitative IV Linear regression is frequently used to explain variation observed in a dependent variable (DV) with theoretically linked independent variables (IV). For example,
CHAPTER 4 & 5 Linear Regression with One Regressor. Kazu Matsuda IBEC PHBU 430 Econometrics
 CHAPTER 4 & 5 Linear Regression with One Regressor Kazu Matsuda IBEC PHBU 430 Econometrics Introduction Simple linear regression model = Linear model with one independent variable. y = dependent variable
Important note: Transcripts are not substitutes for textbook assignments. 1
 In this lesson we will cover correlation and regression, two really common statistical analyses for quantitative (or continuous) data. Specially we will review how to organize the data, the importance
appstats27.notebook April 06, 2017
 Chapter 27 Objective Students will conduct inference on regression and analyze data to write a conclusion. Inferences for Regression An Example: Body Fat and Waist Size pg 634 Our chapter example revolves
Announcements: You can turn in homework until 6pm, slot on wall across from 2202 Bren. Make sure you use the correct slot! (Stats 8, closest to wall)
") Announcements: You can turn in homework until 6pm, slot on wall across from 2202 Bren. Make sure you use the correct slot! (Stats 8, closest to wall) We will cover Chs. 5 and 6 first, then 3 and 4. Mon,
Announcements: You can turn in homework until 6pm, slot on wall across from 2202 Bren. Make sure you use the correct slot! (Stats 8, closest to wall) We will cover Chs. 5 and 6 first, then 3 and 4. Mon,
Data files for today. CourseEvalua2on2.sav pontokprediktorok.sav Happiness.sav Ca;erplot.sav
 Correlation Data files for today CourseEvalua2on2.sav pontokprediktorok.sav Happiness.sav Ca;erplot.sav Defining Correlation Co-variation or co-relation between two variables These variables change together
ECON3150/4150 Spring 2015
 ECON3150/4150 Spring 2015 Lecture 3&4 - The linear regression model Siv-Elisabeth Skjelbred University of Oslo January 29, 2015 1 / 67 Chapter 4 in S&W Section 17.1 in S&W (extended OLS assumptions) 2