A GEOSTATISTICAL APPROACH TO PREDICTING A PHYSICAL VARIABLE THROUGH A CONTINUOUS SURFACE
|
|
|
- Claire Daniels
- 5 years ago
- Views:
Transcription

1 Katherine E. Williams University of Denver GEOG3010 Geogrpahic Information Analysis April 28, 2011 A GEOSTATISTICAL APPROACH TO PREDICTING A PHYSICAL VARIABLE THROUGH A CONTINUOUS SURFACE
2 Overview Data Regression model Ordinary Least Squares Diagnostic Statistics Exploratory Regression Geographically Weighted Regression Interpolation Measured vs. Predicted
3 Pre-Processing Recommendations Make sure data is clean & organized Use consistent projections Work in a File Geodatabase (if possible) Explore & understand your data Distributions, variables, etc. Read the statistical documentation Be ready to analyze outcomes The software will not do everything for you
4 Data Soil Moisture Spatial Survey (SMSS) 117 points Dependent Variable: Volumetric Water Content (VWC) 21 Candidate Explanatory Variables Goal: Create a continuous VWC surface that models changes induced by microtopographic features (less than 10 meters)

5 SMSS Study Area Map
6 SMSS Plan 1. Find a model from my explanatory variables that best predicts VWC 2. Create an interpolated surface for VWC What method should I use? How do I find available options? How do I choose between methods?


7 Ordinary Least Squares Regression Describes relationship between dependent variable and explanatory variable(s) Global model, single regression equation Dependent Variable y= X + X + + X + β β β ε Coefficients n n Explanatory Variables Random Error

8 Ordinary Least Squares Regression Minimizes squared distance between observed and predicted Residuals are the portion of the dependent variable that is unaccounted for by the regression model
9 OLS Pitfalls Misspecification Missing variables Outliers (scatter plot) Non-linear relationships (scatter plot) Multicollinearity (VIF) Normal distribution bias (Jarque-Bera) Nonstationarity (Kroenker BP) Residual spatial autocorrelation (Moran s I)
10 Exploratory Regression Tool Supplementary Spatial Statistics Toolbox entary-spatial-statistics-now-available-for-download_2100_.aspx Iterates through OLS models Identifies properly specified OLS models Diagnostic Statistics assess model performance, redundancy, bias, and residual distribution

11 Exploratory Regression for SMSS Passing Model 3 explanatory variables: Slope, Vegetation Type, Percent Cover
12 Scatter Plot Simple way to look at data distribution Patterns should be linear Transformation Outliers Remove data points & re-run model Dependent variable Random Linear Non-Linear Explanatory Variable
13 Coefficient of Determination (Adjusted R 2 ) Ability of model to predict variability in dependent variable Value range: 0 to 1 Higher values explain more Above 0.50 is considered passing for the ER Tool SMSS Value: 0.61 (final OLS)
14 Variance Inflation Factor (VIF) Explanatory Variable Redundancy High values indicate that explanatory variables are interacting Multicollinearity Passing VIF value < 7.5 SMSS Values: Slope (1.23), Vegetation Type (1.46), and Percent Cover (1.21)
15 Corrected Akaike s Information Criterion Measure of model fit Can be used to compare models with same dependent variable Lower values are better Interpolation bandwidth SMSS Value: (final OLS)

16 Jarque-Bera Statistic Residual Numeric Distribution (Bias) Null Hypothesis is a normal distribution Significant p-value means non-normal distribution SMSS p-value: 0.08
17 Kroenker s BP Statistic Consistency of dependent/explanatory variable relationship Significance indicates the relationship is not consistent Nonstationarity A Geographically Weighted Regression should be considered SMSS p-value: *
18 Moran s Index Spatial autocorrelation in residuals Value Range -1 to 1 (-1=dispersion, 0=CSR, 1=clustering) Significant values indicate deviation from CSR Clustering of under & over prediction Missing key explanatory variable SMSS Value:

19 Moran s I Report
20 Spatial Weights Matrix Conceptualization of spatial relationships Structure for Moran s I, Hot Spot, & Clustering Statistics Neighbors or distance Should reflect real relationship in data SMSS SWM: Inverse Distance Squared
21 OLS Diagnostic Summary for SMSS Missing variables Outliers (scatter plot) Non-linear relationships (scatter plot) Multicollinearity (VIF) Normal distribution bias (Jarque-Bera) Nonstationarity (Kroenker BP) Residual spatial autocorrelation (Moran s I)
22 Geographically Weighted Regression Local Regression Model Calculates individual equations for each point Multilevel model Average value Random component Local coefficients Disaggregate local variations from overall model
23 Geographically Weighted Regression Based on neighborhood or distance search Kernel and Bandwidth GWR does not provide robust diagnostic statistics Relationships should be inspected in OLS first!
24 SMSS Study GWR Bandwidth 266 m Residual Squared 1.26 Effectiveness Number 28.5 Adjusted R AICc Moran s I p-value
25 What s Next? Have a properly specified OLS/GWR model Says something about the why in soil moisture variation Physical variables that control or are indicators of soil moisture Only says something about soil moisture at the sample points where soil moisture is already known Does not inform about locations where soil moisture has not already been measured
26 Interpolation Estimates values from limited input point data for a continuous raster surface Works on concept that spatial objects are spatially correlated Many types: IDW, Kriging, Natural Neighbor, Spline, Trend, etc. Best technique often depends on the data SMSS compares IDW and Ordinary Kriging

27 Inverse Distance Weighting Exact interpolator Distance determines weight Exponential distance decay with higher power designation Search Window Shape Bandwidth Neighbors
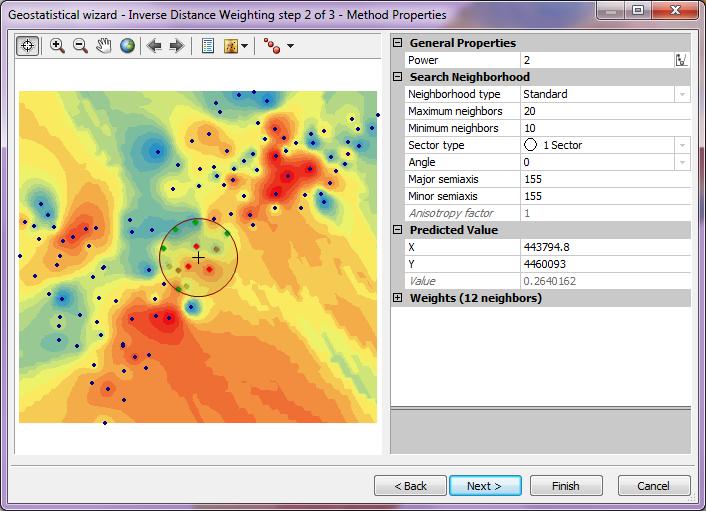
28 IDW Parameters
29 Ordinary Kriging Uses spatial relationships in data to build prediction model Build Semiovariogram Fit Model Predict Need to explore data to specify most appropriate method Search Window Model Type

30 Semivariogram & Kriging Parameters
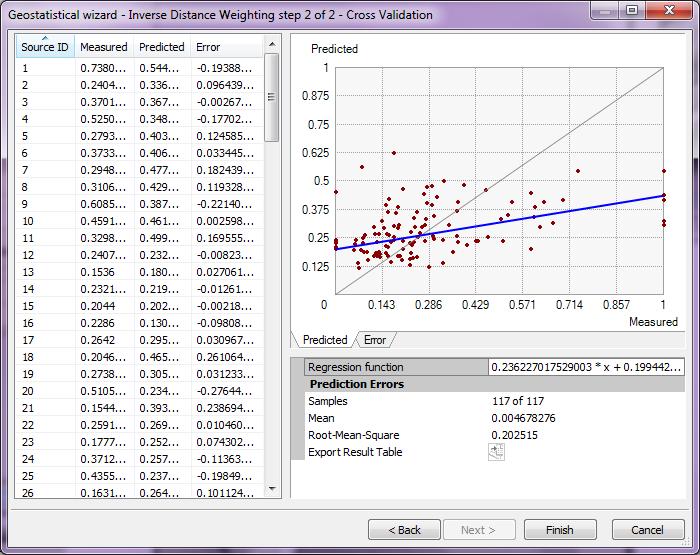
31 IDW Cross Validation

32 Kriging Cross Validation

33 SMSS IDW Surface

34 SMSS OK Surface
35 SMSS Cross Validation Field Points Measured n=117 Summary Statistics Ordinary Kriging Inverse Distance Weighting Predicted Error Mean Predicted Error RMS Predicted Regression Function Error Regression Function y = * x y = * x y = * x y = * x

36 Where are we at? Continuous Interpolated Surface for VWC Is it sufficient? Am I modeling variance related to topography?
37 Regression Model Predict Regression models are equations Unknown dependent variables can be computed with known explanatory variables Built into GWR interface as Additional Parameters Explanatory variables must be input in the same order as input data

38 Predicted Points If, Explanatory Variables are known. Then, the Dependent Variable can be computed with OLS or GWR Field points 10 & 5 meter grids


39 Defining Explanatory Variables Create Continuous Surfaces Extract Values to Points Input into GWR Does not further inform the GWR model Re-run Interpolation


40 SMSS 10 & 5 meter IDW Surfaces

41 SMSS 10 & 5 meter OK Surfaces
42 Cross Validation 10m Grid Points GWR Predicted n= m Grid Points GWR Predicted n=42531 Summary Statistics Ordinary Kriging Inverse Distance Weighting Predicted Error Mean Predicted Error RMS Predicted Regression Function Error Regression Function y = * x y = * x y = * x y = * x Predicted Error Mean Predicted Error RMS Predicted Regression Function Error Regression Function y = * x y = * x y = * x y = * x
43 Now what do we have? Modeled surface at high resolution from limited data Picking up midslope variability


44 Summary of SMSS
45 Lessons Learned Spatial statistical methods are powerful However, all statistical methods must be carefully evaluated to avoid misspecification Think out of the box Make sure you are answering the right questions Use your resources! ArcGIS has extensive documentation & experts who are willing to help
46 Additional Resources ArcGIS Desktop Help ArcGIS Resource Center Spatial Statistics Toolbox p/#/an_overview_of_the_spatial_statistics_too lbox/005p / Geoprocessing Blog default.aspx Documentation with Supplementary Spatial Statistics Toolbox download
Modeling Spatial Relationships using Regression Analysis
 Esri International User Conference San Diego, CA Technical Workshops July 2011 Modeling Spatial Relationships using Regression Analysis Lauren M. Scott, PhD Lauren Rosenshein, MS Mark V. Janikas, PhD Answering
Modeling Spatial Relationships Using Regression Analysis
 Esri International User Conference San Diego, California Technical Workshops July 24, 2012 Modeling Spatial Relationships Using Regression Analysis Lauren M. Scott, PhD Lauren Rosenshein Bennett, MS Answering
Modeling Spatial Relationships Using Regression Analysis. Lauren M. Scott, PhD Lauren Rosenshein Bennett, MS
 Modeling Spatial Relationships Using Regression Analysis Lauren M. Scott, PhD Lauren Rosenshein Bennett, MS Workshop Overview Answering why? questions Introduce regression analysis - What it is and why
Exploratory Spatial Data Analysis (ESDA)
") Exploratory Spatial Data Analysis (ESDA) VANGHR s method of ESDA follows a typical geospatial framework of selecting variables, exploring spatial patterns, and regression analysis. The primary software
Exploratory Spatial Data Analysis (ESDA) VANGHR s method of ESDA follows a typical geospatial framework of selecting variables, exploring spatial patterns, and regression analysis. The primary software
GIS Analysis: Spatial Statistics for Public Health: Lauren M. Scott, PhD; Mark V. Janikas, PhD
 Some Slides to Go Along with the Demo Hot spot analysis of average age of death Section B DEMO: Mortality Data Analysis 2 Some Slides to Go Along with the Demo Do Economic Factors Alone Explain Early Death?
Using Spatial Statistics Social Service Applications Public Safety and Public Health
 Using Spatial Statistics Social Service Applications Public Safety and Public Health Lauren Rosenshein 1 Regression analysis Regression analysis allows you to model, examine, and explore spatial relationships,
Summary of OLS Results - Model Variables
 Summary of OLS Results - Model Variables Variable Coefficient [a] StdError t-statistic Probability [b] Robust_SE Robust_t Robust_Pr [b] VIF [c] Intercept 12.722048 1.710679 7.436839 0.000000* 2.159436
Spatial analysis. Spatial descriptive analysis. Spatial inferential analysis:
 Spatial analysis Spatial descriptive analysis Point pattern analysis (minimum bounding box, mean center, weighted mean center, standard distance, nearest neighbor analysis) Spatial clustering analysis
GEOSTATISTICAL METHODS FOR PREDICTING SOIL MOISTURE CONTINUOUSLY IN A SUBALPINE BASIN
 GEOSTATISTICAL METHODS FOR PREDICTING SOIL MOISTURE CONTINUOUSLY IN A SUBALPINE BASIN A Technical Paper Presented to the Faculty of Natural Sciences and Mathematics University of Denver In Partial Fulfillment
Spatial Analysis with ArcGIS Pro STUDENT EDITION
 Spatial Analysis with ArcGIS Pro STUDENT EDITION Copyright 2018 Esri All rights reserved. Course version 2.0. Version release date November 2018. Printed in the United States of America. The information
GeoDa-GWR Results: GeoDa-GWR Output (portion only): Program began at 4/8/2016 4:40:38 PM
: Program began at 4/8/2016 4:40:38 PM") New Mexico Health Insurance Coverage, 2009-2013 Exploratory, Ordinary Least Squares, and Geographically Weighted Regression Using GeoDa-GWR, R, and QGIS Larry Spear 4/13/2016 (Draft) A dataset consisting
New Mexico Health Insurance Coverage, 2009-2013 Exploratory, Ordinary Least Squares, and Geographically Weighted Regression Using GeoDa-GWR, R, and QGIS Larry Spear 4/13/2016 (Draft) A dataset consisting
Concepts and Applications of Kriging. Eric Krause
 Concepts and Applications of Kriging Eric Krause Sessions of note Tuesday ArcGIS Geostatistical Analyst - An Introduction 8:30-9:45 Room 14 A Concepts and Applications of Kriging 10:15-11:30 Room 15 A
Lecture 8. Spatial Estimation
 Lecture 8 Spatial Estimation Lecture Outline Spatial Estimation Spatial Interpolation Spatial Prediction Sampling Spatial Interpolation Methods Spatial Prediction Methods Interpolating Raster Surfaces
Using Spatial Statistics and Geostatistical Analyst as Educational Tools
 Using Spatial Statistics and Geostatistical Analyst as Educational Tools By Konrad Dramowicz Centre of Geographic Sciences Lawrencetown, Nova Scotia, Canada ESRI User Conference, San Diego, California
Lecture 5 Geostatistics
 Lecture 5 Geostatistics Lecture Outline Spatial Estimation Spatial Interpolation Spatial Prediction Sampling Spatial Interpolation Methods Spatial Prediction Methods Interpolating Raster Surfaces with
Spatial Pattern Analysis: Mapping Trends and Clusters
 Esri International User Conference San Diego, California Technical Workshops July 24, 2012 Spatial Pattern Analysis: Mapping Trends and Clusters Lauren M. Scott, PhD Lauren Rosenshein Bennett, MS Presentation
ArcGIS Pro: Analysis and Geoprocessing. Nicholas M. Giner Esri Christopher Gabris Blue Raster
 ArcGIS Pro: Analysis and Geoprocessing Nicholas M. Giner Esri Christopher Gabris Blue Raster Agenda What is Analysis and Geoprocessing? Analysis in ArcGIS Pro - 2D (Spatial xy) - 3D (Elevation - z) - 4D
Spatial Pattern Analysis: Mapping Trends and Clusters. Lauren M. Scott, PhD Lauren Rosenshein Bennett, MS
 Spatial Pattern Analysis: Mapping Trends and Clusters Lauren M. Scott, PhD Lauren Rosenshein Bennett, MS Presentation Outline Spatial statistics overview Describing spatial patterns Quantifying spatial
envision Technical Report Archaeological Prediction Maps Kapiti Coast
 envision Technical Report Archaeological Prediction Maps Kapiti Coast Elise Smith September 2012 Contents HYPOTHESIS:... 3 Technical challenges... 3 Alternative methods of analysis considered:... 3 Approach
Copyright The McGraw-Hill Companies, Inc. Permission required for reproduction or display.
 Chapter 15. SPATIAL INTERPOLATION 15.1 Elements of Spatial Interpolation 15.1.1 Control Points 15.1.2 Type of Spatial Interpolation 15.2 Global Methods 15.2.1 Trend Surface Models Box 15.1 A Worked Example
APPLICATION OF GEOGRAPHICALLY WEIGHTED REGRESSION ANALYSIS TO LAKE-SEDIMENT DATA FROM AN AREA OF THE CANADIAN SHIELD IN SASKATCHEWAN AND ALBERTA
 APPLICATION OF GEOGRAPHICALLY WEIGHTED REGRESSION ANALYSIS TO LAKE-SEDIMENT DATA FROM AN AREA OF THE CANADIAN SHIELD IN SASKATCHEWAN AND ALBERTA Nadia Yavorskaya 1, Stephen Amor 2 1 450 Bonner Av., Winnipeg,
Umeå University Sara Sjöstedt-de Luna Time series analysis and spatial statistics
 Umeå University 01-05-5 Sara Sjöstedt-de Luna Time series analysis and spatial statistics Laboration in ArcGIS Geostatistical Analyst These exercises are aiming at helping you understand ArcGIS Geostatistical
Regression Analysis. A statistical procedure used to find relations among a set of variables.
 Regression Analysis A statistical procedure used to find relations among a set of variables. Understanding relations Mapping data enables us to examine (describe) where things occur (e.g., areas where
Terms ABBR Definition
 Affect Akaike s Information Criterion AIC Affect is a verb referring to the act of influencing or causing a change in something else (not to be confused with effect) Akaike s Information Criterion (AIC)
An Introduction to Pattern Statistics
 An Introduction to Pattern Statistics Nearest Neighbors The CSR hypothesis Clark/Evans and modification Cuzick and Edwards and controls All events k function Weighted k function Comparative k functions
ENGRG Introduction to GIS
 ENGRG 59910 Introduction to GIS Michael Piasecki October 13, 2017 Lecture 06: Spatial Analysis Outline Today Concepts What is spatial interpolation Why is necessary Sample of interpolation (size and pattern)
GIST 4302/5302: Spatial Analysis and Modeling
 GIST 4302/5302: Spatial Analysis and Modeling Review Guofeng Cao www.gis.ttu.edu/starlab Department of Geosciences Texas Tech University guofeng.cao@ttu.edu Spring 2016 Course Outlines Spatial Point Pattern
A geographically weighted regression
 The Spatial Distribution of Poverty A geographically weighted regression by Introduction Problem How can we explore the spatial distribution of poverty and determine its correlates? This exercise examines
This report details analyses and methodologies used to examine and visualize the spatial and nonspatial
 Analysis Summary: Acute Myocardial Infarction and Social Determinants of Health Acute Myocardial Infarction Study Summary March 2014 Project Summary :: Purpose This report details analyses and methodologies
LINEAR REGRESSION ANALYSIS. MODULE XVI Lecture Exercises
 LINEAR REGRESSION ANALYSIS MODULE XVI Lecture - 44 Exercises Dr. Shalabh Department of Mathematics and Statistics Indian Institute of Technology Kanpur Exercise 1 The following data has been obtained on
Spatial Data Mining. Regression and Classification Techniques
 Spatial Data Mining Regression and Classification Techniques 1 Spatial Regression and Classisfication Discrete class labels (left) vs. continues quantities (right) measured at locations (2D for geographic
Concepts and Applications of Kriging. Eric Krause Konstantin Krivoruchko
 Concepts and Applications of Kriging Eric Krause Konstantin Krivoruchko Outline Introduction to interpolation Exploratory spatial data analysis (ESDA) Using the Geostatistical Wizard Validating interpolation
Statistics: A review. Why statistics?
 Statistics: A review Why statistics? What statistical concepts should we know? Why statistics? To summarize, to explore, to look for relations, to predict What kinds of data exist? Nominal, Ordinal, Interval
Gis Based Analysis of Supply and Forecasting Piped Water Demand in Nairobi
 International Journal of Engineering Science Invention ISSN (Online): 2319 6734, ISSN (Print): 2319 6726 Volume 4 Issue 2 February 2015 PP.01-11 Gis Based Analysis of Supply and Forecasting Piped Water
Why Is It There? Attribute Data Describe with statistics Analyze with hypothesis testing Spatial Data Describe with maps Analyze with spatial analysis
 6 Why Is It There? Why Is It There? Getting Started with Geographic Information Systems Chapter 6 6.1 Describing Attributes 6.2 Statistical Analysis 6.3 Spatial Description 6.4 Spatial Analysis 6.5 Searching
Evaluating sustainable transportation offers through housing price: a comparative analysis of Nantes urban and periurban/rural areas (France)
") Evaluating sustainable transportation offers through housing price: a comparative analysis of Nantes urban and periurban/rural areas (France) Julie Bulteau, UVSQ-CEARC-OVSQ Thierry Feuillet, Université
Evaluating sustainable transportation offers through housing price: a comparative analysis of Nantes urban and periurban/rural areas (France) Julie Bulteau, UVSQ-CEARC-OVSQ Thierry Feuillet, Université
Geog 469 GIS Workshop. Data Analysis
 Geog 469 GIS Workshop Data Analysis Outline 1. What kinds of need-to-know questions can be addressed using GIS data analysis? 2. What is a typology of GIS operations? 3. What kinds of operations are useful
Finding Hot Spots in ArcGIS Online: Minimizing the Subjectivity of Visual Analysis. Nicholas M. Giner Esri Parrish S.
 Finding Hot Spots in ArcGIS Online: Minimizing the Subjectivity of Visual Analysis Nicholas M. Giner Esri Parrish S. Henderson FBI Agenda The subjectivity of maps What is Hot Spot Analysis? Why do Hot
KAAF- GE_Notes GIS APPLICATIONS LECTURE 3
 GIS APPLICATIONS LECTURE 3 SPATIAL AUTOCORRELATION. First law of geography: everything is related to everything else, but near things are more related than distant things Waldo Tobler Check who is sitting
Spatial Data Analysis in Archaeology Anthropology 589b. Kriging Artifact Density Surfaces in ArcGIS
 Spatial Data Analysis in Archaeology Anthropology 589b Fraser D. Neiman University of Virginia 2.19.07 Spring 2007 Kriging Artifact Density Surfaces in ArcGIS 1. The ingredients. -A data file -- in.dbf
Spatial Regression. 1. Introduction and Review. Luc Anselin. Copyright 2017 by Luc Anselin, All Rights Reserved
 Spatial Regression 1. Introduction and Review Luc Anselin http://spatial.uchicago.edu matrix algebra basics spatial econometrics - definitions pitfalls of spatial analysis spatial autocorrelation spatial
CSISS Tools and Spatial Analysis Software
 CSISS Tools and Spatial Analysis Software June 5, 2006 Stephen A. Matthews Associate Professor of Sociology & Anthropology, Geography and Demography Director of the Geographic Information Analysis Core
ArcGIS for Geostatistical Analyst: An Introduction. Steve Lynch and Eric Krause Redlands, CA.
 ArcGIS for Geostatistical Analyst: An Introduction Steve Lynch and Eric Krause Redlands, CA. Outline - What is geostatistics? - What is Geostatistical Analyst? - Spatial autocorrelation - Geostatistical
Interpolating Raster Surfaces
 Interpolating Raster Surfaces You can use interpolation to model the surface of a feature or a phenomenon all you need are sample points, an interpolation method, and an understanding of the feature or
Soil Moisture Modeling using Geostatistical Techniques at the O Neal Ecological Reserve, Idaho
 Final Report: Forecasting Rangeland Condition with GIS in Southeastern Idaho Soil Moisture Modeling using Geostatistical Techniques at the O Neal Ecological Reserve, Idaho Jacob T. Tibbitts, Idaho State
Outline. Introduction to SpaceStat and ESTDA. ESTDA & SpaceStat. Learning Objectives. Space-Time Intelligence System. Space-Time Intelligence System
 Outline I Data Preparation Introduction to SpaceStat and ESTDA II Introduction to ESTDA and SpaceStat III Introduction to time-dynamic regression ESTDA ESTDA & SpaceStat Learning Objectives Activities
11/8/2018. Spatial Interpolation & Geostatistics. Kriging Step 1
 (Z i Z j ) 2 / 2 (Z i Zj) 2 / 2 Semivariance y 11/8/2018 Spatial Interpolation & Geostatistics Kriging Step 1 Describe spatial variation with Semivariogram Lag Distance between pairs of points Lag Mean
Single and multiple linear regression analysis
 Single and multiple linear regression analysis Marike Cockeran 2017 Introduction Outline of the session Simple linear regression analysis SPSS example of simple linear regression analysis Additional topics
Watershed Delineation
 Watershed Delineation Jessica L. Watkins, University of Georgia 2 April 2009 Updated by KC Love February 25, 2011 PURPOSE For this project, I delineated watersheds for the Coweeta synoptic sampling area
Geospatial dynamics of Northwest. fisheries in the 1990s and 2000s: environmental and trophic impacts
 Geospatial dynamics of Northwest Atlantic ti cod and crustacean fisheries in the 1990s and 2000s: environmental and trophic impacts Matthew J.S. WINDLE 1, George A. ROSE 2, Rodolphe DEVILLERS 3, and Marie-Josée
review session gov 2000 gov 2000 () review session 1 / 38
 review session 1 / 38") review session gov 2000 gov 2000 () review session 1 / 38 Overview Random Variables and Probability Univariate Statistics Bivariate Statistics Multivariate Statistics Causal Inference gov 2000 () review
review session gov 2000 gov 2000 () review session 1 / 38 Overview Random Variables and Probability Univariate Statistics Bivariate Statistics Multivariate Statistics Causal Inference gov 2000 () review
Shana K. Pascal Department of Resource Analysis, Saint Mary s University of Minnesota, Minneapolis, MN 55408
 An Analysis Using Regression Models of Urban Solitary Bee Population with Regards to Perennial Gardens Along the Lake Street Corridor in Minneapolis Minnesota Shana K. Pascal Department of Resource Analysis,
GRAD6/8104; INES 8090 Spatial Statistic Spring 2017
 Lab #5 Spatial Regression (Due Date: 04/29/2017) PURPOSES 1. Learn to conduct alternative linear regression modeling on spatial data 2. Learn to diagnose and take into account spatial autocorrelation in
Spatial Data Analysis with ArcGIS Desktop: From Basic to Advance
 Spatial Data Analysis with ArcGIS Desktop: From Basic to Advance 1. Course overview Modern environmental, energy as well as resource modeling and planning require huge amount of geographically located
Attribute Data. ArcGIS reads DBF extensions. Data in any statistical software format can be
 This hands on application is intended to introduce you to the foundational methods of spatial data analysis available in GeoDa. We will undertake an exploratory spatial data analysis, of 1,387 southern
Objectives Define spatial statistics Introduce you to some of the core spatial statistics tools available in ArcGIS 9.3 Present a variety of example a
 Introduction to Spatial Statistics Opportunities for Education Lauren M. Scott, PhD Mark V. Janikas, PhD Lauren Rosenshein Jorge Ruiz-Valdepeña 1 Objectives Define spatial statistics Introduce you to some
Concepts and Applications of Kriging
 2013 Esri International User Conference July 8 12, 2013 San Diego, California Technical Workshop Concepts and Applications of Kriging Eric Krause Konstantin Krivoruchko Outline Intro to interpolation Exploratory
Spatial Interpolation & Geostatistics
 (Z i Z j ) 2 / 2 Spatial Interpolation & Geostatistics Lag Lag Mean Distance between pairs of points 1 y Kriging Step 1 Describe spatial variation with Semivariogram (Z i Z j ) 2 / 2 Point cloud Map 3
It s a Model. Quantifying uncertainty in elevation models using kriging
 It s a Model Quantifying uncertainty in elevation models using kriging By Konstantin Krivoruchko and Kevin Butler, Esri Raster based digital elevation models (DEM) are the basis of some of the most important
LAB 3 INSTRUCTIONS SIMPLE LINEAR REGRESSION
 LAB 3 INSTRUCTIONS SIMPLE LINEAR REGRESSION In this lab you will first learn how to display the relationship between two quantitative variables with a scatterplot and also how to measure the strength of
11. Kriging. ACE 492 SA - Spatial Analysis Fall 2003
 11. Kriging ACE 492 SA - Spatial Analysis Fall 2003 c 2003 by Luc Anselin, All Rights Reserved 1 Objectives The goal of this lab is to further familiarize yourself with ESRI s Geostatistical Analyst, extending
Introduction. Part I: Quick run through of ESDA checklist on our data
 CSDE GIS Workshop Series Spatial Regression Chris Fowler csfowler@uw.edu Introduction The goal of these exercises is to give you a chance to put the concepts we have just discussed into practice. Keep
Spatial Analysis I. Spatial data analysis Spatial analysis and inference
 Spatial Analysis I Spatial data analysis Spatial analysis and inference Roadmap Outline: What is spatial analysis? Spatial Joins Step 1: Analysis of attributes Step 2: Preparing for analyses: working with
Ridge Regression. Summary. Sample StatFolio: ridge reg.sgp. STATGRAPHICS Rev. 10/1/2014
 Ridge Regression Summary... 1 Data Input... 4 Analysis Summary... 5 Analysis Options... 6 Ridge Trace... 7 Regression Coefficients... 8 Standardized Regression Coefficients... 9 Observed versus Predicted...
This lab exercise will try to answer these questions using spatial statistics in a geographic information system (GIS) context.
 context.") by Introduction Problem Do the patterns of forest fires change over time? Do forest fires occur in clusters, and do the clusters change over time? Is this information useful in fighting forest fires? This
by Introduction Problem Do the patterns of forest fires change over time? Do forest fires occur in clusters, and do the clusters change over time? Is this information useful in fighting forest fires? This
Multiple Regression Analysis
 Chapter 4 Multiple Regression Analysis The simple linear regression covered in Chapter 2 can be generalized to include more than one variable. Multiple regression analysis is an extension of the simple
GIS Semester Project Working With Water Well Data in Irion County, Texas
 GIS Semester Project Working With Water Well Data in Irion County, Texas Grant Hawkins Question for the Project Upon picking a random point in Irion county, Texas, to what depth would I have to drill a
Types of Spatial Data
 Spatial Data Types of Spatial Data Point pattern Point referenced geostatistical Block referenced Raster / lattice / grid Vector / polygon Point Pattern Data Interested in the location of points, not their
Types of spatial data. The Nature of Geographic Data. Types of spatial data. Spatial Autocorrelation. Continuous spatial data: geostatistics
 The Nature of Geographic Data Types of spatial data Continuous spatial data: geostatistics Samples may be taken at intervals, but the spatial process is continuous e.g. soil quality Discrete data Irregular:
Geog 210C Spring 2011 Lab 6. Geostatistics in ArcMap
 Geog 210C Spring 2011 Lab 6. Geostatistics in ArcMap Overview In this lab you will think critically about the functionality of spatial interpolation, improve your kriging skills, and learn how to use several
Extent of Radiological Contamination in Soil at Four Sites near the Fukushima Daiichi Power Plant, Japan (ArcGIS)
") Extent of Radiological Contamination in Soil at Four Sites near the Fukushima Daiichi Power Plant, Japan (ArcGIS) Contact: Ted Parks, AMEC Foster Wheeler, theodore.parks@amecfw.com, Alex Mikszewski, AMEC
Extent of Radiological Contamination in Soil at Four Sites near the Fukushima Daiichi Power Plant, Japan (ArcGIS) Contact: Ted Parks, AMEC Foster Wheeler, theodore.parks@amecfw.com, Alex Mikszewski, AMEC
Iris Wang.
 Chapter 10: Multicollinearity Iris Wang iris.wang@kau.se Econometric problems Multicollinearity What does it mean? A high degree of correlation amongst the explanatory variables What are its consequences?
Statistics 203: Introduction to Regression and Analysis of Variance Course review
 Statistics 203: Introduction to Regression and Analysis of Variance Course review Jonathan Taylor - p. 1/?? Today Review / overview of what we learned. - p. 2/?? General themes in regression models Specifying
SPATIAL-TEMPORAL TECHNIQUES FOR PREDICTION AND COMPRESSION OF SOIL FERTILITY DATA
 SPATIAL-TEMPORAL TECHNIQUES FOR PREDICTION AND COMPRESSION OF SOIL FERTILITY DATA D. Pokrajac Center for Information Science and Technology Temple University Philadelphia, Pennsylvania A. Lazarevic Computer
Application of the Getis-Ord Gi* statistic (Hot Spot Analysis) to seafloor organisms
 to seafloor organisms") Application of the Getis-Ord Gi* statistic (Hot Spot Analysis) to seafloor organisms Diana Watters Research Fisheries Biologist Habitat Ecology Team Santa Cruz, CA Southwest Fisheries Science Center Fisheries
Application of the Getis-Ord Gi* statistic (Hot Spot Analysis) to seafloor organisms Diana Watters Research Fisheries Biologist Habitat Ecology Team Santa Cruz, CA Southwest Fisheries Science Center Fisheries
Spatial Regression. 3. Review - OLS and 2SLS. Luc Anselin. Copyright 2017 by Luc Anselin, All Rights Reserved
 Spatial Regression 3. Review - OLS and 2SLS Luc Anselin http://spatial.uchicago.edu OLS estimation (recap) non-spatial regression diagnostics endogeneity - IV and 2SLS OLS Estimation (recap) Linear Regression
Course in Data Science
 Course in Data Science About the Course: In this course you will get an introduction to the main tools and ideas which are required for Data Scientist/Business Analyst/Data Analyst. The course gives an
Regression Analysis of 911 call frequency in Portland, OR Urban Areas in Relation to Call Center Vicinity Elyse Maurer March 13, 2015
 Regression Analysis of 911 call frequency in Portland, OR Urban Areas in Relation to Call Center Vicinity Elyse Maurer March 13, 2015 Introduction: Using the Linear Regression and Geographically Weighted
Spatial Interpolation Comparison Evaluation of spatial prediction methods
 Spatial Interpolation Comparison Evaluation of spatial prediction methods Tomislav Hengl ISRIC World Soil Information, Wageningen University Topic Geostatistics = a toolbox to generate maps from point
Report on Kriging in Interpolation
 Tabor Reedy ENVS421 3/12/15 Report on Kriging in Interpolation In this project I explored use of the geostatistical analyst extension and toolbar in the process of creating an interpolated surface through
Manual for a computer class in ML
 Manual for a computer class in ML November 3, 2015 Abstract This document describes a tour of Machine Learning (ML) techniques using tools in MATLAB. We point to the standard implementations, give example
Combining Regressive and Auto-Regressive Models for Spatial-Temporal Prediction
 Combining Regressive and Auto-Regressive Models for Spatial-Temporal Prediction Dragoljub Pokrajac DPOKRAJA@EECS.WSU.EDU Zoran Obradovic ZORAN@EECS.WSU.EDU School of Electrical Engineering and Computer
Psychology Seminar Psych 406 Dr. Jeffrey Leitzel
 Psychology Seminar Psych 406 Dr. Jeffrey Leitzel Structural Equation Modeling Topic 1: Correlation / Linear Regression Outline/Overview Correlations (r, pr, sr) Linear regression Multiple regression interpreting
Spatial Analyst. By Sumita Rai
 ArcGIS Extentions Spatial Analyst By Sumita Rai Overview What does GIS do? How does GIS work data models Extension to GIS Spatial Analyst Spatial Analyst Tasks & Tools Surface Analysis Surface Creation
GEOGRAPHICAL STATISTICS & THE GRID
 GEOGRAPHICAL STATISTICS & THE GRID Rich Harris, Chris Brunsdon and Daniel Grose (Universities of Bristol, Leicester & Lancaster) http://rose.bris.ac.uk OUTLINE About Geographically Weighted Regression
Applied Regression Modeling
 Applied Regression Modeling A Business Approach Iain Pardoe University of Oregon Charles H. Lundquist College of Business Eugene, Oregon WILEY- INTERSCIENCE A JOHN WILEY & SONS, INC., PUBLICATION CONTENTS
Working with Digital Elevation Models in ArcGIS 8.3
 Working with Digital Elevation Models in ArcGIS 8.3 The homework that you need to turn in is found at the end of this document. This lab continues your introduction to using the Spatial Analyst Extension
Experimental Design and Data Analysis for Biologists
 Experimental Design and Data Analysis for Biologists Gerry P. Quinn Monash University Michael J. Keough University of Melbourne CAMBRIDGE UNIVERSITY PRESS Contents Preface page xv I I Introduction 1 1.1
Forecasting with R A practical workshop
 Forecasting with R A practical workshop International Symposium on Forecasting 2016 19 th June 2016 Nikolaos Kourentzes nikolaos@kourentzes.com http://nikolaos.kourentzes.com Fotios Petropoulos fotpetr@gmail.com
In this exercise we will learn how to use the analysis tools in ArcGIS with vector and raster data to further examine potential building sites.
 GIS Level 2 In the Introduction to GIS workshop we filtered data and visually examined it to determine where to potentially build a new mixed use facility. In order to get a low interest loan, the building
Data Structures & Database Queries in GIS
 Data Structures & Database Queries in GIS Objective In this lab we will show you how to use ArcGIS for analysis of digital elevation models (DEM s), in relationship to Rocky Mountain bighorn sheep (Ovis
Empirical Bayesian Kriging
 Empirical Bayesian Kriging Implemented in ArcGIS Geostatistical Analyst By Konstantin Krivoruchko, Senior Research Associate, Software Development Team, Esri Obtaining reliable environmental measurements
A Second Course in Statistics: Regression Analysis
 FIFTH E D I T I 0 N A Second Course in Statistics: Regression Analysis WILLIAM MENDENHALL University of Florida TERRY SINCICH University of South Florida PRENTICE HALL Upper Saddle River, New Jersey 07458
Outline ESDA. Exploratory Spatial Data Analysis ESDA. Luc Anselin
 Exploratory Spatial Data Analysis ESDA Luc Anselin University of Illinois, Urbana-Champaign http://www.spacestat.com Outline ESDA Exploring Spatial Patterns Global Spatial Autocorrelation Local Spatial
LECTURE 15: SIMPLE LINEAR REGRESSION I
 David Youngberg BSAD 20 Montgomery College LECTURE 5: SIMPLE LINEAR REGRESSION I I. From Correlation to Regression a. Recall last class when we discussed two basic types of correlation (positive and negative).
Outline Introduction OLS Design of experiments Regression. Metamodeling. ME598/494 Lecture. Max Yi Ren
 1 / 34 Metamodeling ME598/494 Lecture Max Yi Ren Department of Mechanical Engineering, Arizona State University March 1, 2015 2 / 34 1. preliminaries 1.1 motivation 1.2 ordinary least square 1.3 information
Spatial Variation in Infant Mortality with Geographically Weighted Poisson Regression (GWPR) Approach
 Approach") Spatial Variation in Infant Mortality with Geographically Weighted Poisson Regression (GWPR) Approach Kristina Pestaria Sinaga, Manuntun Hutahaean 2, Petrus Gea 3 1, 2, 3 University of Sumatera Utara,
Spatial Variation in Infant Mortality with Geographically Weighted Poisson Regression (GWPR) Approach Kristina Pestaria Sinaga, Manuntun Hutahaean 2, Petrus Gea 3 1, 2, 3 University of Sumatera Utara,
Geo-statistical Dengue Risk Model Case Study of Lahore Dengue Outbreaks 2011
 Geo-statistical Dengue Risk Model Case Study of Lahore Dengue Outbreaks 2011 BILAL TARIQ Department of Remote Sensing & Geo-information Science Institute of Space Technology (IST) Karachi Campus, Pakistan
LECTURE 11. Introduction to Econometrics. Autocorrelation
 LECTURE 11 Introduction to Econometrics Autocorrelation November 29, 2016 1 / 24 ON PREVIOUS LECTURES We discussed the specification of a regression equation Specification consists of choosing: 1. correct
Regression Analysis and Forecasting Prof. Shalabh Department of Mathematics and Statistics Indian Institute of Technology-Kanpur
 Regression Analysis and Forecasting Prof. Shalabh Department of Mathematics and Statistics Indian Institute of Technology-Kanpur Lecture 10 Software Implementation in Simple Linear Regression Model using