Spatial Pattern Analysis: Mapping Trends and Clusters. Lauren M. Scott, PhD Lauren Rosenshein Bennett, MS
|
|
|
- Silvia Williamson
- 5 years ago
- Views:
Transcription


1 Spatial Pattern Analysis: Mapping Trends and Clusters Lauren M. Scott, PhD Lauren Rosenshein Bennett, MS


2 Presentation Outline Spatial statistics overview Describing spatial patterns Quantifying spatial patterns Mapping spatial clusters - Hot and cold spots - Spatial outliers - Similar features DEMOS Analyzing Ushahidi data Exploring regional variations in health care Multi ti-dimensional data analysis
3 What are Spatial Statistics in ArcGIS? A set of exploratory methods and techniques Specifically developed for use with geographic data - They incorporate space (area, length, proximity, orientation) directly into their mathematics They describe and model: - Spatial Distributions - Spatial Patterns - Spatial Processes - Spatial Relationships Spatial al statistics extend what the eyes and mind do intuitively to assess spatial al patterns, trends and relationships ps.


4 Why use spatial statistics? Spatial Statistics help us assess: Patterns Relationships Trends L&L Car Rental How we present our results (colors, class breaks, symbols ) can either er enhance or obscure communication. n. L&L Car Rental


5 Spatial Statistics Toolbox in ArcGIS Core functionality with ArcGIS (not an extension). Most tools delivered with their source code. Most tools available at all license levels. 5


6 Describing Spatial Data Questions - Which site is most accessible? - What is the primary wind direction in the winter months? - Where is the population center and how it is changing over time? - Which strain of the disease has the broadest spatial distribution? Which are the most spatially integrated? 6


7 Finding the center The Mean Center tool computes the average x and y coordinate, based on all features in the study area. 7

8 Measuring central tendency Mean Center - Computes average X and Y Median Center - Finds the location that minimizes Euclidean distance to all features - More robust to outliers than the Mean Center tool Central Feature - Find the feature that is most central to all other features 8


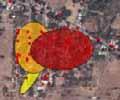

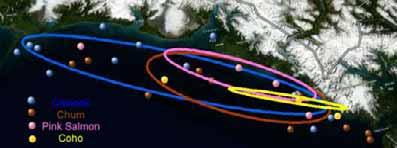
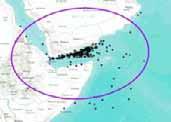
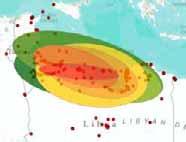
9 Distribution and Direction (Standard Deviational Ellipse) Abstracting spatial and temporal trends in a distribution of features Dengue Fever Outbreak Salmon Distributions


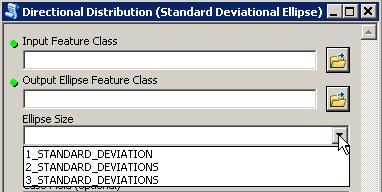

10 Ellipse size Normal distribution 99% 95% 68% 1 = 68% of features Mean + 2 = 95% of features 3 = 99% of features 10

11 Measuring segregation and integration (Standard Deviational Ellipse) 11


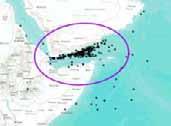
12 Ushadidi data analysis Lauren Rosenshein Bennett, MS
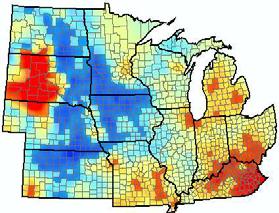
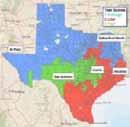
13 Quantifying Spatial Patterns Which pattern is most clustered? Hospital Readmission Rates 2010
14 Quantifying Spatial Patterns Which pattern is most clustered? Equal Interval Natural Breaks Hospital Readmission Rates 2010 Quantile


15 Quantifying Spatial Patterns You say it s clustered Compared to what? Says who?

16 Compared to what? Complete Spatial Randomness Inferential statistics start with a null hypothesis - Random distribution of features - Random distribution of values within fixed features


17 Is CSR useful?


18 How Random is That? What are the chances that we are looking at one of many possible instances of a random pattern?? Random Crime in Lincoln, Nebraska Are these just random acts? Is it just bad luck?

19 Says who? Probability theory Inferential statistics report a p-value and z-score - z-scores are standard deviations - p-values are probabilities - z-scores can be mapped to specific p-values - p-value 0.01 = z-score +/ p-value 0.05 = z-score +/ p-value 0.10 = z-score +/-1.65


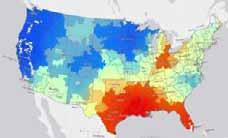
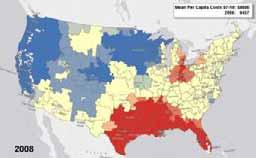
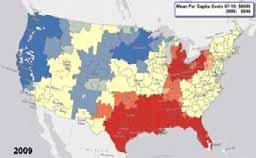
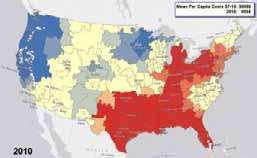
20 Quantifying spatial patterns over time Spatial Autocorrelation (Global Moran s I) Thematic maps showing relative per capita Income for New York by county, 1969 to 2002 Is the spatial gap between rich and poor increasing or dissipating?
21 Quantifying spatial patterns over time Spatial Autocorrelation (Global Moran s I)


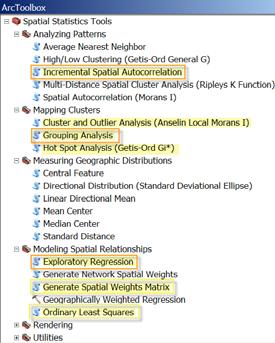
22 Incremental Spatial Autocorrelation Identifies appropriate scales for analysis - Distances where processes promoting clustering are most pronounced Helpful for tools requiring a distance or radius including: - Point Density - IDW - Hot Spot Analysis - Cluster/Outlier Analysis ¼ Mile Radius ½ Mile Radius 1 Mile Radius Data mining reduces trial and error


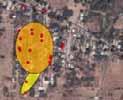
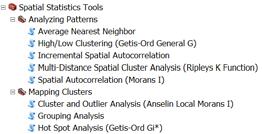
23 Mapping Spatial Clusters Mapping spatial clusters - Hot and cold spots - Spatial outliers - Similar features Where are the 911 call hot spots? Which countries face similar challenges? Which homes sold for more than expected?
24 Mapping Spatial Clusters Questions Tools Examples Where are the hot spots? Where are the cold spots? How intense is the clustering? Where are the spatial outliers? How can resources be most effectively deployed? Hot Spot Analysis Cluster and Outlier Analysis Cluster and Outlier Analysis Hot Spot Analysis Where are the sharpest boundaries between affluence and poverty? Where are biological diversity and habitat quality highest? Where do we find anomalous spending patterns in Los Angeles? Where do we see unexpectedly high rates of diabetes? Where are kitchen fires a higher-thanexpected proportion of residential fires? Which locations are farthest from the problem? Which features are most alike? What does the spatial fabric of the data look like? Hot Spot Analysis Grouping Analysis Where should evacuation sites be located? Which crimes in the database are most similar to the one just committed? Which disease incidents are likely part of the same outbreak?


25 Exploring regional variations in health care Lauren Rosenshein Bennett, MS


 High Poverty High")

26 Examining the spatial pattern of poverty in Kenya (Cluster and Outlier Analysis: Anselin Local Moran s I) High Poverty High Poverty Surrounded d by Low poverty Low Poverty

 Use the.")
27 Space-Time Cluster Analysis Defining the space-time window Create the space-time weights matrix file (.swm) Use the.swm to perform cluster analyses
28 Space-time vs Time Snapshots Time-slices can disconnect related features Space-time relationships are relative to each feature s date stamp

29 Time Snapshots


30 Analyzing Data in both Space and Time

31 Space-Time Cluster Analysis Visualization Default symbology at 10.1 is a 2D display To see the temporal patterns: - Animate the results or - Use 3D symbols in ArcGlobe or ArcScene

32 Grouping Analysis Group 1: low income, low education, high unemployment, high crime Group 2: middle values for all variables Group 3: higher income and education, lower unemployment and crime Multi-dimensional data analysis simplifies complex data


33 Multidimensional Data Analysis Lauren Rosenshein Bennett, MS The Africa vulnerability model data was kindly provided by the Robert S. Strauss Center for International Security and Law.
34 Resources for learning more - Short videos - Articles and blogs - Online documentation - Supplementary model and script tools - Hot spot, Regression, and ModelBuilder tutorials resources.arcgis.com QUESTIONS? LBennett@Esri.com LScott@Esri.com
Spatial Pattern Analysis: Mapping Trends and Clusters
 2013 Esri International User Conference July 8 12, 2013 San Diego, California Technical Workshop Spatial Pattern Analysis: Mapping Trends and Clusters Lauren Rosenshein Bennett Brett Rose Presentation
Spatial Pattern Analysis: Mapping Trends and Clusters
 Esri International User Conference San Diego, California Technical Workshops July 24, 2012 Spatial Pattern Analysis: Mapping Trends and Clusters Lauren M. Scott, PhD Lauren Rosenshein Bennett, MS Presentation
Objectives Define spatial statistics Introduce you to some of the core spatial statistics tools available in ArcGIS 9.3 Present a variety of example a
 Introduction to Spatial Statistics Opportunities for Education Lauren M. Scott, PhD Mark V. Janikas, PhD Lauren Rosenshein Jorge Ruiz-Valdepeña 1 Objectives Define spatial statistics Introduce you to some
Modeling Spatial Relationships Using Regression Analysis. Lauren M. Scott, PhD Lauren Rosenshein Bennett, MS
 Modeling Spatial Relationships Using Regression Analysis Lauren M. Scott, PhD Lauren Rosenshein Bennett, MS Workshop Overview Answering why? questions Introduce regression analysis - What it is and why
Modeling Spatial Relationships Using Regression Analysis
 Esri International User Conference San Diego, California Technical Workshops July 24, 2012 Modeling Spatial Relationships Using Regression Analysis Lauren M. Scott, PhD Lauren Rosenshein Bennett, MS Answering
GIS CONFERENCE MAKING PLACE MATTER Decoding Health Data with Spatial Statistics
 esri HEALTH AND HUMAN SERVICES GIS CONFERENCE MAKING PLACE MATTER Decoding Health Data with Spatial Statistics Flora Vale Jenora D Acosta Wait a minute Wait a minute Where is Lauren?? Wait a minute Where
Modeling Spatial Relationships using Regression Analysis
 Esri International User Conference San Diego, CA Technical Workshops July 2011 Modeling Spatial Relationships using Regression Analysis Lauren M. Scott, PhD Lauren Rosenshein, MS Mark V. Janikas, PhD Answering
Finding Hot Spots in ArcGIS Online: Minimizing the Subjectivity of Visual Analysis. Nicholas M. Giner Esri Parrish S.
 Finding Hot Spots in ArcGIS Online: Minimizing the Subjectivity of Visual Analysis Nicholas M. Giner Esri Parrish S. Henderson FBI Agenda The subjectivity of maps What is Hot Spot Analysis? Why do Hot
Finding Hot Spots in ArcGIS Online: Minimizing the Subjectivity of Visual Analysis. Nicholas M. Giner Esri Parrish S.
 Finding Hot Spots in ArcGIS Online: Minimizing the Subjectivity of Visual Analysis Nicholas M. Giner Esri Parrish S. Henderson - FBI Agenda The subjectivity of maps What is Hot Spot Analysis? What is Outlier
A GEOSTATISTICAL APPROACH TO PREDICTING A PHYSICAL VARIABLE THROUGH A CONTINUOUS SURFACE
 Katherine E. Williams University of Denver GEOG3010 Geogrpahic Information Analysis April 28, 2011 A GEOSTATISTICAL APPROACH TO PREDICTING A PHYSICAL VARIABLE THROUGH A CONTINUOUS SURFACE Overview Data
Tracey Farrigan Research Geographer USDA-Economic Research Service
 Rural Poverty Symposium Federal Reserve Bank of Atlanta December 2-3, 2013 Tracey Farrigan Research Geographer USDA-Economic Research Service Justification Increasing demand for sub-county analysis Policy
Spatial Analysis I. Spatial data analysis Spatial analysis and inference
 Spatial Analysis I Spatial data analysis Spatial analysis and inference Roadmap Outline: What is spatial analysis? Spatial Joins Step 1: Analysis of attributes Step 2: Preparing for analyses: working with
Everything is related to everything else, but near things are more related than distant things.
 SPATIAL ANALYSIS DR. TRIS ERYANDO, MA Everything is related to everything else, but near things are more related than distant things. (attributed to Tobler) WHAT IS SPATIAL DATA? 4 main types event data,
In matrix algebra notation, a linear model is written as
 DM3 Calculation of health disparity Indices Using Data Mining and the SAS Bridge to ESRI Mussie Tesfamicael, University of Louisville, Louisville, KY Abstract Socioeconomic indices are strongly believed
GIS Test Drive What a Geographic Information System Is and What it Can Do. Alison Davis-Holland
 GIS Test Drive What a Geographic Information System Is and What it Can Do Alison Davis-Holland adavisholland@gmail.com WHO AM I? Geospatial Analyst M.S. in Geographic and Cartographic Sciences Use GIS
Lecture 4. Spatial Statistics
 Lecture 4 Spatial Statistics Lecture 4 Outline Statistics in GIS Spatial Metrics Cell Statistics Neighborhood Functions Neighborhood and Zonal Statistics Mapping Density (Density surfaces) Hot Spot Analysis
ArcGIS Pro: Analysis and Geoprocessing. Nicholas M. Giner Esri Christopher Gabris Blue Raster
 ArcGIS Pro: Analysis and Geoprocessing Nicholas M. Giner Esri Christopher Gabris Blue Raster Agenda What is Analysis and Geoprocessing? Analysis in ArcGIS Pro - 2D (Spatial xy) - 3D (Elevation - z) - 4D
Mapping For Wellness: Then and Now
 Mapping For Wellness: Then and Now John Ritter, Ph.D. Geomatics Dept. Oregon Institute of Technology Klamath Falls, OR 97601 John.Ritter@oit.edu Sponsors 1 Objectives Understand how medical mapping can
Using Spatial Statistics Social Service Applications Public Safety and Public Health
 Using Spatial Statistics Social Service Applications Public Safety and Public Health Lauren Rosenshein 1 Regression analysis Regression analysis allows you to model, examine, and explore spatial relationships,
Application of the Getis-Ord Gi* statistic (Hot Spot Analysis) to seafloor organisms
 to seafloor organisms") Application of the Getis-Ord Gi* statistic (Hot Spot Analysis) to seafloor organisms Diana Watters Research Fisheries Biologist Habitat Ecology Team Santa Cruz, CA Southwest Fisheries Science Center Fisheries
Application of the Getis-Ord Gi* statistic (Hot Spot Analysis) to seafloor organisms Diana Watters Research Fisheries Biologist Habitat Ecology Team Santa Cruz, CA Southwest Fisheries Science Center Fisheries
Geovisualization. Luc Anselin. Copyright 2016 by Luc Anselin, All Rights Reserved
 Geovisualization Luc Anselin http://spatial.uchicago.edu from EDA to ESDA from mapping to geovisualization mapping basics multivariate EDA primer From EDA to ESDA Exploratory Data Analysis (EDA) reaction
Outline. Introduction to SpaceStat and ESTDA. ESTDA & SpaceStat. Learning Objectives. Space-Time Intelligence System. Space-Time Intelligence System
 Outline I Data Preparation Introduction to SpaceStat and ESTDA II Introduction to ESTDA and SpaceStat III Introduction to time-dynamic regression ESTDA ESTDA & SpaceStat Learning Objectives Activities
Introduction To Raster Based GIS Dr. Zhang GISC 1421 Fall 2016, 10/19
 Introduction To Raster Based GIS Dr. Zhang GISC 1421 Fall 2016, 10/19 Model of the course Using and making maps Navigating GIS maps Map design Working with spatial data Geoprocessing Spatial data infrastructure
Dr Arulsivanathan Naidoo Statistics South Africa 18 October 2017
 ESRI User Conference 2017 Space Time Pattern Mining Analysis of Matric Pass Rates in Cape Town Schools Dr Arulsivanathan Naidoo Statistics South Africa 18 October 2017 Choose one of the following Leadership
Implications for the Sharing Economy
 Locational Big Data and Analytics: Implications for the Sharing Economy AMCIS 2017 SIGGIS Workshop Brian N. Hilton, Ph.D. Associate Professor Director, Advanced GIS Lab Center for Information Systems and
CRP 608 Winter 10 Class presentation February 04, Senior Research Associate Kirwan Institute for the Study of Race and Ethnicity
 CRP 608 Winter 10 Class presentation February 04, 2010 SAMIR GAMBHIR SAMIR GAMBHIR Senior Research Associate Kirwan Institute for the Study of Race and Ethnicity Background Kirwan Institute Our work Using
Outline ESDA. Exploratory Spatial Data Analysis ESDA. Luc Anselin
 Exploratory Spatial Data Analysis ESDA Luc Anselin University of Illinois, Urbana-Champaign http://www.spacestat.com Outline ESDA Exploring Spatial Patterns Global Spatial Autocorrelation Local Spatial
A.1 Spatial Statistics in ArcGIS
 A.1 Spatial Statistics in ArcGIS Lauren M. Scott and Mark V. Janikas A.1.1 Introduction With over a million software users worldwide, and installations at over 5,000 universities, Environmental Systems
Spatial Analysis 1. Introduction
 Spatial Analysis 1 Introduction Geo-referenced Data (not any data) x, y coordinates (e.g., lat., long.) ------------------------------------------------------ - Table of Data: Obs. # x y Variables -------------------------------------
Spatial Analysis with ArcGIS Pro STUDENT EDITION
 Spatial Analysis with ArcGIS Pro STUDENT EDITION Copyright 2018 Esri All rights reserved. Course version 2.0. Version release date November 2018. Printed in the United States of America. The information
Lecture 1 Introduction to GIS. Dr. Zhang Spring, 2017
 Lecture 1 Introduction to GIS Dr. Zhang Spring, 2017 Topics of the course Using and making maps Navigating GIS Map design Working with spatial data Geoprocessing Spatial data infrastructure Digitizing
Cluster Analysis using SaTScan
 Cluster Analysis using SaTScan Summary 1. Statistical methods for spatial epidemiology 2. Cluster Detection What is a cluster? Few issues 3. Spatial and spatio-temporal Scan Statistic Methods Probability
Working with Temporal Data in ArcGIS
 Working with Temporal Data in ArcGIS By Aileen Buckley, Esri Research Cartographer Time is an important dimension in many types of geospatial visualizations and analyses. The temporal aspect adds when
CSISS Tools and Spatial Analysis Software
 CSISS Tools and Spatial Analysis Software June 5, 2006 Stephen A. Matthews Associate Professor of Sociology & Anthropology, Geography and Demography Director of the Geographic Information Analysis Core
Mapping and Analysis for Spatial Social Science
 Mapping and Analysis for Spatial Social Science Luc Anselin Spatial Analysis Laboratory Dept. Agricultural and Consumer Economics University of Illinois, Urbana-Champaign http://sal.agecon.uiuc.edu Outline
GeoHealth Applications Platform ESRI Health GIS Conference 2013
 GeoHealth Applications Platform ESRI Health GIS Conference 2013 Authors Thomas A. Horan, Ph.D. Professor, CISAT Director April Moreno Health GeoInformatics Ph.D. Student Brian N. Hilton, Ph.D. Clinical
Analyzing the Geospatial Rates of the Primary Care Physician Labor Supply in the Contiguous United States
 Analyzing the Geospatial Rates of the Primary Care Physician Labor Supply in the Contiguous United States By Russ Frith Advisor: Dr. Raid Amin University of W. Florida Capstone Project in Statistics April,
GIS Spatial Statistics for Public Opinion Survey Response Rates
 GIS Spatial Statistics for Public Opinion Survey Response Rates July 22, 2015 Timothy Michalowski Senior Statistical GIS Analyst Abt SRBI - New York, NY t.michalowski@srbi.com www.srbi.com Introduction
Are You Maximizing The Value Of All Your Data?
 Are You Maximizing The Value Of All Your Data? Using The SAS Bridge for ESRI With ArcGIS Business Analyst In A Retail Market Analysis SAS and ESRI: Bringing GIS Mapping and SAS Data Together Presented
Exploratory Spatial Data Analysis (ESDA)
") Exploratory Spatial Data Analysis (ESDA) VANGHR s method of ESDA follows a typical geospatial framework of selecting variables, exploring spatial patterns, and regression analysis. The primary software
Exploratory Spatial Data Analysis (ESDA) VANGHR s method of ESDA follows a typical geospatial framework of selecting variables, exploring spatial patterns, and regression analysis. The primary software
2/7/2018. Module 4. Spatial Statistics. Point Patterns: Nearest Neighbor. Spatial Statistics. Point Patterns: Nearest Neighbor
 Spatial Statistics Module 4 Geographers are very interested in studying, understanding, and quantifying the patterns we can see on maps Q: What kinds of map patterns can you think of? There are so many
ArcGIS Online Analytics. Mike Flanagan
 ArcGIS Online Analytics Mike Flanagan MFlanagan@esri.com Agenda Introduction to ArcGIS Online Spatial Analysis ArcGIS Online Spatial Analysis Workflow Demos and Examples Wrap-up Q&A ArcGIS A complete web
Demographic characteristics of the School of International Studies 9 th Grade class and their success their first semester.
 Project Tutorial 1. Topic Demographic characteristics of the School of International Studies 9 th Grade class and their success their first semester. 2. Research Question/Problem For the 9 th Grade class
Cluster Analysis using SaTScan. Patrick DeLuca, M.A. APHEO 2007 Conference, Ottawa October 16 th, 2007
 Cluster Analysis using SaTScan Patrick DeLuca, M.A. APHEO 2007 Conference, Ottawa October 16 th, 2007 Outline Clusters & Cluster Detection Spatial Scan Statistic Case Study 28 September 2007 APHEO Conference
Multidimensional Poverty in Colombia: Identifying Regional Disparities using GIS and Population Census Data (2005)
") Multidimensional Poverty in Colombia: Identifying Regional Disparities using GIS and Population Census Data (2005) Laura Estrada Sandra Liliana Moreno December 2013 Aguascalientes, Mexico Content 1. Spatial
Multidimensional Poverty in Colombia: Identifying Regional Disparities using GIS and Population Census Data (2005) Laura Estrada Sandra Liliana Moreno December 2013 Aguascalientes, Mexico Content 1. Spatial
Introduction to Spatial Analysis in ArcGIS Online. Jian Lange, Vicki Lynn Cove
 Introduction to Spatial Analysis in ArcGIS Online Jian Lange, Vicki Lynn Cove Topics Introducing ArcGIS Online Spatial Analysis ArcGIS Online Spatial Analysis Workflow Demos and examples - Using ArcGIS
Lecture 3 GIS outputs. Dr. Zhang Spring, 2017
 Lecture 3 GIS outputs Dr. Zhang Spring, 2017 Model of the course Using and making maps Navigating GIS maps Map design Working with spatial data Geoprocessing Spatial data infrastructure Digitizing File
This report details analyses and methodologies used to examine and visualize the spatial and nonspatial
 Analysis Summary: Acute Myocardial Infarction and Social Determinants of Health Acute Myocardial Infarction Study Summary March 2014 Project Summary :: Purpose This report details analyses and methodologies
DP Project Development Pvt. Ltd.
 Dear Sir/Madam, Greetings!!! Thanks for contacting DP Project Development for your training requirement. DP Project Development is leading professional training provider in GIS technologies and GIS application
GED 554 IT & GIS. Lecture 6 Exercise 5. May 10, 2013
 GED 554 IT & GIS Lecture 6 Exercise 5 May 10, 2013 Free GIS data sources ******************* Mapping numerical data & Symbolization ******************* Exercise: Making maps for presentation GIS DATA SOFTWARE
Geoprocessing Tools at ArcGIS 9.2 Desktop
 Geoprocessing Tools at ArcGIS 9.2 Desktop Analysis Tools Analysis Tools \ Extract Clip Analysis Tools \ Extract Select Analysis Tools \ Extract Split Analysis Tools \ Extract Table Select Analysis Tools
The Church Demographic Specialists
 The Church Demographic Specialists Easy-to-Use Features Map-driven, Web-based Software An Integrated Suite of Information and Query Tools Providing An Insightful Window into the Communities You Serve Key
Regression Analysis of 911 call frequency in Portland, OR Urban Areas in Relation to Call Center Vicinity Elyse Maurer March 13, 2015
 Regression Analysis of 911 call frequency in Portland, OR Urban Areas in Relation to Call Center Vicinity Elyse Maurer March 13, 2015 Introduction: Using the Linear Regression and Geographically Weighted
Concepts and Applications of Kriging
 2013 Esri International User Conference July 8 12, 2013 San Diego, California Technical Workshop Concepts and Applications of Kriging Eric Krause Konstantin Krivoruchko Outline Intro to interpolation Exploratory
Measuring community health outcomes: New approaches for public health services research
 Research Brief March 2015 Measuring community health outcomes: New approaches for public health services research P ublic Health agencies are increasingly asked to do more with less. Tough economic times
ArcGIS Pro Q&A Session. NWGIS Conference, October 11, 2017 With John Sharrard, Esri GIS Solutions Engineer
 ArcGIS Pro Q&A Session NWGIS Conference, October 11, 2017 With John Sharrard, Esri GIS Solutions Engineer jsharrard@esri.com ArcGIS Desktop The applications ArcGIS Pro ArcMap ArcCatalog ArcScene ArcGlobe
from
 8Map Generalization and Classification Our human and natural environments are complex and full of detail. Maps work by strategically reducing detail and grouping phenomena together. Driven by your intent,
Software requirements * :
 Title: Product Type: Developer: Target audience: Format: Software requirements * : Using GRACE to evaluate change in Greenland s ice sheet Part I: Download, import and map GRACE data Part II: View and
Community Health Needs Assessment through Spatial Regression Modeling
 Community Health Needs Assessment through Spatial Regression Modeling Glen D. Johnson, PhD CUNY School of Public Health glen.johnson@lehman.cuny.edu Objectives: Assess community needs with respect to particular
Lecture 3: Exploratory Spatial Data Analysis (ESDA) Prof. Eduardo A. Haddad
 Prof. Eduardo A. Haddad") Lecture 3: Exploratory Spatial Data Analysis (ESDA) Prof. Eduardo A. Haddad Key message Spatial dependence First Law of Geography (Waldo Tobler): Everything is related to everything else, but near things
Lecture 3: Exploratory Spatial Data Analysis (ESDA) Prof. Eduardo A. Haddad Key message Spatial dependence First Law of Geography (Waldo Tobler): Everything is related to everything else, but near things
GIS Analysis: Spatial Statistics for Public Health: Lauren M. Scott, PhD; Mark V. Janikas, PhD
 Some Slides to Go Along with the Demo Hot spot analysis of average age of death Section B DEMO: Mortality Data Analysis 2 Some Slides to Go Along with the Demo Do Economic Factors Alone Explain Early Death?
Crime Analyst Extension. Christine Charles
 Crime Analyst Extension Christine Charles ccharles@esricanada.com Agenda Why use Crime Analyst? Overview Tools Demo Interoperability With our old software it could take a police officer up to forty minutes
In this exercise we will learn how to use the analysis tools in ArcGIS with vector and raster data to further examine potential building sites.
 GIS Level 2 In the Introduction to GIS workshop we filtered data and visually examined it to determine where to potentially build a new mixed use facility. In order to get a low interest loan, the building
Concepts and Applications of Kriging
 Esri International User Conference San Diego, California Technical Workshops July 24, 2012 Concepts and Applications of Kriging Konstantin Krivoruchko Eric Krause Outline Intro to interpolation Exploratory
Integrating Open-Source Statistical Packages with ArcGIS
 Esri International User Conference San Diego, California Technical Workshops 7-25-12 Integrating Open-Source Statistical Packages with ArcGIS Mark V. Janikas, Ph. D. Xing Kang Outline Introduction to Spatial
SCHOOL OF ENGINEERING AND TECHNOLOGY COMPUTER LAB
 PHASE 1_6 TH SESSION ARCGIS TRAINING AT KU GIS LABS: INTRODUCTION TO GIS: EXPLORING ARCCATALOG AND ARCGIS TOOLS 6 TH SESSION REPORT: 3 RD -5 TH SEPTEMBER 2014 SCHOOL OF ENGINEERING AND TECHNOLOGY COMPUTER
Acknowledgments xiii Preface xv. GIS Tutorial 1 Introducing GIS and health applications 1. What is GIS? 2
 Acknowledgments xiii Preface xv GIS Tutorial 1 Introducing GIS and health applications 1 What is GIS? 2 Spatial data 2 Digital map infrastructure 4 Unique capabilities of GIS 5 Installing ArcView and the
1. Regressions and Regression Models. 2. Model Example. EEP/IAS Introductory Applied Econometrics Fall Erin Kelley Section Handout 1
 1. Regressions and Regression Models Simply put, economists use regression models to study the relationship between two variables. If Y and X are two variables, representing some population, we are interested
KAAF- GE_Notes GIS APPLICATIONS LECTURE 3
 GIS APPLICATIONS LECTURE 3 SPATIAL AUTOCORRELATION. First law of geography: everything is related to everything else, but near things are more related than distant things Waldo Tobler Check who is sitting
Concepts and Applications of Kriging. Eric Krause
 Concepts and Applications of Kriging Eric Krause Sessions of note Tuesday ArcGIS Geostatistical Analyst - An Introduction 8:30-9:45 Room 14 A Concepts and Applications of Kriging 10:15-11:30 Room 15 A
Agenda. What can GIS do? Use of Geographical Information Systems (GIS) in Health Care. What is Geographical Information Systems (GIS)?
 in Health Care. What is Geographical Information Systems (GIS)?") For: Presenter: Use of Geographical Information Systems (GIS) in Health Care Center for Global Development Naoru Koizumi, PhD, Assistant Professor School of Public Policy, George Mason University Agenda
For: Presenter: Use of Geographical Information Systems (GIS) in Health Care Center for Global Development Naoru Koizumi, PhD, Assistant Professor School of Public Policy, George Mason University Agenda
An Overview of Solving Spatial Problems Using ArcGIS
 Esri International User Conference San Diego, CA Technical Workshops An Overview of Solving Spatial Problems Using ArcGIS Linda Beale, Jian Lange July 12 th, 2011 Real World Example Using Spatial Analysis
Exercise on Using Census Data UCSB, July 2006
 Exercise on Using Census Data UCSB, July 2006 Purpose The purpose of this lab is to become familiar with Census Bureau data. Second, we will learn how to join tables which allows you to add data to the
Arcmap Manual Esri 10 READ ONLINE
 Arcmap Manual Esri 10 READ ONLINE Esri Store: Browsing ArcPad 10.2.2 - ArcPad is mobile field mapping and data collection software designed for GIS professionals. It includes advanced GIS and GPS capabilities
Spatial analysis of electricity demand patterns in Greece: Application of a GIS-based methodological framework
 Session ERE3.8/HS5.7: Renewable energy and environmental systems: modelling, control and management for a sustainable future Spatial analysis of electricity demand patterns in Greece: Application of a
Effective Use of Geographic Maps
 Effective Use of Geographic Maps Purpose This tool provides guidelines and tips on how to effectively use geographic maps to communicate research findings. Format This tool provides guidance on geographic
Geospatial Analysis of Job-Housing Mismatch Using ArcGIS and Python
 Geospatial Analysis of Job-Housing Mismatch Using ArcGIS and Python 2016 ESRI User Conference June 29, 2016 San Diego, CA Jung Seo, Frank Wen, Simon Choi and Tom Vo, Research & Analysis Southern California
Migrating Defense Workflows from ArcMap to ArcGIS Pro. Renee Bernstein and Jared Sellers
 Migrating Defense Workflows from ArcMap to ArcGIS Pro Renee Bernstein and Jared Sellers ArcGIS Desktop Desktop Web Device ArcMap ArcCatalog ArcScene ArcGlobe ArcGIS Pro portal Server Online Content and
Esri Maps for Office
 2013 Europe, Middle East, and Africa User Conference October 23-25, 2013 Munich, Germany Maps for Office Tony Howser Technical Product Manager Agenda Location Analytics Maps for Office 2.1.2 Road Ahead
Cartographic Adaptations of the GAIA Visualization Method for Spatial Decision Support
 International MCDA Workshop on PROMETHEE: Research and Case Studies Cartographic Adaptations of the GAIA Visualization Method for Spatial Decision Support Karim LIDOUH January 22, 2014 Context Spatial
Exploratory Spatial Data Analysis and GeoDa
 Exploratory Spatial Data Analysis and GeoDa Luc Anselin Spatial Analysis Laboratory Dept. Agricultural and Consumer Economics University of Illinois, Urbana-Champaign http://sal.agecon.uiuc.edu Outline
Introduction to ArcGIS GeoAnalytics Server. Sarah Ambrose & Noah Slocum
 Introduction to ArcGIS GeoAnalytics Server Sarah Ambrose & Noah Slocum Agenda Overview Analysis Capabilities + Demo Deployment and Configuration Questions ArcGIS GeoAnalytics Server uses the power of distributed
DIFFERENT INFLUENCES OF SOCIOECONOMIC FACTORS ON THE HUNTING AND FISHING LICENSE SALES IN COOK COUNTY, IL
 DIFFERENT INFLUENCES OF SOCIOECONOMIC FACTORS ON THE HUNTING AND FISHING LICENSE SALES IN COOK COUNTY, IL Xiaohan Zhang and Craig Miller Illinois Natural History Survey University of Illinois at Urbana
Lecture 3: Exploratory Spatial Data Analysis (ESDA) Prof. Eduardo A. Haddad
 Prof. Eduardo A. Haddad") Lecture 3: Exploratory Spatial Data Analysis (ESDA) Prof. Eduardo A. Haddad Key message Spatial dependence First Law of Geography (Waldo Tobler): Everything is related to everything else, but near things
Lecture 3: Exploratory Spatial Data Analysis (ESDA) Prof. Eduardo A. Haddad Key message Spatial dependence First Law of Geography (Waldo Tobler): Everything is related to everything else, but near things
Concepts and Applications of Kriging. Eric Krause Konstantin Krivoruchko
 Concepts and Applications of Kriging Eric Krause Konstantin Krivoruchko Outline Introduction to interpolation Exploratory spatial data analysis (ESDA) Using the Geostatistical Wizard Validating interpolation
The Implementation of Autocorrelation-Based Regioclassification in ArcMap Using ArcObjects
 140 The Implementation of Autocorrelation-Based Regioclassification in ArcMap Using ArcObjects Christoph MAYRHOFER Abstract Conventional methods for cartographic classification are often solely based on
Modeling the Ecology of Urban Inequality in Space and Time
 Modeling the Ecology of Urban Inequality in Space and Time Corina Graif PhD Candidate, Department Of Sociology Harvard University Presentation for the Workshop on Spatial and Temporal Modeling, Center
This lab exercise will try to answer these questions using spatial statistics in a geographic information system (GIS) context.
 context.") by Introduction Problem Do the patterns of forest fires change over time? Do forest fires occur in clusters, and do the clusters change over time? Is this information useful in fighting forest fires? This
by Introduction Problem Do the patterns of forest fires change over time? Do forest fires occur in clusters, and do the clusters change over time? Is this information useful in fighting forest fires? This
SPACE Workshop NSF NCGIA CSISS UCGIS SDSU. Aldstadt, Getis, Jankowski, Rey, Weeks SDSU F. Goodchild, M. Goodchild, Janelle, Rebich UCSB
 SPACE Workshop NSF NCGIA CSISS UCGIS SDSU Aldstadt, Getis, Jankowski, Rey, Weeks SDSU F. Goodchild, M. Goodchild, Janelle, Rebich UCSB August 2-8, 2004 San Diego State University Some Examples of Spatial
Combing Open-Source Programming Languages with GIS for Spatial Data Science. Maja Kalinic Master s Thesis
 Combing Open-Source Programming Languages with GIS for Spatial Data Science Maja Kalinic Master s Thesis International Master of Science in Cartography 14.09.2017 Outline Introduction and Motivation Research
USING CLUSTERING SOFTWARE FOR EXPLORING SPATIAL AND TEMPORAL PATTERNS IN NON-COMMUNICABLE DISEASES
 USING CLUSTERING SOFTWARE FOR EXPLORING SPATIAL AND TEMPORAL PATTERNS IN NON-COMMUNICABLE DISEASES Mariana Nagy "Aurel Vlaicu" University of Arad Romania Department of Mathematics and Computer Science
Michael Harrigan Office hours: Fridays 2:00-4:00pm Holden Hall
 Announcement New Teaching Assistant Michael Harrigan Office hours: Fridays 2:00-4:00pm Holden Hall 209 Email: michael.harrigan@ttu.edu Guofeng Cao, Texas Tech GIST4302/5302, Lecture 2: Review of Map Projection
Using Spatial Statistics and Geostatistical Analyst as Educational Tools
 Using Spatial Statistics and Geostatistical Analyst as Educational Tools By Konrad Dramowicz Centre of Geographic Sciences Lawrencetown, Nova Scotia, Canada ESRI User Conference, San Diego, California
Mapping the most and the least
 Mapping the most and the least Why do you make a map To communicate information at a glance To explore the data to see what patterns and retionships you can find To develop hypothesis (will be topic of
Mapping Quality of Life with Chernoff Faces. Joseph G. Spinelli and Yu Zhou
 Mapping Quality of Life with Chernoff Faces Joseph G. Spinelli and Yu Zhou Abstract Cartographers are interested in creating multivariate symbol maps as a creative expression of spatial information. In
Introducing spatial measurements and statistics
 1 Introducing spatial measurements and statistics Spatial measurements and statistics allow you to quantify patterns and relationships. That makes it easier to compare sets of features and to track changes
Medical GIS: New Uses of Mapping Technology in Public Health. Peter Hayward, PhD Department of Geography SUNY College at Oneonta
 Medical GIS: New Uses of Mapping Technology in Public Health Peter Hayward, PhD Department of Geography SUNY College at Oneonta Invited research seminar presentation at Bassett Healthcare. Cooperstown,
Why Is It There? Attribute Data Describe with statistics Analyze with hypothesis testing Spatial Data Describe with maps Analyze with spatial analysis
 6 Why Is It There? Why Is It There? Getting Started with Geographic Information Systems Chapter 6 6.1 Describing Attributes 6.2 Statistical Analysis 6.3 Spatial Description 6.4 Spatial Analysis 6.5 Searching
Spatio-Temporal Modelling of Credit Default Data
 1/20 Spatio-Temporal Modelling of Credit Default Data Sathyanarayan Anand Advisor: Prof. Robert Stine The Wharton School, University of Pennsylvania April 29, 2011 2/20 Outline 1 Background 2 Conditional
Spatial Mapping of Dengue Incidence: A Case Study in Hulu Langat District, Selangor, Malaysia
 Spatial Mapping of Dengue Incidence: A Case Study in Hulu Langat District, Selangor, Malaysia Er, A.C., Rosli, M.H., Asmahani A., Mohamad Naim M.R., Harsuzilawati M. Abstract Dengue is a mosquito-borne