This lab exercise will try to answer these questions using spatial statistics in a geographic information system (GIS) context.
|
|
|
- Gillian Fields
- 6 years ago
- Views:
Transcription
1 by Introduction Problem Do the patterns of forest fires change over time? Do forest fires occur in clusters, and do the clusters change over time? Is this information useful in fighting forest fires? This lab exercise will try to answer these questions using spatial statistics in a geographic information system (GIS) context. Location Montana, United States Time to complete the lab Three hours Prerequisites An understanding of basic spatial statistics Basic skills in the use of ArcGIS 10 Elementary understanding of the following: standard deviational ellipses (applied to point patterns), Moran's I to analyze point patterns, average nearest neighbor, and Ripley's K statistic, as well as kernel densities (to analyze clusters) Keywords: forest fire spatial patterns; kernel density estimation; Ripley's K; centroids; standard deviational ellipse; Moran's I; average nearest neighbor distance
2 Data used in this lab Forest fire history in Montana 2005, 2009 Coordinate system: State plane Montana Datum: North American Datum 1983 Projection: Lambert Conformal Conic Fire history data/metadata: Student activity In this lab exercise, you will use several spatial statistics methods to analyze forest fire patterns in Montana for two nonconsecutive years. Average and standard deviation are two of the well-known statistical measures used to explain the distribution of nonspatial data. In the spatial context, a spatial mean or centroid and standard deviational ellipse can be calculated for point pattern data. The mean center is determined by the average x-coordinate and average y-coordinate of all the points (or feature centroids) in the study area. The standard deviational ellipse yields a new feature class centered on the mean center of all features (or of all cases when a case field is provided). The attribute values for these output ellipse polygons include the lengths of the long and short axes; the angle of orientation of the ellipse; and the case field, if specified. You can specify the axis lengths as a multiple of the standard deviations. If the feature centroids are normally distributed, one standard deviation (the default value) will cover approximately 68 percent of all input feature centroids. Three standard deviations will cover approximately 99 percent of all feature centroids. Spatial autocorrelation is one of the most important descriptive spatial statistics. Spatial independence is an arrangement of incident locations in which there are no spatial relationships between any of the incidents. The intuitive concept is that the location of an incident (such as a fire or a crime) is unrelated to the location of any other incident, or that they are randomly placed with respect to each other. On the other hand, positive spatial autocorrelation is an arrangement of incident locations where the point locations are related. When events or people or facilities are clustered together, this arrangement indicates positive spatial autocorrelation, and Moran's I is typically used to quantify it. The distribution of the distance to the nearest neighbor is another useful spatial statistic in particular, the average nearest neighbor distance can be used to distinguish between clustering and dispersion. If this distance is smaller than what it would be under spatial randomness, it is interpreted as clustering. If it is larger, the distance is interpreted as dispersion. A test statistic can be constructed by taking the difference between the observed and random mean nearest neighbor 2
3 distance and standardizing by the standard error. In particular, a value less than 1 suggests clustering. The nearest neighbor index is only an indicator of first-order effects. It compares the average distance for the nearest neighbor to an expected random distance. But it does not provide any information about the second, third, or kth nearest neighbor. The nearest neighbor distance statistics are called first-order statistics, since they only consider the distance to the nearest point. Second-order distance statistics consider the complete distribution of all distances in the point pattern. Ripley's K function is a second-order statistic and is essentially a test on the cumulative distribution function of the full set of interpoint distances. This distribution can be compared to a reference distribution under complete spatial randomness. A higher proportion of shorter to random distances implies clustering, whereas a higher proportion of longer to random distances implies dispersion. Another way of visualizing the distribution of fires is through kernel density estimation. Kernel density estimation requires the use of a bandwidth. ArcMap software allows you to specify a kernel bandwidth as a fixed interval or to choose an adaptive interval. The bandwidth is a distance; hence, the point coordinates must be in appropriate units such as feet, meters, or miles rather than degrees (that is, universal transverse Mercator [UTM] coordinates as contrasted with latitude and longitude). Some experimentation with the choice of bandwidth is typically necessary. The kernel values are computed as totals, or absolute density (points per grid area, rescaled such that the sum over all grids adds up to the observed total); as points per areal units; or as relative density (for example, points per square mile), or probabilities. In this exercise, you will do all the following for both the 2005 and 2009 data: 1. Look at the overall patterns using descriptive spatial statistics called the mean center and the standard deviational ellipse. 2. Use Moran's I to quantify spatial autocorrelation and see if there is global clustering in the forest fires. 3. Use point pattern statistics, such as the nearest neighbor distance and Ripley's K, to look for clustering over distance. 4. Use kernel density maps to search for possible locations of clustering based on various bandwidths. 5. Compare the results for the two years to see if there are any differences. Prepare your workspace To begin, create a workspace to keep all data for this lab. 1 Create a FireHistory folder under the MyDocuments folder. 2 Create a Data folder under the FireHistory folder. Do not use spaces in your file and folder names, because some of the spatial analysis functions in ArcGIS require that the path names do not have spaces in them. 3
4 Collect and process data Download, extract, and process data from the Montana website at 1 Extract the fire_history_r1_1985_2009 geodatabase in the ZIP file you downloaded to your data workspace using file extraction software (for example, you could name it MyDocuments\FireHistory\). It is important to view data before moving on to the analysis. 2 Launch ArcCatalog. 3 Examine the geodatabase in the Data folder. 4 Convert the forest fires (polygon shapes) to points for the years 2005 and In ArcToolbox, expand Data Management Tools» Features and then double-click the Feature to Point tool. You should create two point shapefiles and name them appropriately, for example, fire_points_2005.shp and fire_points_2009.shp. Note that you will need ArcGIS for Desktop Advanced for this tool to work. Alternatively, use the data supplied with this lab exercise. EXAMINE OVERALL PATTERNS IN FOREST FIRES ANALYZE 1 Launch ArcMap. 2 Add the point shapefiles for forest fires in 2005 and 2009 to your map document. 3 Open the attribute tables for both datasets. Notice that the spatial distribution of forest fires in 2005 is different from that of In ArcToolbox, expand Spatial Statistics Tools» Measuring Geographic Distributions and then double-click Directional Distribution (Standard Deviational Ellipse). 4
5 5 Use the shapefile for point locations of forest fires in 2005 as the input feature class. Input the parameters for output and the ellipse size as shown in the image below: The output will automatically be added to the map document. 6 Repeat step 5 for the 2009 data. 7 In ArcToolbox, expand Spatial Statistics Tools» Measuring Geographic Distributions and then double-click Mean Center. 5

6 8 Input the variables as shown in the screen capture below. The resultant point feature, showing the mean center for forest fires in 2005, will be added to your map document. Repeat this for the 2009 data. 6

7 VISUALIZE Map 1 shows the directional ellipses for the 2005 and 2009 forest fire patterns. Note that the map uses different colors for the two years to distinguish the patterns visually. It also includes state boundaries for the United States. Also note that each fire location can be labeled for specific location names. Context is very important in discussing relative locations with planners or policy makers. Map 1: Forest fires standard deviational ellipses Question 1: Were there any locations that had forest fires in both years? If so, where? Question 2: Did the mean center change from 2005 to 2009? If so, where did it move, and why is this interesting? Question 3: Did the standard deviational ellipses change from 2005 to 2009? Explain what this means about the changes in the spatial patterns of distribution of forest fires over the two years. CHECK FOR CLUSTERING ANALYZE 1 In ArcToolbox, expand Spatial Statistics Tools» Analyzing Patterns and then double-click Spatial Autocorrelation (Morans I). 7

8 2 Use forest fires for 2005 as the input feature class. Use COST as the input field. Make sure that the Generate Report (optional) check box is checked. Note that in the previous section, you looked at the relative location of the fires without weighting by cost of the fire. You might want to repeat the previous section with COST as the weight field and compare the resultant ellipses and centroids. You can view the results in ArcMap by going to the Menu bar and clicking Geoprocessing» Results or using an.html file that is automatically generated and can be opened in any HTML reader of your choice, such as Firefox or Internet Explorer. The.html file will be saved to your ArcGIS default directory (for example, Libraries\Documents\ArcGIS\). 8
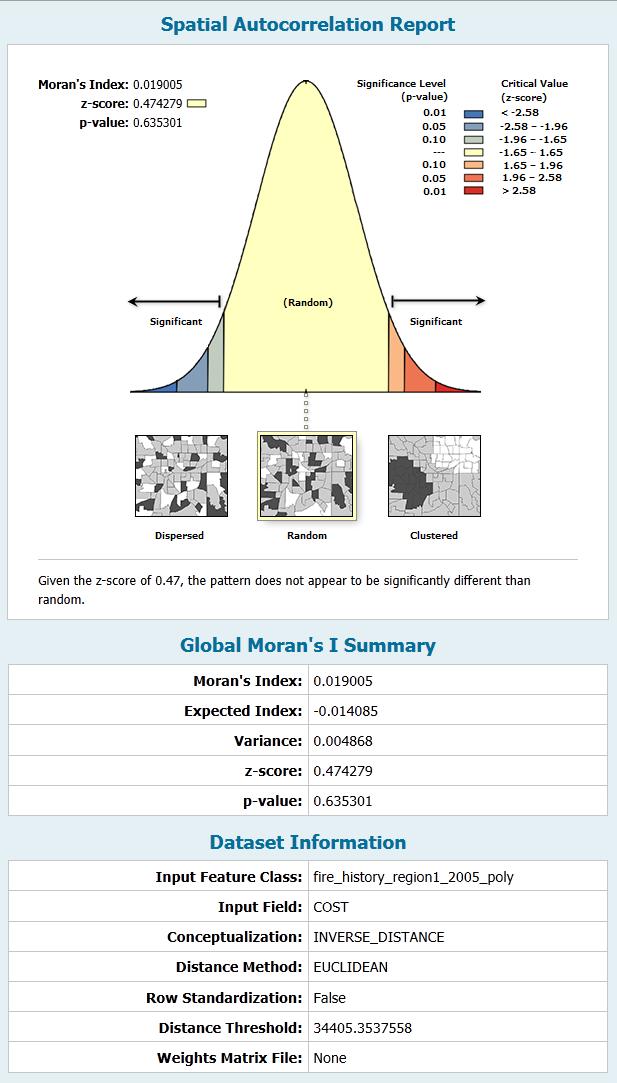
9 9

10 The results suggest that, globally, the fires were not clustered based on the cost of mitigation in Repeat steps 1 and 2 for the 2009 data. Question 4: What does this indicate about the clustering of the cost of fighting forest fires in 2005 and 2009? 4 In ArcToolbox, expand Spatial Statistics Tools» Analyzing Patterns and then double-click Average Nearest Neighbor. Use the shapefile for forest fires in 2005 as the input feature class and other parameters as shown in the screen capture that follows. Note that the results are not weighted by cost. Also note that the results are visible in the Results window as before and as an.html file. 10

11 5 Repeat step 4 for
, double-click Multi- Distance Spatial Cluster Analysis (Ripleys K Function).")
12 Question 5: What do the nearest neighbor distances indicate about the distribution of forest fires in 2005 and 2009? 6 In the same ArcToolbox location (Spatial Statistics Tools» Analyzing Patterns), double-click Multi- Distance Spatial Cluster Analysis (Ripleys K Function). Use the forest fires in 2005 shapefile as the input feature class. Output the table to your results folder. See the screen capture that follows for the other parameters. Be sure to select 99_PERMUTATIONS for the confidence envelope and select the Display Results Graphically (optional) check box; do not use a weight field. Note that the results are also saved in a.dbf file that you can open in any spreadsheet or statistical software to create your own graphs. 12
13 See the graphic below for the results from 2005 and compare it to the graphic shown in the preceding Ripley's K function screen capture. Note that the observed pattern is more dispersed than expected at all the distances that were plotted. 7 Repeat step 6 for Question 6: What do the results suggest? At what distance does the pattern appear to be clustered, if at all? What are the differences between the results in 2005 and 2009? Note that kernel density estimation only works with lines or points. 8 Make sure the Spatial Analyst extension has been activated (you can do this by going to the Menu bar and clicking Customize» Extensions» Spatial Analyst). 13

14 9 In ArcToolbox, expand Spatial Analyst Tools» Density, and then double-click Kernel Density. Use the point shapefile for forest fires as the input point features. Also, identify the name of the output density raster of fires as fire05cost1km. Enter the other parameters as shown in the screen capture below. Make sure you select COST as the population field, 500 as the output cell size, and as the search radius. 10 Repeat step 9 for other bandwidths (search radii). Then examine the data output by changing the symbology and classification. Try at least three to four search radii, varying between 5,000 and 20,000 meters. Also, try to generate kernel density with and without weighting by cost as the population field. 11 Repeat steps 9 and 10 for the 2009 data. 12 Add these rasters to your ArcMap document. Compare the densities for 2005 and 2009 side by side with the same search radius (bandwidth) and population field values. Change the legends so that they have the same legend classification breakpoints. Question 7: What do the results suggest? Where do the clusters occur in 2005 versus 2009? How does weighting by cost affect the patterns observed? 14
 of 10 kilometers.")

15 VISUALIZE This image shows kernel density for forest fires in 2005 weighted by cost with a bandwidth (search radius) of 10 kilometers. Submit your work Submit answers to questions 1 7 along with relevant screen captures. Describe how these maps and statistics could inform forest fire management policy. 15
16 Credits Data Data used in this activity courtesy of U.S. Forest Service. 16
17 Instructor resources Additional information This is a useful exercise to introduce basic spatial statistics and point pattern analysis to students who have had a first course in GIS and are interested in more advanced applications. It might be useful to ask students to think about this for other similar spatial point patterns in crime or pollution, for example. You could end with discussions on the theoretical implications of varying the kernel density bandwidths and what might be relevant to different kinds of applications (homicides, assaults, hazardous spills, etc). Note that all these operations could be done using CrimeStat 3.0 or later, which is publicly available at The results from the analysis in CrimeStat require GIS software that can read shapefiles. Answers to questions Question 1: Were there any locations that had forest fires in both years? If so, where? Answer: Cedar Creek had fires in both years. Question 2: Did the mean center change from 2005 to 2009? If so, where did it move, and why is this interesting? Answer: Yes, the mean center changed and moved in a northern direction. This is interesting because it means that the most expensive forest fires in 2009 tended to be concentrated closer to the northern parts of the region. Also note that the mean center was in Idaho in 2005, but in 2009 it was in Montana. Question 3: Did the standard deviational ellipses change from 2005 to 2009? Explain what this means about the changes in the spatial patterns of distribution of forest fires over the two years. Answer: Yes, the ellipses change in both the spread and direction. The spread of the most expensive forest fires in 2005 was concentrated closer to the mean center and tended to be in a northeastern southwestern direction. In 2009, the spread was wider and in a southeastern northwestern direction from the mean center. Again, note that the bulk of the first standard deviational ellipse in 2009 was in Montana, whereas it was more equally spread across Idaho and Montana in

18 Question 4: What does this indicate about the clustering of the cost of fighting forest fires in 2005 and 2009? Answer: The more expensive fires in 2009 were in Montana, were less clustered, and covered a larger part of the region than they did in This suggests that the cost of fighting fires was less locally concentrated in Question 5: What do the nearest neighbor distances indicate about the distribution of forest fires in 2005 and 2009? Answer: The nearest neighbor index is expressed as the ratio of the observed mean distance to the expected mean distance. If the index is less than 1, the pattern exhibits clustering; if the index is greater than 1, the trend is toward dispersion or competition. In this case, both patterns show clustering, although the value for 2005 is higher than for 2009, which suggests tighter clustering of the forest fire locations in Note that this measure is not weighted by cost as in the case of the mean center and standard ellipses. Question 6: What do the results suggest? At what distance does the pattern appear to be clustered, if at all? What are the differences between the results in 2005 and 2009? Answer: Compare both graphs to this picture: 18

19 2005 In 2005, the graph lies above the expected Ripley's K, suggesting a highly clustered pattern. The K values, however, lie outside the confidence envelopes, so you cannot be sure that this pattern of clustering is significant In 2009, the pattern is clustered until 250 km, but again, this is not significant. Thus, based on Ripley's K, there is no significant clustering in either year. 19
20 Question 7: What do the results suggest? Where do the clusters occur in 2005 versus 2009? How does weighting by cost affect the patterns observed? Answer: This will depend on the student's choice of bandwidth and should be assessed accordingly. The main intent of this question is for the student to be able to point out that the density of forest fires will vary depending on the choice of bandwidth and whether weighting by cost was used. Appropriate bandwidth for various phenomena should be discussed in class to prepare the students. For example, the appropriate bandwidth for forest fire density may depend on the types of species in the forest, rainfall in that particular year, and local microclimatic conditions favorable to forest fires. References and further reading Anselin, Luc Point Pattern Analysis Using CrimeStat. Urbana Champaign: University of Illinois. (accessed November 2011). Baddeley, Adrian Using R for Spatial Pattern Analysis. Australia: CSIRO. (accessed November 2011). Dixon, Philip M Ripley s K Function. In Encyclopedia of Environmetrics 3: Chicester, UK: Wiley. Esri. "Multi-Distance Spatial Cluster Analysis (Ripley's K Function)." ArcGIS Resource Center. 0.htm Fotheringham, A. Stewart, Chris Brunsdon, and Martin Charlton Quantitative Geography: Perspectives on spatial data analysis. (London: Sage Publications. Levine, Ned CrimeStat: A Spatial Statistics Program for the Analysis of Crime Incident Locations. Houston, TX: Ned Levine & Associates. O'Sullivan, David, and David Unwin Geographical Information Analysis. (Hoboken, NJ: Wiley & Sons. Print ISBN: Online ISBN:
Welcome to NR502 GIS Applications in Natural Resources. You can take this course for 1 or 2 credits. There is also an option for 3 credits.
 Welcome to NR502 GIS Applications in Natural Resources. You can take this course for 1 or 2 credits. There is also an option for 3 credits. The 1st credit consists of a series of readings, demonstration,
How might you use visibility to map an ancient civilization's political landscape?
 Analyzing Ancient Political Power and Urbanization Patterns by Introduction Problem How might you use visibility to map an ancient civilization's political landscape? The Yoruba civilization, one of the
(THIS IS AN OPTIONAL BUT WORTHWHILE EXERCISE)
") PART 2: Analysis in ArcGIS (THIS IS AN OPTIONAL BUT WORTHWHILE EXERCISE) Step 1: Start ArcCatalog and open a geodatabase If you have a shortcut icon for ArcCatalog on your desktop, double-click it to start
PART 2: Analysis in ArcGIS (THIS IS AN OPTIONAL BUT WORTHWHILE EXERCISE) Step 1: Start ArcCatalog and open a geodatabase If you have a shortcut icon for ArcCatalog on your desktop, double-click it to start
Delineation of Watersheds
 Delineation of Watersheds Adirondack Park, New York by Introduction Problem Watershed boundaries are increasingly being used in land and water management, separating the direction of water flow such that
In this exercise we will learn how to use the analysis tools in ArcGIS with vector and raster data to further examine potential building sites.
 GIS Level 2 In the Introduction to GIS workshop we filtered data and visually examined it to determine where to potentially build a new mixed use facility. In order to get a low interest loan, the building
The Geodatabase Working with Spatial Analyst. Calculating Elevation and Slope Values for Forested Roads, Streams, and Stands.
 GIS LAB 7 The Geodatabase Working with Spatial Analyst. Calculating Elevation and Slope Values for Forested Roads, Streams, and Stands. This lab will ask you to work with the Spatial Analyst extension.
GEOREFERENCING, PROJECTIONS Part I. PRESENTING DATA Part II
 Week 7 GEOREFERENCING, PROJECTIONS Part I PRESENTING DATA Part II topics of the week Georeferencing Coordinate systems Map Projections ArcMap and Projections Geo-referencing Geo-referencing is the process
Lecture 2. A Review: Geographic Information Systems & ArcGIS Basics
 Lecture 2 A Review: Geographic Information Systems & ArcGIS Basics GIS Overview Types of Maps Symbolization & Classification Map Elements GIS Data Models Coordinate Systems and Projections Scale Geodatabases
Exercise 3: GIS data on the World Wide Web
 Exercise 3: GIS data on the World Wide Web These web sites are a few examples of sites that are serving free GIS data. Many other sites exist. Search in Google or other search engine to find GIS data for
Hot Spot / Kernel Density Analysis: Calculating the Change in Uganda Conflict Zones
 Hot Spot / Kernel Density Analysis: Calculating the Change in Uganda Conflict Zones Created by Patrick Florance; revised by Carolyn Talmadge, Madeline Wrable, Kyle Monahan on March 28, 2017 OVERVIEW...
Handling Raster Data for Hydrologic Applications
 Handling Raster Data for Hydrologic Applications Prepared by Venkatesh Merwade Lyles School of Civil Engineering, Purdue University vmerwade@purdue.edu January 2018 Objective The objective of this exercise
Learning ArcGIS: Introduction to ArcCatalog 10.1
 Learning ArcGIS: Introduction to ArcCatalog 10.1 Estimated Time: 1 Hour Information systems help us to manage what we know by making it easier to organize, access, manipulate, and apply knowledge to the
Geographical Information Systems
 Geographical Information Systems Geographical Information Systems (GIS) is a relatively new technology that is now prominent in the ecological sciences. This tool allows users to map geographic features
Task 1: Open ArcMap and activate the Spatial Analyst extension.
 Exercise 10 Spatial Analyst The following steps describe the general process that you will follow to complete the exercise. Specific steps will be provided later in the step-by-step instructions component
Data Structures & Database Queries in GIS
 Data Structures & Database Queries in GIS Objective In this lab we will show you how to use ArcGIS for analysis of digital elevation models (DEM s), in relationship to Rocky Mountain bighorn sheep (Ovis
Using the Stock Hydrology Tools in ArcGIS
 Using the Stock Hydrology Tools in ArcGIS This lab exercise contains a homework assignment, detailed at the bottom, which is due Wednesday, October 6th. Several hydrology tools are part of the basic ArcGIS
NR402 GIS Applications in Natural Resources
 NR402 GIS Applications in Natural Resources Lesson 1 Introduction to GIS Eva Strand, University of Idaho Map of the Pacific Northwest from http://www.or.blm.gov/gis/ Welcome to NR402 GIS Applications in
A geographically weighted regression
 The Spatial Distribution of Poverty A geographically weighted regression by Introduction Problem How can we explore the spatial distribution of poverty and determine its correlates? This exercise examines
Assessing Point Groundwater Contamination Potential
 Assessing Point Groundwater Contamination Potential Florida caves by Introduction Problem Where might caves in Florida be susceptible to potential point contamination sources such as hazardous material
How to Create Stream Networks using DEM and TauDEM
 How to Create Stream Networks using DEM and TauDEM Take note: These procedures do not describe all steps. Knowledge of ArcGIS, DEMs, and TauDEM is required. TauDEM software ( http://hydrology.neng.usu.edu/taudem/
Spatial Analysis I. Spatial data analysis Spatial analysis and inference
 Spatial Analysis I Spatial data analysis Spatial analysis and inference Roadmap Outline: What is spatial analysis? Spatial Joins Step 1: Analysis of attributes Step 2: Preparing for analyses: working with
Hot Spot / Point Density Analysis: Kernel Smoothing
 Hot Spot / Point Density Analysis: Kernel Smoothing Revised by Carolyn Talmadge on January 15, 2016 SETTING UP... 1 ENABLING THE SPATIAL ANALYST EXTENSION... 1 SET UP YOUR ANALYSIS OPTIONS IN ENVIRONMENTS...
The data for this lab comes from McDonald Forest. We will be working with spatial data representing the forest boundary, streams, roads, and stands.
 GIS LAB 6 Using the Projection Utility. Converting Data to Oregon s Approved Lambert Projection. Determining Stand Size, Stand Types, Road Length, and Stream Length. This lab will ask you to work with
Name Date Class. Figure 1. The Google Earth Pro drop-down menu.
 GIS Student Walk-Through Worksheet Procedure 1. Import historical tornado and hurricane data into Google Earth Pro by following these steps: A. In the Google Earth Pro drop-down menu > click File > Import
Working with Digital Elevation Models in ArcGIS 8.3
 Working with Digital Elevation Models in ArcGIS 8.3 The homework that you need to turn in is found at the end of this document. This lab continues your introduction to using the Spatial Analyst Extension
Fundamentals of ArcGIS Desktop Pathway
 Fundamentals of ArcGIS Desktop Pathway Table of Contents ArcGIS Desktop I: Getting Started with GIS 3 ArcGIS Desktop II: Tools and Functionality 5 Understanding Geographic Data 8 Understanding Map Projections
GIS CONCEPTS ARCGIS METHODS AND. 3 rd Edition, July David M. Theobald, Ph.D. Warner College of Natural Resources Colorado State University
 GIS CONCEPTS AND ARCGIS METHODS 3 rd Edition, July 2007 David M. Theobald, Ph.D. Warner College of Natural Resources Colorado State University Copyright Copyright 2007 by David M. Theobald. All rights
Diamonds on the soles of scholarship?
 Educational Performance and Family Income Diamonds on the soles of scholarship? by Introduction Problem Two young girls entering elementary school in Boston aspire to be doctors. Both come from twoparent,
Gridded Ambient Air Pollutant Concentrations for Southern California, User Notes authored by Beau MacDonald, 11/28/2017
 Gridded Ambient Air Pollutant Concentrations for Southern California, 1995-2014 User Notes authored by Beau, 11/28/2017 METADATA: Each raster file contains data for one pollutant (NO2, O3, PM2.5, and PM10)
Task 1: Start ArcMap and add the county boundary data from your downloaded dataset to the data frame.
 Exercise 6 Coordinate Systems and Map Projections The following steps describe the general process that you will follow to complete the exercise. Specific steps will be provided later in the step-by-step
Gridded Traffic Density Estimates for Southern
 Gridded Traffic Density Estimates for Southern California, 1995-2014 User Notes authored by Beau, 11/28/2017 METADATA: Each raster file contains Traffic Density data for one year (1995, 2000, 2005, 2010,
Tutorial 8 Raster Data Analysis
 Objectives Tutorial 8 Raster Data Analysis This tutorial is designed to introduce you to a basic set of raster-based analyses including: 1. Displaying Digital Elevation Model (DEM) 2. Slope calculations
Exercise 2: Working with Vector Data in ArcGIS 9.3
 Exercise 2: Working with Vector Data in ArcGIS 9.3 There are several tools in ArcGIS 9.3 used for GIS operations on vector data. In this exercise we will use: Analysis Tools in ArcToolbox Overlay Analysis
GIS Software. Evolution of GIS Software
 GIS Software The geoprocessing engines of GIS Major functions Collect, store, mange, query, analyze and present Key terms Program collections of instructions to manipulate data Package integrated collection
Modeling Incident Density with Contours in ArcGIS Pro
 Modeling Incident Density with Contours in ArcGIS Pro By Mike Price, Entrada/San Juan, Inc. What you will need ArcGIS Pro 1.4 license or later ArcGIS Spatial Analyst license ArcGIS Online for organizational
INTRODUCTION TO ARCGIS Version 10.*
 Week 3 INTRODUCTION TO ARCGIS Version 10.* topics of the week Overview of ArcGIS Using ArcCatalog Overview of ArcGIS Desktop ArcGIS Overview Scalable desktop applications ArcView ArcEditor ArcInfo ArcGIS
ISU GIS CENTER S ARCSDE USER'S GUIDE AND DATA CATALOG
 ISU GIS CENTER S ARCSDE USER'S GUIDE AND DATA CATALOG 2 TABLE OF CONTENTS 1) INTRODUCTION TO ARCSDE............. 3 2) CONNECTING TO ARCSDE.............. 5 3) ARCSDE LAYERS...................... 9 4) LAYER
Lecture 1 Introduction to GIS. Dr. Zhang Spring, 2017
 Lecture 1 Introduction to GIS Dr. Zhang Spring, 2017 Topics of the course Using and making maps Navigating GIS Map design Working with spatial data Geoprocessing Spatial data infrastructure Digitizing
Introduction to Coastal GIS
 Introduction to Coastal GIS Event was held on Tues, 1/8/13 - Thurs, 1/10/13 Time: 9:00 am to 5:00 pm Location: Roger Williams University, Bristol, RI Audience: The intended audiences for this course are
2. GETTING STARTED WITH GIS
 2. GETTING STARTED WITH GIS What are geographic information systems and what are they used for? ArcGIS: ArcMap, ArcCatalog and ArcToolbox Vector data vs. raster data vs. attribute tables Polygons, polylines,
CSISS Tools and Spatial Analysis Software
 CSISS Tools and Spatial Analysis Software June 5, 2006 Stephen A. Matthews Associate Professor of Sociology & Anthropology, Geography and Demography Director of the Geographic Information Analysis Core
GIS in Management Planning. Lab 2 Coordinate Systems and Map Projections
 GIS in Management Planning Lab 2 Coordinate Systems and Map Projections Tomislav Sapic GIS Technologist Faculty of Natural Resources Management Lakehead University ArcGIS ArcToolbox Projections Functions
Lab 7: Cell, Neighborhood, and Zonal Statistics
 Lab 7: Cell, Neighborhood, and Zonal Statistics Exercise 1: Use the Cell Statistics function to detect change In this exercise, you will use the Spatial Analyst Cell Statistics function to compare the
SCHOOL OF ENGINEERING AND TECHNOLOGY COMPUTER LAB
 PHASE 1_6 TH SESSION ARCGIS TRAINING AT KU GIS LABS: INTRODUCTION TO GIS: EXPLORING ARCCATALOG AND ARCGIS TOOLS 6 TH SESSION REPORT: 3 RD -5 TH SEPTEMBER 2014 SCHOOL OF ENGINEERING AND TECHNOLOGY COMPUTER
DEMs Downloading and projecting and using Digital Elevation Models (DEM)
") DEMs Downloading and projecting and using Digital Elevation Models (DEM) Introduction In this exercise, you will work with Digital Elevation Models (DEM). You will download a DEM in geographic coordinates
DEMs Downloading and projecting and using Digital Elevation Models (DEM) Introduction In this exercise, you will work with Digital Elevation Models (DEM). You will download a DEM in geographic coordinates
SIE 509 Principles of GIS Exercise 5 An Introduction to Spatial Analysis
 SIE 509 Principles of GIS Exercise 5 An Introduction to Spatial Analysis Due: Oct. 31, 2017 Total Points: 50 Introduction: The Governor of Maine is asking communities to look at regionalization for major
Watershed Delineation
 Watershed Delineation Jessica L. Watkins, University of Georgia 2 April 2009 Updated by KC Love February 25, 2011 PURPOSE For this project, I delineated watersheds for the Coweeta synoptic sampling area
UNIT 4: USING ArcGIS. Instructor: Emmanuel K. Appiah-Adjei (PhD) Department of Geological Engineering KNUST, Kumasi
 Department of Geological Engineering KNUST, Kumasi") UNIT 4: USING ArcGIS Instructor: Emmanuel K. Appiah-Adjei (PhD) Department of Geological Engineering KNUST, Kumasi Getting to Know ArcGIS ArcGIS is an integrated collection of GIS software products ArcGIS
UNIT 4: USING ArcGIS Instructor: Emmanuel K. Appiah-Adjei (PhD) Department of Geological Engineering KNUST, Kumasi Getting to Know ArcGIS ArcGIS is an integrated collection of GIS software products ArcGIS
Your work from these three exercises will be due Thursday, March 2 at class time.
 GEO231_week5_2012 GEO231, February 23, 2012 Today s class will consist of three separate parts: 1) Introduction to working with a compass 2) Continued work with spreadsheets 3) Introduction to surfer software
Environmental Systems Research Institute
 Introduction to ArcGIS ESRI Environmental Systems Research Institute Redlands, California 2 ESRI GIS Development Arc/Info (coverage model) Versions 1-7 from 1980 1999 Arc Macro Language (AML) ArcView (shapefile
Vector Analysis: Farm Land Suitability Analysis in Groton, MA
 Vector Analysis: Farm Land Suitability Analysis in Groton, MA Written by Adrienne Goldsberry, revised by Carolyn Talmadge 10/9/2018 Introduction In this assignment, you will help to identify potentially
v WMS Tutorials GIS Module Importing, displaying, and converting shapefiles Required Components Time minutes
 v. 11.0 WMS 11.0 Tutorial Importing, displaying, and converting shapefiles Objectives This tutorial demonstrates how to import GIS data, visualize it, and convert it into WMS coverage data that could be
Introduction to ArcGIS 10.2
 Introduction to ArcGIS 10.2 Francisco Olivera, Ph.D., P.E. Srikanth Koka Lauren Walker Aishwarya Vijaykumar Keri Clary Department of Civil Engineering April 21, 2014 Contents Brief Overview of ArcGIS 10.2...
Outline. Chapter 1. A history of products. What is ArcGIS? What is GIS? Some GIS applications Introducing the ArcGIS products How does GIS work?
 Outline Chapter 1 Introducing ArcGIS What is GIS? Some GIS applications Introducing the ArcGIS products How does GIS work? Basic data formats The ArcCatalog interface 1-1 1-2 A history of products Arc/Info
Part 1: GIS Data from the Web: Downloading and Projecting Digital Elevation Models (DEM) and BTS Road data
 and BTS Road data") Field Geology I Hometown GIS, Part 1 October 03, 2005 Lab Exercise 2.1 Part 1: GIS Data from the Web: Downloading and Projecting Digital Elevation Models (DEM) and BTS Road data 1. Introduction a. GIS
Field Geology I Hometown GIS, Part 1 October 03, 2005 Lab Exercise 2.1 Part 1: GIS Data from the Web: Downloading and Projecting Digital Elevation Models (DEM) and BTS Road data 1. Introduction a. GIS
Exploratory Spatial Data Analysis (ESDA)
") Exploratory Spatial Data Analysis (ESDA) VANGHR s method of ESDA follows a typical geospatial framework of selecting variables, exploring spatial patterns, and regression analysis. The primary software
Exploratory Spatial Data Analysis (ESDA) VANGHR s method of ESDA follows a typical geospatial framework of selecting variables, exploring spatial patterns, and regression analysis. The primary software
GIS CONCEPTS ARCGIS METHODS AND. 2 nd Edition, July David M. Theobald, Ph.D. Natural Resource Ecology Laboratory Colorado State University
 GIS CONCEPTS AND ARCGIS METHODS 2 nd Edition, July 2005 David M. Theobald, Ph.D. Natural Resource Ecology Laboratory Colorado State University Copyright Copyright 2005 by David M. Theobald. All rights
GEOG 487 Lesson 7: Step-by-Step Activity
 GEOG 487 Lesson 7: Step-by-Step Activity Part I: Review the Relevant Data Layers and Organize the Map Document In Part I, we will review the data and organize the map document for analysis. 1. Unzip the
ARCGIS TRAINING AT KU GIS LABS: INTRODUCTION TO GIS: EXPLORING ARCCATALOG AND ARCGIS TOOLS
 PHASE 1_4 th SESSION ARCGIS TRAINING AT KU GIS LABS: INTRODUCTION TO GIS: EXPLORING ARCCATALOG AND ARCGIS TOOLS 4 th SESSION REPORT: 30 TH JUNE - 2 ND JULY SCHOOL OF ENVIRONMENTAL STUDIES COMPUTER LAB
HEC-HMS Lab 2 Using Thiessen Polygon and Inverse Distance Weighting
 HEC-HMS Lab 2 Using Thiessen Polygon and Inverse Distance Weighting Created by Venkatesh Merwade (vmerwade@purdue.edu) Learning outcomes The objective of this lab is to learn how to input data from multiple
Exercie 5 Preparing GIS data for simulation with FARSITE REM407 GIS Applications in Fire Ecology and Management
 Exercie 5 Preparing GIS data for simulation with FARSITE REM407 GIS Applications in Fire Ecology and Management Assignment: Make maps of the Fuelmodel layer and the clipped Canopy cover layer and submit
Lecture 3 GIS outputs. Dr. Zhang Spring, 2017
 Lecture 3 GIS outputs Dr. Zhang Spring, 2017 Model of the course Using and making maps Navigating GIS maps Map design Working with spatial data Geoprocessing Spatial data infrastructure Digitizing File
11. Kriging. ACE 492 SA - Spatial Analysis Fall 2003
 11. Kriging ACE 492 SA - Spatial Analysis Fall 2003 c 2003 by Luc Anselin, All Rights Reserved 1 Objectives The goal of this lab is to further familiarize yourself with ESRI s Geostatistical Analyst, extending
Introduction To Raster Based GIS Dr. Zhang GISC 1421 Fall 2016, 10/19
 Introduction To Raster Based GIS Dr. Zhang GISC 1421 Fall 2016, 10/19 Model of the course Using and making maps Navigating GIS maps Map design Working with spatial data Geoprocessing Spatial data infrastructure
Global Atmospheric Circulation Patterns Analyzing TRMM data Background Objectives: Overview of Tasks must read Turn in Step 1.
 Global Atmospheric Circulation Patterns Analyzing TRMM data Eugenio Arima arima@hws.edu Hobart and William Smith Colleges Department of Environmental Studies Background: Have you ever wondered why rainforests
Exercise 2: Working with Vector Data in ArcGIS 9.3
 Exercise 2: Working with Vector Data in ArcGIS 9.3 There are several tools in ArcGIS 9.3 used for GIS operations on vector data. In this exercise we will use: Analysis Tools in ArcToolbox Overlay Analysis
Lecture 2. Introduction to ESRI s ArcGIS Desktop and ArcMap
 Lecture 2 Introduction to ESRI s ArcGIS Desktop and ArcMap Outline ESRI What is ArcGIS? ArcGIS Desktop ArcMap Overview Views Layers Attribute Tables Help! Scale Tips and Tricks ESRI Environmental Systems
Laboratory Exercise X Most Dangerous Places to Live in the United States Based on Natural Disasters
 Brigham Young University BYU ScholarsArchive Engineering Applications of GIS - Laboratory Exercises Civil and Environmental Engineering 2016 Laboratory Exercise X Most Dangerous Places to Live in the United
Creating Faulted Geologic Surfaces with ArcGIS
 What You Will Need ArcGIS 10.2 for Desktop (Basic, Standard, or Advanced license level) ArcGIS Geostatistical Analyst extension ArcGIS Spatial Analyst extension Sample dataset downloaded from esri.com/arcuser
Watershed Analysis of the Blue Ridge Mountains in Northwestern Virginia
 Watershed Analysis of the Blue Ridge Mountains in Northwestern Virginia Mason Fredericks December 6, 2018 Purpose The Blue Ridge Mountain range is one of the most popular mountain ranges in the United
Using a GIS to Calculate Area of Occupancy. Part 1: Creating a Shapefile Grid
 Using a GIS to Calculate Area of Occupancy Part 1: Creating a Shapefile Grid By Ryan Elliott California Natural Diversity Database, A NatureServe network program December 2008 This document describes the
Creating Watersheds from a DEM
 Creating Watersheds from a DEM These instructions enable you to create watersheds of specified area using a good quality Digital Elevation Model (DEM) in ArcGIS 8.1. The modeling is performed in ArcMap
Geography 281 Map Making with GIS Project Eight: Comparing Map Projections
 Geography 281 Map Making with GIS Project Eight: Comparing Map Projections In this activity, you will do a series of projection comparisons using maps at different scales and geographic extents. In this
ARCGIS TRAINING AT KU GIS LABS: INTRODUCTION TO GIS: EXPLORING ARCCATALOG AND ARCGIS TOOLS
 PHASE 1_3 rd SESSION ARCGIS TRAINING AT KU GIS LABS: INTRODUCTION TO GIS: EXPLORING ARCCATALOG AND ARCGIS TOOLS 3 rd SESSION REPORT: 25 TH -27 TH JUNE 2014 SCHOOL OF ENVIRONMENTAL STUDIES COMPUTER LAB
Intro to GIS In Review
 Intro to GIS In Review GIS Analysis Winter 2016 GIS A quarter in review Geographic data types Acquiring GIS data Projections / Coordinate systems Working with attribute tables Data classification Map design
COURSE SCHEDULE, GRADING, and READINGS
 COURSE SCHEDULE, GRADING, and READINGS Note: All academic classes will be held in the GIS lab at Royal Thimphu College. These dates are listed here. Other days will involve travel or days off, and the
CE 365K Exercise 1: GIS Basemap for Design Project Spring 2014 Hydraulic Engineering Design
 CE 365K Exercise 1: GIS Basemap for Design Project Spring 2014 Hydraulic Engineering Design The purpose of this exercise is for you to construct a basemap in ArcGIS for your design project. You may execute
Geog 210C Spring 2011 Lab 6. Geostatistics in ArcMap
 Geog 210C Spring 2011 Lab 6. Geostatistics in ArcMap Overview In this lab you will think critically about the functionality of spatial interpolation, improve your kriging skills, and learn how to use several
Exercise 6: Using Burn Severity Data to Model Erosion Risk
 Exercise 6: Using Burn Severity Data to Model Erosion Risk Document Updated: November 2009 Software Versions: ERDAS Imagine 9.3 and ArcGIS 9.3, Microsoft Office 2007 Introduction A common use of burn severity
Geographic Systems and Analysis
 Geographic Systems and Analysis New York University Robert F. Wagner Graduate School of Public Service Instructor Stephanie Rosoff Contact: stephanie.rosoff@nyu.edu Office hours: Mondays by appointment
Overlay Analysis II: Using Zonal and Extract Tools to Transfer Raster Values in ArcMap
 Overlay Analysis II: Using Zonal and Extract Tools to Transfer Raster Values in ArcMap Created by Patrick Florance and Jonathan Gale, Edited by Catherine Ressijac on March 26, 2018 If you have raster data
Spatial Data Analysis in Archaeology Anthropology 589b. Kriging Artifact Density Surfaces in ArcGIS
 Spatial Data Analysis in Archaeology Anthropology 589b Fraser D. Neiman University of Virginia 2.19.07 Spring 2007 Kriging Artifact Density Surfaces in ArcGIS 1. The ingredients. -A data file -- in.dbf
GEG 5810 Geographic Information Systems I
 Eastern Illinois University NEW COURSE PROPOSAL CGS Agenda Item: 08-01 Proposal Effective Date: Fall 2008 GEG 5810 Geographic Information Systems I Please check one: X New course Revised course PART I:
Acknowledgments xiii Preface xv. GIS Tutorial 1 Introducing GIS and health applications 1. What is GIS? 2
 Acknowledgments xiii Preface xv GIS Tutorial 1 Introducing GIS and health applications 1 What is GIS? 2 Spatial data 2 Digital map infrastructure 4 Unique capabilities of GIS 5 Installing ArcView and the
Geo 327G Semester Project. Landslide Suitability Assessment of Olympic National Park, WA. Fall Shane Lewis
 Geo 327G Semester Project Landslide Suitability Assessment of Olympic National Park, WA Fall 2011 Shane Lewis 1 I. Problem Landslides cause millions of dollars of damage nationally every year, and are
Week 8 Cookbook: Review and Reflection
 : Review and Reflection Week 8 Overview 8.1) Review and Reflection 8.2) Making Intelligent Maps: The map sheet as a blank canvas 8.3) Making Intelligent Maps: Base layers and analysis layers 8.4) ArcGIS
GIS Workshop UCLS_Fall Forum 2014 Sowmya Selvarajan, PhD TABLE OF CONTENTS
 TABLE OF CONTENTS TITLE PAGE NO. 1. ArcGIS Basics I 2 a. Open and Save a Map Document 2 b. Work with Map Layers 2 c. Navigate in a Map Document 4 d. Measure Distances 4 2. ArcGIS Basics II 5 a. Work with
ArcMap - EXPLORING THE DATABASE Part I. SPATIAL DATA FORMATS Part II
 Week 5 ArcMap - EXPLORING THE DATABASE Part I SPATIAL DATA FORMATS Part II topics of the week Exploring the Database More on the Table of Contents Exploration tools Identify, Find, Measure, Map tips, Hyperlink,
ch02.pdf chap2.pdf chap02.pdf
 Introduction to Geographic Information Systems 8th Edition Karl Solutions Manual Full Download: http://testbanklive.com/download/introduction-to-geographic-information-systems-8th-edition-karl-solutions-manu
Exercise 6: Working with Raster Data in ArcGIS 9.3
 Exercise 6: Working with Raster Data in ArcGIS 9.3 Why Spatial Analyst? Grid query Grid algebra Grid statistics Summary by zone Proximity mapping Reclassification Histograms Surface analysis Slope, aspect,
Lab 5 - Introduction to the Geodatabase
 Lab 5 - Introduction to the Geodatabase 1. Design Process GIS is becoming an increasingly accessible and important tool for land managers. In this exercise you will begin creating a Personal Geodatabase
Calculating Conflict Density and Change over Time in Uganda using Vector Techniques
 Calculating Conflict Density and Change over Time in Uganda using Vector Techniques Created by Patrick Florance and Kyle Monahan; revised by Patrick Florance April 2, 2018. OVERVIEW... 1 SET UP... 1 SET
Displaying Latitude & Longitude Data (XY Data) in ArcGIS
 in ArcGIS") Displaying Latitude & Longitude Data (XY Data) in ArcGIS Created by Barbara Parmenter and updated on 2/15/2018 If you have a table of data that has longitude and latitude, or XY coordinates, you can view
Displaying Latitude & Longitude Data (XY Data) in ArcGIS Created by Barbara Parmenter and updated on 2/15/2018 If you have a table of data that has longitude and latitude, or XY coordinates, you can view
Georeferencing the Lackawanna Synclinorium using GIS
 Georeferencing the Lackawanna Synclinorium using GIS Conservation Services, LLC 2/20/2010 Contact: Philip Pass 570.510.1758 Rick Marquardt 570-335-7525 Managing Partners: Conservation Services LLC Author:
Esri EADA10. ArcGIS Desktop Associate. Download Full Version :
 Esri EADA10 ArcGIS Desktop Associate Download Full Version : http://killexams.com/pass4sure/exam-detail/eada10 Question: 85 Which format is appropriate for exporting map documents that require vector layers
The CrimeStat Program: Characteristics, Use, and Audience
 The CrimeStat Program: Characteristics, Use, and Audience Ned Levine, PhD Ned Levine & Associates and Houston-Galveston Area Council Houston, TX In the paper and presentation, I will discuss the CrimeStat
Measuring earthquake-generated surface offsets from high-resolution digital topography
 Measuring earthquake-generated surface offsets from high-resolution digital topography July 19, 2011 David E. Haddad david.e.haddad@asu.edu Active Tectonics, Quantitative Structural Geology, and Geomorphology
GIS Boot Camp for Education June th, 2011 Day 1. Instructor: Sabah Jabbouri Phone: (253) x 4854 Office: TC 136
 x 4854 Office: TC 136") GIS Boot Camp for Education June 27-30 th, 2011 Day 1 Instructor: Sabah Jabbouri Phone: (253) 833-9111 x 4854 Office: TC 136 Email: sjabbouri@greenriver.edu http://www.instruction.greenriver.edu/gis/ Summer
GIS Boot Camp for Education June 27-30 th, 2011 Day 1 Instructor: Sabah Jabbouri Phone: (253) 833-9111 x 4854 Office: TC 136 Email: sjabbouri@greenriver.edu http://www.instruction.greenriver.edu/gis/ Summer
Applied Cartography and Introduction to GIS GEOG 2017 EL. Lecture-1 Chapters 1 and 2
 Applied Cartography and Introduction to GIS GEOG 2017 EL Lecture-1 Chapters 1 and 2 What is GIS? A Geographic Information System (GIS) is a computer system for capturing, storing, querying, analyzing and
IDENTIFYING THE TYPE OF COORDINATE SYSTEM FOR DATA USING ARCMAP
 CHAPTER 1 IDENTIFYING THE TYPE OF COORDINATE SYSTEM FOR DATA USING ARCMAP I got a parcel shapefile from the county, but it doesn t line up with my other data in ArcMap. My boss told me to make a map using