Cartographic Adaptations of the GAIA Visualization Method for Spatial Decision Support
|
|
|
- Lawrence Fitzgerald
- 5 years ago
- Views:
Transcription


1 International MCDA Workshop on PROMETHEE: Research and Case Studies Cartographic Adaptations of the GAIA Visualization Method for Spatial Decision Support Karim LIDOUH January 22, 2014
2 Context Spatial decision problems are multi-criteria problems Tackle existing situations Several stakeholders Need to take several aspects into account: Multiple criteria Multiple viewpoints PhD thesis presented recently on the integration of MCDA in GIS In this work we focus on spatially referenced problems and their visualization Karim LIDOUH 2
3 Data exploration Get an understanding of our problem Visualization will be a key factor GAIA visualization method Other uses than those proposed in the GAIA plane? Positions of the alternatives Positions of the criteria Karim LIDOUH 3
 Environmental Performance Index (EPI) Karim")
4 Examples of spatially referenced problems Human Development Index (HDI) Environmental Performance Index (EPI) Karim LIDOUH 4
5 Illustrative case 1 Human Development Index in European countries Life expectancy at birth (in years) Adult literacy rate (in %) Combined gross enrolment ratio in education (in %) GDP per capita (in purchasing power parity US$) Karim LIDOUH 5
6 Illustrative case 1 Human Development Index in European countries (GAIA: δ = 85%) Karim LIDOUH 6
7 Illustrative case 2 Environmental Performance Index in European countries Environmental Burden of Disease Air Pollution (Effects on Humans) Water (Effects on Humans) Air Pollution (Effects on Ecosystem) Water (Effects on Ecosystem) Biodiversity and Habitat Forestry Fisheries Agriculture Climate Change Karim LIDOUH 7
8 Illustrative cases Environmental Performance Index in Euro. countries (GAIA: δ = 47%) Karim LIDOUH 8
9 Evaluation of the loss of data Evaluation of the amount of information preserved for each alternative: Delta of the GAIA plane: δ = Single alternative: n 2 n 2 i=1 u i + i=1 v i n q 2 i=1 j=1 φ j a i δ = λ 1 + λ 2 = or k j=1 λ j n i=1 n i=1 δ ai = u i 2 + v i 2 q j=1 φ j a i (u i 2 + v i 2 ) q j=1 2 φ j a i 2 n = δ ai i=1 Karim LIDOUH 9
 Karim")
10 Analysis of graphical devices Bertin (1983) Properties of graphical representations on maps (size, shape, orientation, colour ) Karim LIDOUH 10
: Karim LIDOUH")
11 Basics of information visualization Mackinlay s ranking of graphical devices (1986): Karim LIDOUH 11
12 Construction of glyphs Glyph: Marker or symbol used to visually represent a piece of data Karim LIDOUH 12
13 First tool: Decision clocks Construction of the glyphs using the GAIA plane: Karim LIDOUH 13

14 First tool: Decision clocks Human Development Index in European countries 14

15 First tool: Decision clocks Environmental Performance Index in European countries 15
16 Quality of the results Decision clocks: Intuition regarding proximity to the objective Quick way to identify sets of alternatives based on net flows Bad for comparing alternatives Less precise than GAIA projection Lidouh, K., De Smet, Y. and Zimanyi, E. (2009) GAIA Map : A Tool for Visual Ranking Analysis in Spatial Multicriteria Problems, In Proc. of 13th International Conference on Information Visualisation, IV 2009, pp , Barcelona, Spain. IEEE Computer Society Press. Karim LIDOUH 16

17 Second tool: Colored circles Construction of the glyphs using the GAIA plane: Karim LIDOUH 17
18 Second tool: Colored circles Human Development Index in European countries 18

19 Second tool: Colored circles Environmental Performance Index in European countries 19
20 Quality of the results Colored circles: More precise conclusions drawn Identification of profiles Clusters of similar countries Link between spatial proximity and profile similarity Karim LIDOUH 20
21 Implementation Demo application with the illustrative cases Interactive interface in Javascript Pre-computed results Available online: Used to illustrate the results of the associated paper: Lidouh, K., De Smet, Y., and Zimanyi, E. (2011) An Adaptation of the GAIA Visualization Method for Cartography : Using the HSV color system for the representation and comparison of multicriteria profiles, In Proc. of Symposium Series in Computational Intelligence (SSCI 2011). IEEE Computer Society Press. Karim LIDOUH 21
22 Visualization outside of spatial context The GAIA plane is a very rich representation Positions of alternatives Positions of criteria Loss of information A few ideas of how other representations can be improved Karim LIDOUH 22
23 Representation of a dataset Karim LIDOUH 23

24 Representation of a dataset Karim LIDOUH 24
25 GAIA plane Karim LIDOUH 25


26 Reordering of criteria and alternatives Karim LIDOUH 26
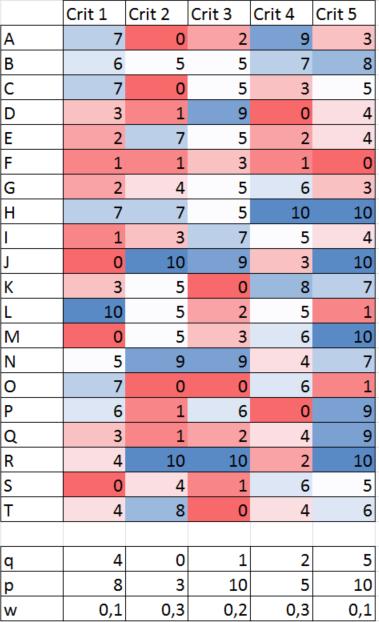
27 Effect on parallel coordinates 7 best alternatives: Crit 1 Crit 2 Crit 3 Crit 4 Crit 5 7 best alternatives (reordered criteria): Crit 3 Crit 5 Crit 2 Crit 4 Crit 1 Karim LIDOUH 27
28 Effect on spider/radar charts 5 worst alternatives: 10 Crit 1 Crit 5 5 Crit worst alternatives (reordered criteria): Crit 4 10 Crit 3 Crit 3 Crit 1 5 Crit 5 0 Crit 4 Crit 2 Karim LIDOUH 28
29 Conclusion Focus on spatial representations using glyphs Results Multi-criteria profiles Many other possibilities: New glyphs Other graphs Information visualization techniques and studies can help Karim LIDOUH 29
30 Thank you. Karim LIDOUH 30
Jean-François GUAY PhD candidate in Environmental sciences, UQAM. Jean-Philippe WAAUB Geography department, GEIGER, GERAD, UQAM
 Jean-François GUAY PhD candidate in Environmental sciences, UQAM Jean-Philippe WAAUB Geography department, GEIGER, GERAD, UQAM 2 nd International MCDA workshop on PROMÉTHÉÉ: research and case studies,
Cartography Visualization Of Spatial Data 3rd Edition By Kraak Menno Jan Ormeling Fj 2009 Paperback
 Cartography Visualization Of Spatial Data 3rd Edition By Kraak Menno Jan Ormeling Fj 2009 Paperback We have made it easy for you to find a PDF Ebooks without any digging. And by having access to our ebooks
Sustainable development an overview; Part 2
 Sustainable development an overview; Part 2 Magdalena Svanström, Professor, Chemical Environmental Science, Chalmers University of Technology Complexity, goals and metrics Content: Human well-beeing within
Integration of Multi-Criteria Tools in Geographical Information Systems
 Integration of Multi-Criteria Tools in Geographical Information Systems Karim LIDOUH Thèse présentée en vue de l obtention du grade de Docteur en Sciences de l Ingénieur Computer and Decision Engineering
GED 554 IT & GIS. Lecture 6 Exercise 5. May 10, 2013
 GED 554 IT & GIS Lecture 6 Exercise 5 May 10, 2013 Free GIS data sources ******************* Mapping numerical data & Symbolization ******************* Exercise: Making maps for presentation GIS DATA SOFTWARE
Introduction to Development. Indicators and Models
 Introduction to Development Indicators and Models First World vs. Third World Refers to economic development Diversity and complexity of economy High per capita income Developed during the Cold War First
Contents. Interactive Mapping as a Decision Support Tool. Map use: From communication to visualization. The role of maps in GIS
 Contents Interactive Mapping as a Decision Support Tool Claus Rinner Assistant Professor Department of Geography University of Toronto otru gis workshop rinner(a)geog.utoronto.ca 1 The role of maps in
Spatial Pattern Analysis: Mapping Trends and Clusters
 2013 Esri International User Conference July 8 12, 2013 San Diego, California Technical Workshop Spatial Pattern Analysis: Mapping Trends and Clusters Lauren Rosenshein Bennett Brett Rose Presentation
STAGE 2 GEOGRAPHY: Natural environments
 STAGE 2 GEOGRAPHY: Natural environments Focus area: The Earth s environment Different environments Significance of environments Key inquiry questions How does the environment support the lives of people
Lecture 3 GIS outputs. Dr. Zhang Spring, 2017
 Lecture 3 GIS outputs Dr. Zhang Spring, 2017 Model of the course Using and making maps Navigating GIS maps Map design Working with spatial data Geoprocessing Spatial data infrastructure Digitizing File
GIS Visualization Support to the C4.5 Classification Algorithm of KDD
 GIS Visualization Support to the C4.5 Classification Algorithm of KDD Gennady L. Andrienko and Natalia V. Andrienko GMD - German National Research Center for Information Technology Schloss Birlinghoven,
2017 ESRI CANADA GIS SCHOLARSHIP REPORT CURRENT POLLUTION PROBLEMS IN THE OCEANS
 MAY 31, 2017 2017 ESRI CANADA GIS SCHOLARSHIP REPORT CURRENT POLLUTION PROBLEMS IN THE OCEANS HASSAAN RAFIQUE BACHELOR OF APPLIED TECHNOLOGY GEOGRAPHIC INFORMATION SYSTEMS SOUTHERN ALBERTA INSTITUTE OF
World Geography. WG.1.1 Explain Earth s grid system and be able to locate places using degrees of latitude and longitude.
 Standard 1: The World in Spatial Terms Students will use maps, globes, atlases, and grid-referenced technologies, such as remote sensing, Geographic Information Systems (GIS), and Global Positioning Systems
Laboratory on Geoinformatics and Cartography
 Research on usability testing and cognitive issues of cartographic visualizations in the context of different groups of users Milan Konečný Čeněk Šašinka, Zbyněk Štěrba Masaryk University, Brno, CZ 19.
Green Space Services for Local Monitoring
 Green Space Services for Local Monitoring Aratos Group V3.0 2016/08 Value added services for the society using space and satellite technologies Aratos Group 2 One of the first European downstream value
The Importance of Spatial Literacy
 The Importance of Spatial Literacy Dr. Michael Phoenix GIS Education Consultant Taiwan, 2009 What is Spatial Literacy? Spatial Literacy is the ability to be able to include the spatial dimension in our
Application of Geographic Information Systems for Government School Sites Selection
 Rs. 3000,00 Application of Geographic Information Systems for Government School Sites Selection by K. D. Nethsiri Jayaweera M.Sc. Library - USJP 1111111111111111 210975 2014 210873 Application of Geographic
Unit 6: Development and Industrialization. Day 1: What is development?
 Unit 6: Development and Industrialization Day 1: What is development? What is Development? The process of improving the material conditions of people through the diffusion of knowledge and technology More
Geographical Information System (GIS) Prof. A. K. Gosain
 Prof. A. K. Gosain") Geographical Information System (GIS) Prof. A. K. Gosain gosain@civil.iitd.ernet.in Definition of GIS GIS - Geographic Information System or a particular information system applied to geographical data
Geographical Information System (GIS) Prof. A. K. Gosain gosain@civil.iitd.ernet.in Definition of GIS GIS - Geographic Information System or a particular information system applied to geographical data
European Topic Centre on Land Urban and Soil Systems. Green Infrastructure at EEA
 Green Infrastructure at EEA A SPATIAL APPROACH TO MAPPING GI Stefan Kleeschulte, ETC ULS GI and territorial cohesion 2011 first EEA report on Green Infrastructure Underlining the need to develop tools
Compact guides GISCO. Geographic information system of the Commission
 Compact guides GISCO Geographic information system of the Commission What is GISCO? GISCO, the Geographic Information System of the COmmission, is a permanent service of Eurostat that fulfils the requirements
Assessing the Regional Vulnerability of Large Scale Mining in Ghana: An Application of Multi Criteria Analysis
 Assessing the Regional Vulnerability of Large Scale Mining in Ghana: An Application of Multi Criteria Analysis Mukesh Subedee, GISDE 14 Arun Poojary, ES&P 13 Clark University April 29, 2013 Ghana: A case
INDIANA ACADEMIC STANDARDS FOR SOCIAL STUDIES, WORLD GEOGRAPHY. PAGE(S) WHERE TAUGHT (If submission is not a book, cite appropriate location(s))
 WHERE TAUGHT (If submission is not a book, cite appropriate location(s))") Prentice Hall: The Cultural Landscape, An Introduction to Human Geography 2002 Indiana Academic Standards for Social Studies, World Geography (Grades 9-12) STANDARD 1: THE WORLD IN SPATIAL TERMS Students
Prentice Hall: The Cultural Landscape, An Introduction to Human Geography 2002 Indiana Academic Standards for Social Studies, World Geography (Grades 9-12) STANDARD 1: THE WORLD IN SPATIAL TERMS Students
Switching to AQA from Edexcel: Draft Geography AS and A-level (teaching from September 2016)
") Switching to AQA from Edexcel: Draft Geography AS and A-level (teaching from September 2016) If you are thinking of switching from OCR to AQA (from September 2016), this resource is an easy reference guide.
Switching to AQA from Edexcel: Draft Geography AS and A-level (teaching from September 2016) If you are thinking of switching from OCR to AQA (from September 2016), this resource is an easy reference guide.
ADDING METADATA TO MAPS AND STYLED LAYERS TO IMPROVE MAP EFFICIENCY
 ADDING METADATA TO MAPS AND STYLED LAYERS TO IMPROVE MAP EFFICIENCY B. Bucher, S. Mustière, L. Jolivet, J. Renard IGN-COGIT, Saint Mandé, France Introduction Standard APIs to visualise geodata on information
INTELLIGENT GENERALISATION OF URBAN ROAD NETWORKS. Alistair Edwardes and William Mackaness
 INTELLIGENT GENERALISATION OF URBAN ROAD NETWORKS Alistair Edwardes and William Mackaness Department of Geography, University of Edinburgh, Drummond Street, EDINBURGH EH8 9XP, Scotland, U.K. Tel. 0131
Objectives Define spatial statistics Introduce you to some of the core spatial statistics tools available in ArcGIS 9.3 Present a variety of example a
 Introduction to Spatial Statistics Opportunities for Education Lauren M. Scott, PhD Mark V. Janikas, PhD Lauren Rosenshein Jorge Ruiz-Valdepeña 1 Objectives Define spatial statistics Introduce you to some
Spatial Pattern Analysis: Mapping Trends and Clusters. Lauren M. Scott, PhD Lauren Rosenshein Bennett, MS
 Spatial Pattern Analysis: Mapping Trends and Clusters Lauren M. Scott, PhD Lauren Rosenshein Bennett, MS Presentation Outline Spatial statistics overview Describing spatial patterns Quantifying spatial
North Dakota Academic Content Standards Science Grade: 7 - Adopted: 2006
 Main Criteria: North Dakota Academic Content Standards Secondary Criteria: Subjects: Science, Social Studies Grade: 7 Correlation Options: Show Correlated North Dakota Academic Content Standards Science
Eurostat regional yearbook using statistical maps and graphs to tell a story. Teodóra Brandmüller and Åsa Önnerfors, Eurostat
 Eurostat regional yearbook 2015 - using statistical maps and graphs to tell a story Teodóra Brandmüller and Åsa Önnerfors, Eurostat Gross domestic product (GDP) at current market prices per inhabitant
North-South Gap Mapping Assignment Country Classification / Statistical Analysis
 North-South Gap Mapping Assignment Country Classification / Statistical Analysis Due Date: (Total Value: 55 points) Name: Date: Learning Outcomes: By successfully completing this assignment, you will be
The Web of Life arxiv:submit/ [q-bio.pe] 11 Mar 2014
![The Web of Life arxiv:submit/ [q-bio.pe] 11 Mar 2014](/thumbs/93/113869982.jpg "The Web of Life arxiv:submit/ [q-bio.pe] 11 Mar 2014") The Web of Life arxiv:submit/0930921 [q-bio.pe] 11 Mar 2014 Miguel A. Fortuna, Raúl Ortega, and Jordi Bascompte Integrative Ecology Group Estación Biológica de Doñana (EBD-CSIC) Seville, Spain To whom
The Web of Life arxiv:submit/0930921 [q-bio.pe] 11 Mar 2014 Miguel A. Fortuna, Raúl Ortega, and Jordi Bascompte Integrative Ecology Group Estación Biológica de Doñana (EBD-CSIC) Seville, Spain To whom
Exploring Visualization of Geospatial Ontologies Using Cesium
 Exploring Visualization of Geospatial Ontologies Using Cesium Abhishek V. Potnis, Surya S. Durbha Centre of Studies in Resources Engineering, Indian Institue of Technology Bombay, India abhishekvpotnis@iitb.ac.in,
Spatial Pattern Analysis: Mapping Trends and Clusters
 Esri International User Conference San Diego, California Technical Workshops July 24, 2012 Spatial Pattern Analysis: Mapping Trends and Clusters Lauren M. Scott, PhD Lauren Rosenshein Bennett, MS Presentation
INTRODUCTION TO GIS. Dr. Ori Gudes
 INTRODUCTION TO GIS Dr. Ori Gudes Outline of the Presentation What is GIS? What s the rational for using GIS, and how GIS can be used to solve problems? Explore a GIS map and get information about map
A PROCESS TO DESIGN CREATIVE LEGENDS ON-DEMAND
 A PROCESS TO DESIGN CREATIVE LEGENDS ON-DEMAND Sidonie Christophe, Anne Ruas Laboratoire COGIT Institut Géographique National, 2/4 avenue Pasteur 94165 Saint-Mandé cedex http://recherche.ign.fr/labos/cogit/
Assessment and valuation of Ecosystem Services for decision-makers
 Assessment and valuation of Ecosystem Services for decision-makers An introduction to the ARIES approach Ferdinando Villa *, Ken Bagstad Gary Johnson, Marta Ceroni *Basque Center for Climate Change, Bilbao,
Re-Mapping the World s Population
 Re-Mapping the World s Population Benjamin D Hennig 1, John Pritchard 1, Mark Ramsden 1, Danny Dorling 1, 1 Department of Geography The University of Sheffield SHEFFIELD S10 2TN United Kingdom Tel. +44
Topic 4: Changing cities
 Topic 4: Changing cities Overview of urban patterns and processes 4.1 Urbanisation is a global process a. Contrasting trends in urbanisation over the last 50 years in different parts of the world (developed,
A Correlation of. Ohio s Learning Standards in Social Studies. Grade 5
 A Correlation of 2019 To in Social Studies Grade 5 Introduction The all new myworld Interactive Social Studies encourages students to explore their world, expand their thinking, and engage their college,
Animating Maps: Visual Analytics meets Geoweb 2.0
 Animating Maps: Visual Analytics meets Geoweb 2.0 Piyush Yadav 1, Shailesh Deshpande 1, Raja Sengupta 2 1 Tata Research Development and Design Centre, Pune (India) Email: {piyush.yadav1, shailesh.deshpande}@tcs.com
Maps: Two-dimensional, scaled representations of Earth surface - show spatial data (data with locational component)
") Maps: Two-dimensional, scaled representations of Earth surface - show spatial data (data with locational component) Cartography (map-making) involves 5 design decisions based on purpose of map Projection
Maps: Two-dimensional, scaled representations of Earth surface - show spatial data (data with locational component) Cartography (map-making) involves 5 design decisions based on purpose of map Projection
Design and Development of a Large Scale Archaeological Information System A Pilot Study for the City of Sparti
 INTERNATIONAL SYMPOSIUM ON APPLICATION OF GEODETIC AND INFORMATION TECHNOLOGIES IN THE PHYSICAL PLANNING OF TERRITORIES Sofia, 09 10 November, 2000 Design and Development of a Large Scale Archaeological
Eurostat Business Cycle Clock (BCC): A user's guide
: A user's guide") EUROPEAN COMMISSION EUROSTAT Directorate C: National Accounts, Prices and Key Indicators Unit C-1: National accounts methodology. Indicators ESTAT.C.1 - National accounts methodology/indicators Eurostat
EUROPEAN COMMISSION EUROSTAT Directorate C: National Accounts, Prices and Key Indicators Unit C-1: National accounts methodology. Indicators ESTAT.C.1 - National accounts methodology/indicators Eurostat
METHODS FOR STATISTICS
 DYNAMIC CARTOGRAPHIC METHODS FOR VISUALIZATION OF HEALTH STATISTICS Radim Stampach M.Sc. Assoc. Prof. Milan Konecny Ph.D. Petr Kubicek Ph.D. Laboratory on Geoinformatics and Cartography, Department of
Summary prepared by Amie Gaye: UNDP Human Development Report Office
 Contribution to Beyond Gross Domestic Product (GDP) Name of the indicator/method: The Human Development Index (HDI) Summary prepared by Amie Gaye: UNDP Human Development Report Office Date: August, 2011
PLC Papers Created For:
 PLC Papers Created For: Daniel Inequalities Inequalities on number lines 1 Grade 4 Objective: Represent the solution of a linear inequality on a number line. Question 1 Draw diagrams to represent these
Cartographic Skills. L.O. To be aware of the various cartographic skills and when to use them
 Cartographic Skills L.O. To be aware of the various cartographic skills and when to use them Cartographic Skills The term cartography is derived from two words: Carto = map graphy = write/draw Cartography
Geo-Visualization. GRS09/10 Ron van Lammeren
 Geo-Visualization GRS09/10 Ron van Lammeren 2/30 Theory Semiologie Graphique http://www.flickr.com/photos/kbean/491051226/ 3/30 How to present my geo data? Visualization definitions Map making Cartographic
A Level Biology: Biodiversity, Ecosystems and Practical Activities 5 days Specification Links
 Module 6: Genetics, Evolution and Practical Biodiversity and 6.3 6.3.1 a Abiotic and biotic influences P P P P P P b Biomass transfers P P P P P c Recycling within ecosystems P P P P d Primary succession
How GIS can be used for improvement of literacy and CE programmes
 How GIS can be used for improvement of literacy and CE programmes Training Workshop for Myanmar Literacy Resource Center (MLRC) ( Yangon, Myanmar, 11 20 October 2000 ) Presented by U THEIN HTUT GEOCOMP
Geo-Visualization. GRS1011 Ron van Lammeren
 Geo-Visualization GRS1011 Ron van Lammeren Theory Semiologie Graphique http://www.flickr.com/photos/kbean/491051226/ 2/30 How to present my geo data? Visualization definitions Map making Cartographic process
COMPARISON OF THE HUMAN DEVELOPMENT BETWEEN OIC COUNTRIES AND THE OTHER COUNTRIES OF THE WORLD
 COMPARISON OF THE HUMAN DEVELOPMENT BETWEEN OIC COUNTRIES AND THE OTHER COUNTRIES OF THE WORLD Ali Changi Ashtiani (M. A.) achashtian i@ya hoo.com Hadi Ghaffari (PhD) COMPARISON OF THE HUMAN DEVELOPMENT
Exploratory Data Analysis and Decision Making with Descartes and CommonGIS
 Exploratory Data Analysis and Decision Making with Descartes and CommonGIS Hans Voss, Natalia Andrienko, Gennady Andrienko Fraunhofer Institut Autonome Intelligente Systeme, FhG-AIS, Schloss Birlinghoven,
Study Guide Unit 6 Economics and Development
 Name Period Study Guide Unit 6 Economics and Development When you are asked to sketch maps, please put a key so that you can remember what the colors mean! Chapter 9: Development How does the author introduce
Interactions between Levels in an Agent Oriented Model for Generalisation
 Interactions between Levels in an Agent Oriented Model for Generalisation Adrien Maudet Université Paris-Est, IGN, COGIT, Saint-Mandé, France adrien.maudet@ign.fr Abstract. Generalisation is a complex
Esri Production Mapping: Map Automation & Advanced Cartography MADHURA PHATERPEKAR JOE SHEFFIELD
 Esri Production Mapping: Map Automation & Advanced Cartography MADHURA PHATERPEKAR JOE SHEFFIELD Traditional Cartography What you really want Cartographic Workflow Output Cartographic Data Symbology Layout
Creation of an Internet Based Indiana Water Quality Atlas (IWQA)
") Department of Environmental Management Creation of an Internet Based Water Quality Atlas (IWQA) May 4, 2005 IUPUI 1200 Waterway Blvd., Suite 100 polis, 46202-5140 Water Quality Atlas John Buechler, Neil
Department of Environmental Management Creation of an Internet Based Water Quality Atlas (IWQA) May 4, 2005 IUPUI 1200 Waterway Blvd., Suite 100 polis, 46202-5140 Water Quality Atlas John Buechler, Neil
SC06-S1C3-01 Analyze data obtained in a scientific investigation to identify trends..
 ARIZONA DEPARTMENT OF EDUCATION ACADEMIC STANDARDS El Tour de Agua addresses the following Academic Standards. (Complete versions of the Academic Standards are available at http://www.azed.gov/standards-practices.)
C/W Qu: How is development measured? 13/6/12 Aim: To understand how development is typically measured/classified and the pros/cons of these
 C/W Qu: How is development measured? 13/6/12 Aim: To understand how development is typically measured/classified and the pros/cons of these Starter: Comment on this image Did you spot these? Rubbish truck
FUNDAMENTALS OF GEOINFORMATICS PART-II (CLASS: FYBSc SEM- II)
") FUNDAMENTALS OF GEOINFORMATICS PART-II (CLASS: FYBSc SEM- II) UNIT:-I: INTRODUCTION TO GIS 1.1.Definition, Potential of GIS, Concept of Space and Time 1.2.Components of GIS, Evolution/Origin and Objectives
FUNDAMENTALS OF GEOINFORMATICS PART-II (CLASS: FYBSc SEM- II) UNIT:-I: INTRODUCTION TO GIS 1.1.Definition, Potential of GIS, Concept of Space and Time 1.2.Components of GIS, Evolution/Origin and Objectives
Technical Drafting, Geographic Information Systems and Computer- Based Cartography
 Technical Drafting, Geographic Information Systems and Computer- Based Cartography Project-Specific and Regional Resource Mapping Services Geographic Information Systems - Spatial Analysis Terrestrial
Maps and sustainability
 Maps and sustainability The International Map Year [ mapyear.org ] Menno-Jan Kraak Maps Cartography and maps A map is a visual representation of an environment maps tell stories maps invite maps show patterns
Using Web Maps to Measure the Development of Global Scale Cognitive Maps
 Using Web Maps to Measure the Development of Global Scale Cognitive Maps Thomas J. Pingel Department of Geography Northern Illinois University Illinois Geographic Information Systems Association (ILGISA)
Visualisation of Spatial Data
 Visualisation of Spatial Data VU Visual Data Science Johanna Schmidt WS 2018/19 2 Visual Data Science Introduction to Visualisation Basics of Information Visualisation Charts and Techniques Introduction
World Geography TEKS 2nd Nine Weeks. Unit of Study Regional Studies; U.S. and Canada Regional Studies; Latin America; and Europe
 World Geography TEKS 2nd Nine Weeks Unit of Study Regional Studies; U.S. and Canada Regional Studies; Latin America; and Europe 1) History. The student understands how geography and processes of spatial
Eastern Hemisphere Geography 7th Grade *Chapters 1-10 covered in 6 th Grade
 Quarter 1 Geography Tools and Concepts Chapters 1-5 Intro to Geography = 2 day review Goal Objective Task Analysis Vocabulary Text Location Goal 2.1: Analyze the 6-9.GEH.2.1.1 Explain and use the Identify
CHILD SAFETY COUNTRY PROFILE Slovenia
 CHILD SAFETY COUNTRY PROFILE 2012 Slovenia The Child Safety Country Profile 2012 for Slovenia highlights the burden of child and adolescent injury and examines socio-demographic determinants to provide
Geography 360 Principles of Cartography. April 17, 2006
 Geography 360 Principles of Cartography April 17, 2006 Outlines Cartographic design principles Enhancing visual hierarchies on maps Kinds of numerical data and color scheme What is proportional symbol
Trends in Human Development Index of European Union
 Trends in Human Development Index of European Union Department of Statistics, Hacettepe University, Beytepe, Ankara, Turkey spxl@hacettepe.edu.tr, deryacal@hacettepe.edu.tr Abstract: The Human Development
Chitra Sood, R.M. Bhagat and Vaibhav Kalia Centre for Geo-informatics Research and Training, CSK HPKV, Palampur , HP, India
 APPLICATION OF SPACE TECHNOLOGY AND GIS FOR INVENTORYING, MONITORING & CONSERVATION OF MOUNTAIN BIODIVERSITY WITH SPECIAL REFERENCE TO MEDICINAL PLANTS Chitra Sood, R.M. Bhagat and Vaibhav Kalia Centre
CHILD SAFETY COUNTRY PROFILE Croatia
 CHILD SAFETY COUNTRY PROFILE 2012 Croatia The Child Safety Country Profile 2012 for Croatia highlights the burden of child and adolescent injury and examines socio-demographic determinants to provide a
ACRONYMS AREAS COUNTRIES MARINE TERMS
 Natura 2000 ACRONYMS AREAS COUNTRIES MARINE TERMS DEFINITION A European network of protected sites under the European Habitats and Birds Directives, aiming to protect the most valuable and threatened European
Migrating Defense Workflows from ArcMap to ArcGIS Pro. Renee Bernstein and Jared Sellers
 Migrating Defense Workflows from ArcMap to ArcGIS Pro Renee Bernstein and Jared Sellers ArcGIS Desktop Desktop Web Device ArcMap ArcCatalog ArcScene ArcGlobe ArcGIS Pro portal Server Online Content and
ArcGIS & Extensions - Synergy of GIS tools. Synergy. Analyze & Visualize
 Using ArcGIS Extensions to Analyze and Visualize data Colin Childs 1 Topics Objectives Synergy Analysis & Visualization ArcGIS Analysis environments Geoprocessing tools Extensions ArcMap The analysis Process
Empowered lives. Resilient nations. Data for People and Planet. powered by
 Empowered lives. Resilient nations. Data for People and Planet powered by Overview As we enter the fourth industrial revolution, technology is revolutionizing our ability to map nature. Satellite data
Geovisualization of Attribute Uncertainty
 Geovisualization of Attribute Uncertainty Hyeongmo Koo 1, Yongwan Chun 2, Daniel A. Griffith 3 University of Texas at Dallas, 800 W. Campbell Road, Richardson, Texas 75080, 1 Email: hxk134230@utdallas.edu
Interactive Statistics Visualisation based on Geovisual Analytics
 Interactive Statistics Visualisation based on Geovisual Analytics Prof. Mikael Jern NCVA LiU and NComVA AB May 2010 - Spin-off company to focus on Interactive Statistics Visualization and Storytelling
Geography General Course Year 12. Selected Unit 3 syllabus content for the. Externally set task 2019
 Geography General Course Year 12 Selected Unit 3 syllabus content for the Externally set task 2019 This document is an extract from the Geography General Course Year 12 syllabus, featuring all of the content
Flexible Spatio-temporal smoothing with array methods
 Int. Statistical Inst.: Proc. 58th World Statistical Congress, 2011, Dublin (Session IPS046) p.849 Flexible Spatio-temporal smoothing with array methods Dae-Jin Lee CSIRO, Mathematics, Informatics and
Key Indicators for Territorial Cohesion & Spatial Planning Stakeholder Workshop - Project Update. 13 th December 2012 San Sebastián, Basque Country
 Key Indicators for Territorial Cohesion & Spatial Planning Stakeholder Workshop - Project Update 13 th December 2012 San Sebastián, Basque Country Key Aims Explore the use of territorial data in developing
Intelligent Decision Support for New Product Development: A Consumer-Oriented Approach
 Appl. Math. Inf. Sci. 8, No. 6, 2761-2768 (2014) 2761 Applied Mathematics & Information Sciences An International Journal http://dx.doi.org/10.12785/amis/080611 Intelligent Decision Support for New Product
Global Environment Facility - Integrating Watershed & Coastal Areas Management (GEF-IWCAM): Andros Demonstration Site
: Andros Demonstration Site") Global Environment Facility - Integrating Watershed & Coastal Areas Management (GEF-IWCAM): Andros Demonstration Site Coastal Aquifer Management in Small Island Developing States of the Caribbean: Challenges
Global Environment Facility - Integrating Watershed & Coastal Areas Management (GEF-IWCAM): Andros Demonstration Site Coastal Aquifer Management in Small Island Developing States of the Caribbean: Challenges
GIS in Locating and Explaining Conflict Hotspots in Nepal
 GIS in Locating and Explaining Conflict Hotspots in Nepal Lila Kumar Khatiwada Notre Dame Initiative for Global Development 1 Outline Brief background Use of GIS in conflict study Data source Findings
Maps as Tools for Visual Analysis of Geospatial Data. Dr. Claus Rinner Department of Geography and Environmental Studies Ryerson University
 Maps as Tools for Visual Analysis of Geospatial Data Dr. Claus Rinner Department of Geography and Environmental Studies Ryerson University 1 Geography and data analytics 80% of all datasets are said to
Correspondence analysis and related methods
 Michael Greenacre Universitat Pompeu Fabra www.globalsong.net www.youtube.com/statisticalsongs../carmenetwork../arcticfrontiers Correspondence analysis and related methods Middle East Technical University
10.7 Polynomial and Rational Inequalities
 10.7 Polynomial and Rational Inequalities In this section we want to turn our attention to solving polynomial and rational inequalities. That is, we want to solve inequalities like 5 4 0. In order to do
Geography: Place & Liveability
 Geography: Place & Liveability Learning Area(s) Geography Year(s) 6, 7 Description AC Geography : Year 6 A diverse and connected world takes a global view of geography and focuses particularly on the concepts
Statistics Toolbox 6. Apply statistical algorithms and probability models
 Statistics Toolbox 6 Apply statistical algorithms and probability models Statistics Toolbox provides engineers, scientists, researchers, financial analysts, and statisticians with a comprehensive set of
Advances in the Use of MCDA Methods in Decision-Making
 Advances in the Use of MCDA Methods in Decision-Making JOSÉ RUI FIGUEIRA CEG-IST, Center for Management Studies, Instituto Superior Técnico, Lisbon LAMSADE, Université Paris-Dauphine (E-mail : figueira@ist.utl.pt)
Outline. - Background of coastal and marine conservation - Species distribution modeling (SDM) - Reserve selection analysis. - Results & discussion
 - Reserve selection analysis. - Results & discussion") Application of GIS for data preparation and modeling for coastal and marine conservation planning in Madagascar Rija Rajaonson Technical Assistant, REBIOMA Wildlife Conservation Society Madagascar Outline
Application of GIS for data preparation and modeling for coastal and marine conservation planning in Madagascar Rija Rajaonson Technical Assistant, REBIOMA Wildlife Conservation Society Madagascar Outline
Spatial Data Management of Bio Regional Assessments Phase 1 for Coal Seam Gas Challenges and Opportunities
 Spatial Data Management of Bio Regional Assessments Phase 1 for Coal Seam Gas Challenges and Opportunities By Dr Zaffar Sadiq Mohamed-Ghouse Principal Consultant, Spatial & IT, GHD zaffar.sadiq@ghd.com
CSC2524 L0101 TOPICS IN INTERACTIVE COMPUTING: INFORMATION VISUALISATION DATA MODELS. Fanny CHEVALIER
 CSC2524 L0101 TOPICS IN INTERACTIVE COMPUTING: INFORMATION VISUALISATION DATA MODELS Fanny CHEVALIER VISUALISATION DATA MODELS AND REPRESENTATIONS Source: http://www.hotbutterstudio.com/ THE INFOVIS
Version 1.1 GIS Syllabus
 GEOGRAPHIC INFORMATION SYSTEMS CERTIFICATION Version 1.1 GIS Syllabus Endorsed 1 Version 1 January 2007 GIS Certification Programme 1. Target The GIS certification is aimed at: Those who wish to demonstrate
Exploring Spatial Relationships for Knowledge Discovery in Spatial Data
 2009 International Conference on Computer Engineering and Applications IPCSIT vol.2 (2011) (2011) IACSIT Press, Singapore Exploring Spatial Relationships for Knowledge Discovery in Spatial Norazwin Buang
Cambridge International Examinations Cambridge International General Certificate of Secondary Education
 Cambridge International Examinations Cambridge International General Certificate of Secondary Education *2660755211* GEOGRAPHY 0460/12 Paper 1 May/June 2018 Candidates answer on the Question Paper. Additional
3. What is the etymology (how the word came to be) of geography. 4. How does the study of physical geography differ from that of human geography?
 of geography. 4. How does the study of physical geography differ from that of human geography?") AP Human Geography Unit 1: Basic Concepts and Development Guided Reading Mr. Stepek Directions: Follow the common directions distributed to you for guided reading assignments. Rubenstein p 2 5 (Introduction)
AP Human Geography Unit 1: Basic Concepts and Development Guided Reading Mr. Stepek Directions: Follow the common directions distributed to you for guided reading assignments. Rubenstein p 2 5 (Introduction)
José Luis Palma, William Rose and Rüdiger Escobar Wolf Department of Geological Engineering and Sciences Michigan Technological University
 Assessing the Volcanic Threat of Central American Volcanoes José Luis Palma, William Rose and Rüdiger Escobar Wolf Department of Geological Engineering and Sciences Michigan Technological University Outline
Applying ArcGIS Online for Establishing Hanoi Agriculture Map
 Applying ArcGIS Online for Establishing Hanoi Agriculture Map Thanh Xuan Nguyen Geography Department Hanoi National University of Education mrthanhxuan@gmail.com Tien Yin Chou GIS Research Center Feng
GeoComputation 2011 Session 4: Posters Discovering Different Regimes of Biodiversity Support Using Decision Tree Learning T. F. Stepinski 1, D. White
 Discovering Different Regimes of Biodiversity Support Using Decision Tree Learning T. F. Stepinski 1, D. White 2, J. Salazar 3 1 Department of Geography, University of Cincinnati, Cincinnati, OH 45221-0131,