Eurostat regional yearbook using statistical maps and graphs to tell a story. Teodóra Brandmüller and Åsa Önnerfors, Eurostat
|
|
|
- Laureen Wheeler
- 6 years ago
- Views:
Transcription

1 Eurostat regional yearbook using statistical maps and graphs to tell a story Teodóra Brandmüller and Åsa Önnerfors, Eurostat
2

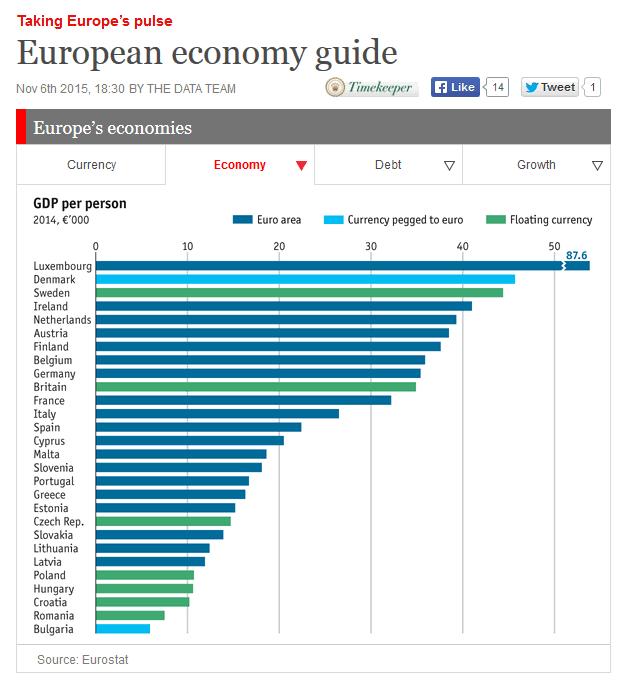
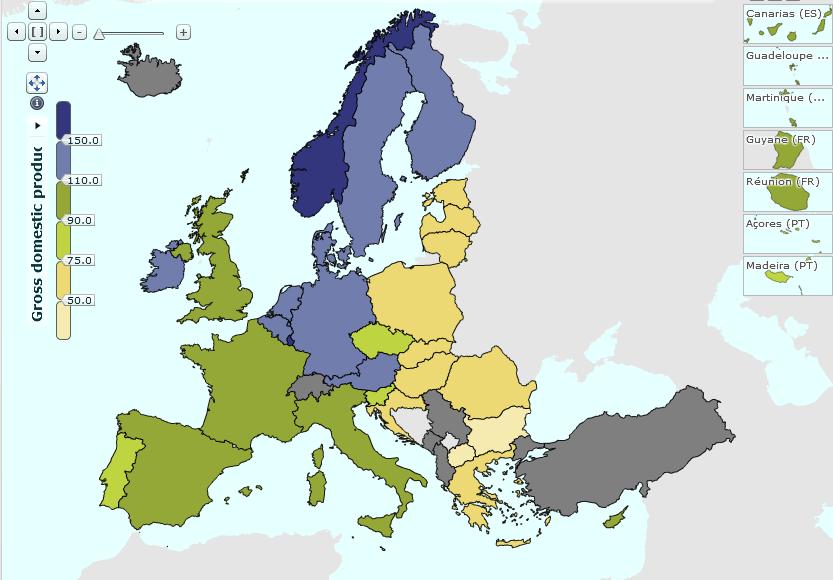
3 Gross domestic product (GDP) at current market prices per inhabitant in Euros, 2014
,")
4 Gross domestic product (GDP) at current market prices per inhabitant in purchasing power standards (PPS), 2014

5 Gross domestic product (GDP) at current market prices per employed person in PPS, 2014
6 Principles for the NUTS classification: 1. Population thresholds for the 3 NUTS levels:

7 Nomenclature of territorial units for statistics = NUTS 1342 NUTS 3 regions 276 NUTS 2 regions 98 NUTS 1 regions 28 Member states of the EU

8 Gross domestic product (GDP) at current market prices per inhabitant in PPS, 2012

9 Gross domestic product (GDP) at current market prices per inhabitant in PPS, 2012
10 Principles for the NUTS classification: 1. Population thresholds for the 3 NUTS levels: 2. NUTS favours administrative divisions Data availability Regional policies 3. NUTS favours general geographical units
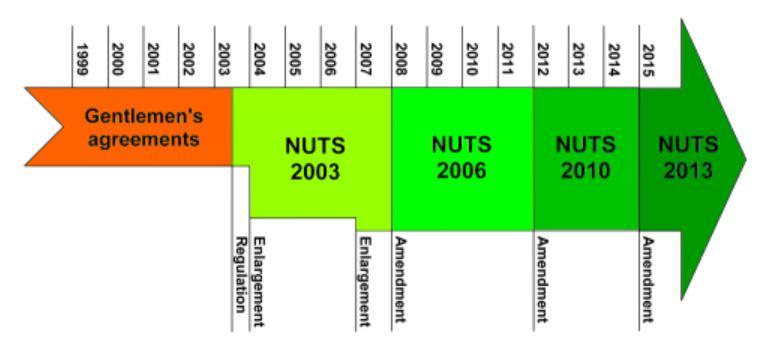
11 NUTS amendments 11
12 Gross Domestic Product per inhabitant in PPS in 2012 (EU28=100%)

13 Gross Domestic Product per inhabitant in PPS in 2012 at NUTS 1 level (EU28=100%)
14 Gross Domestic Product per inhabitant in PPS in 2012 at NUTS 2 level (EU28=100%)
15 Gross Domestic Product per inhabitant in PPS in 2012 at NUTS 3 level (EU28=100%)
16


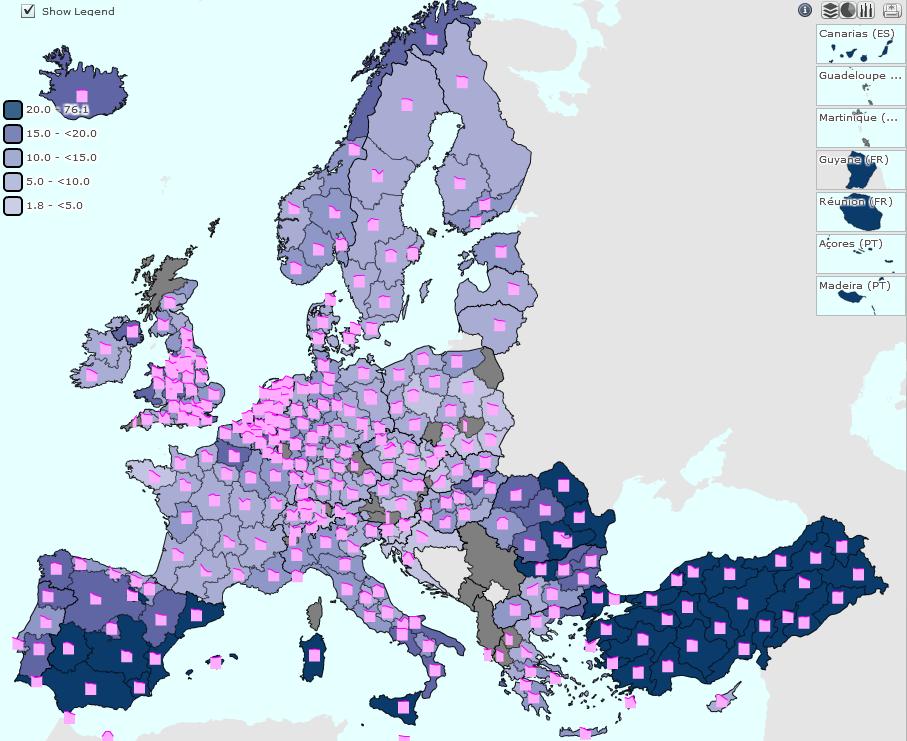
17 Nights spent in tourist accommodation establishments, by NUTS level 2 region, 2013 per 1000 inhabitants per km 2

18 Gross Domestic Product per inhabitant in PPS, by NUTS level 2 region, 2013 EU 28=100 change in percentage points compared to 2008
19 Early leavers from education and training, by NUTS level 2 regions, 2014 % share of year-olds change in percentage points compared to 2008
20
21
22 Source: N. Lamber, C. Zanin (2013): Mapping Guide
23
24
25
26
27
28
29
30
31
32
33
34
35
36
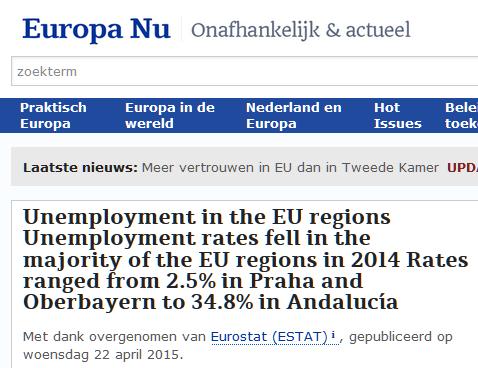
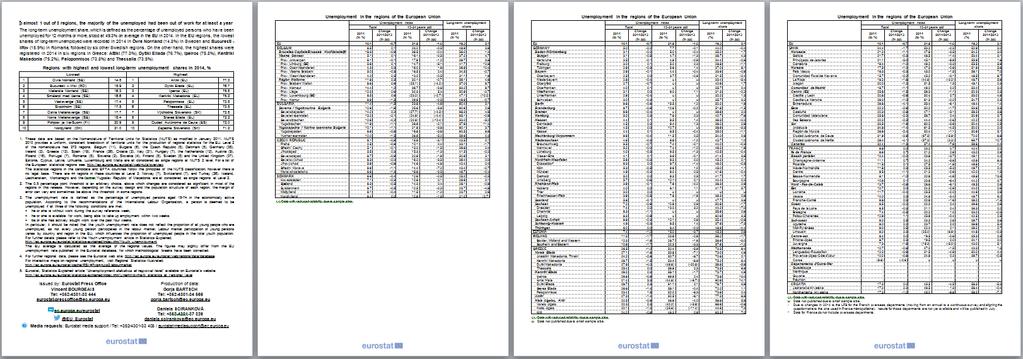
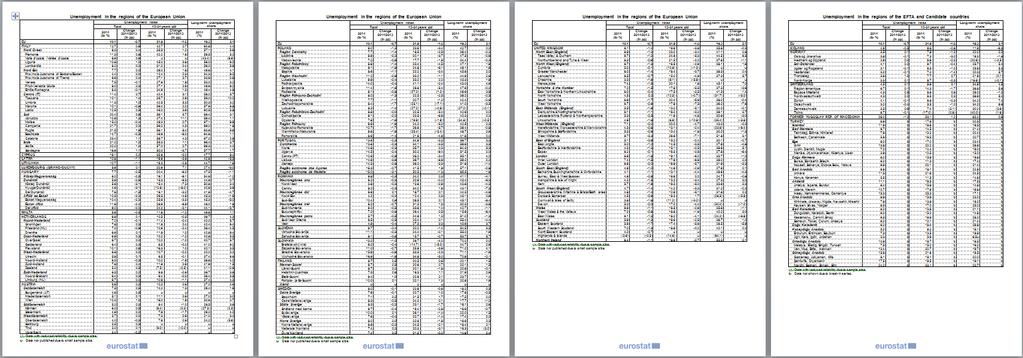
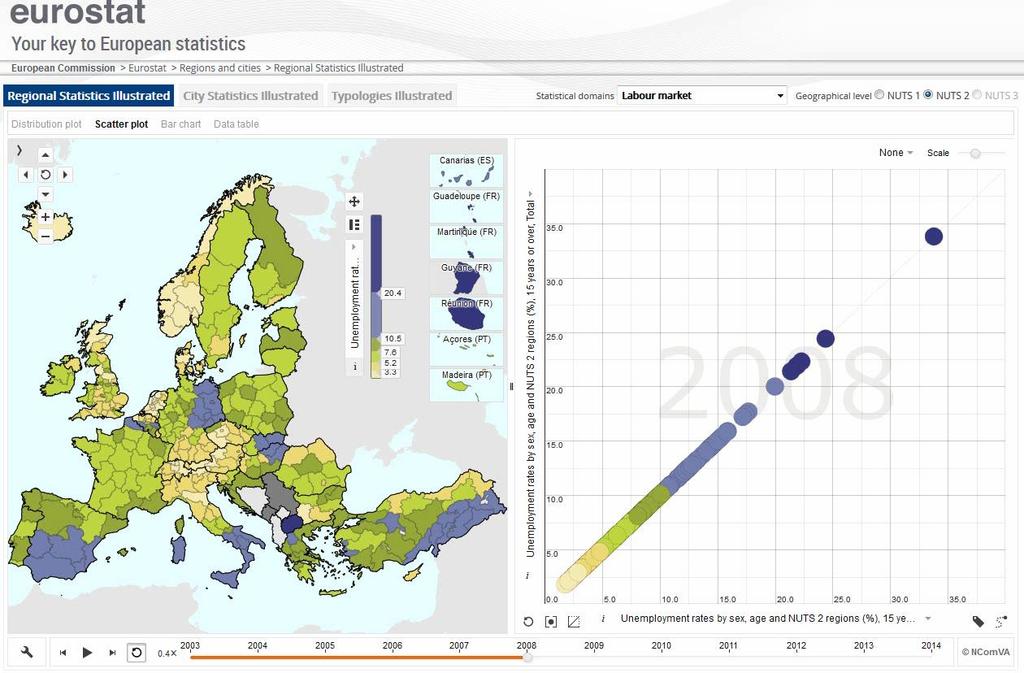
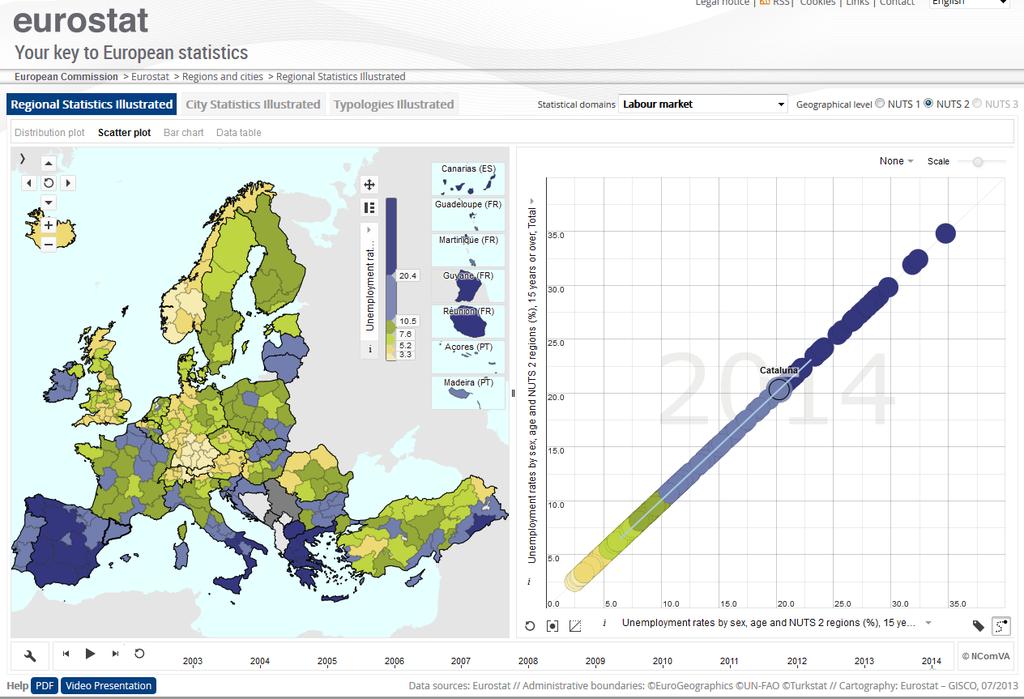
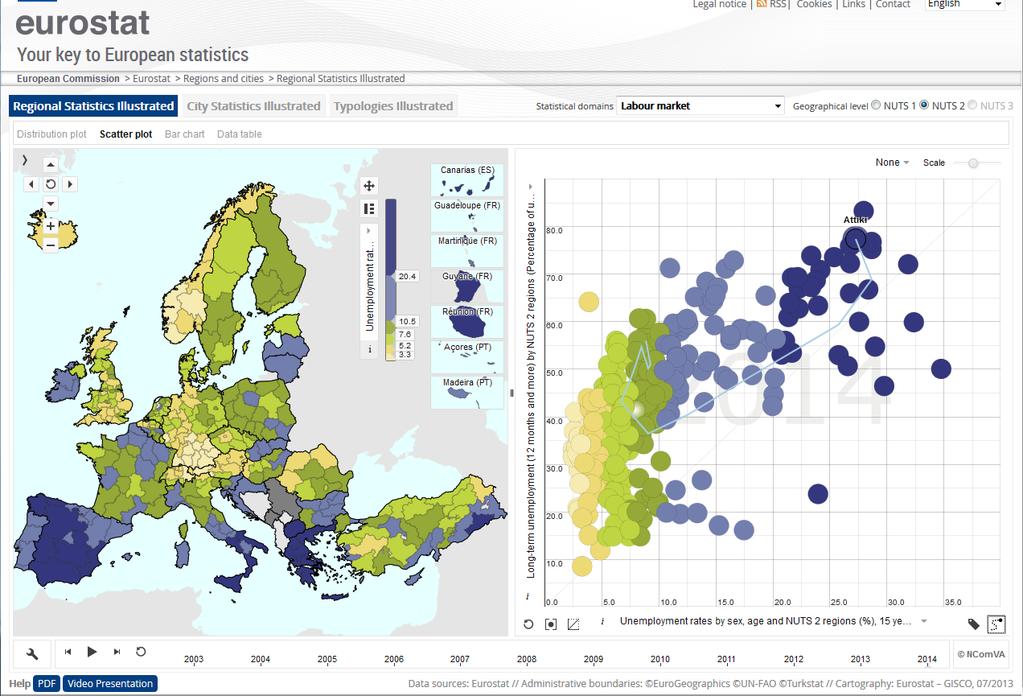
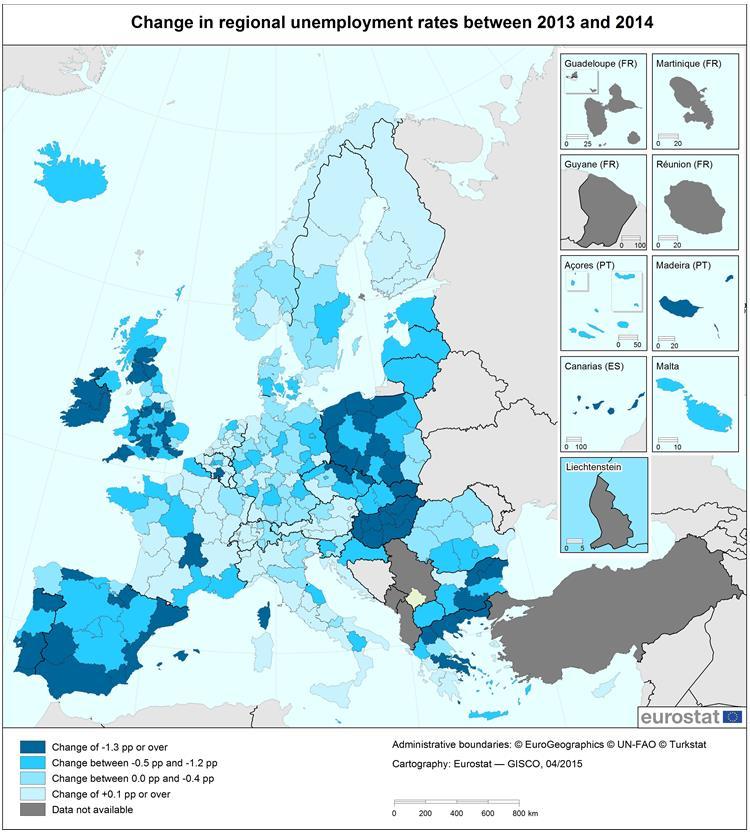
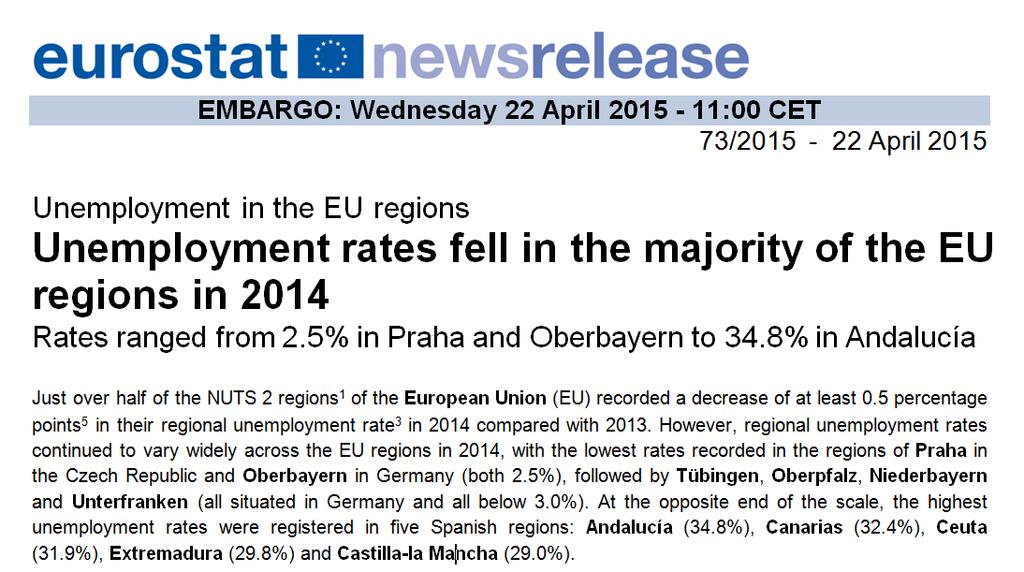
37 Regional unemployment in media in April 2015 October 2014
38 Best practice for map making Would you like to: Use an already produced map and include it in your report, presentation, publication, information brochure, tweet, etc.? Actively extract data and produce statistical maps yourself? There are a couple of things you need to consider before you make your choices.


39 Choropleth map: a thematic map in which areas are shaded or patterned in proportion to the measurement of the statistical variable being displayed on the map. Proportional symbol map: the map uses symbols of different sizes to represent data associated with areas or locations, i.e. cities. Dot distribution map: individual events are marked with a dot, allowing users to identify geographic patterns /clusters.
40 Title information: Statistical indicator or variable Different breakdowns: age group, gender, classification(s), geographical level etc. Latest reference year Measurement unit Example: Avoid using abbreviations, if not very well known! The map title should be selfexplanatory! Female employment rate, persons aged 20-64, by NUTS 2 regions, 2014 (%)
41 Class division, selecting thresholds: Different class division methods: Quantile: each class contains an equal number of values, e.g. 4 classes with 25 % or 5 classes with 20 % of the values in each class. Equal interval: divides the range of attribute values into equally sized sub-ranges, e.g. 3 classes for values from 0 to 300, will give 0-100, , , no matter how the values are distributed. Natural breaks (Jenks): based on natural groupings inherent in the data. If you use an even number of classes with the quantile method, the middle value represents the median = a good choice when using two contrasting colours.


42 Selecting the colour shades Sequential: from lighter to darker Diverging: contrasting colours, dark-light-dark Qualitative: each class have a different colour For colour advice use:
43 Actual map information Decide on your geographical coverage. Decide on scale and generalisation level. For EU-territory: show overseas territories in inlets. Use a separate colour for "Data not available". Administrative borders: better to use a thicker black line for country borders - easier to locate regions. Don't mix geographical and statistical content - too much information will clutter the map (i.e. lakes). Political implications of incorrect administrative borders or labels. Be cautious!
44 Footnote and source information A footnote is used for listing information relating to extracted data: definitions or exceptions to the reference year, NUTS level etc. mentioned in the main title. Source information is obligatory on statistical maps, can either be general ("Source: Eurostat") or better: include hyperlink to the live dataset or to static data extracted to produce the map.
45 Presentation techniques You also need to think carefully on how to present the map(s) you now have selected or produced. Using several maps side by side can reinforce your message and help to tell a story. A map in combination with a graph or table can also be a very efficient way of highlighting different aspects of the data.
46 Life expectancy at birth, male and female

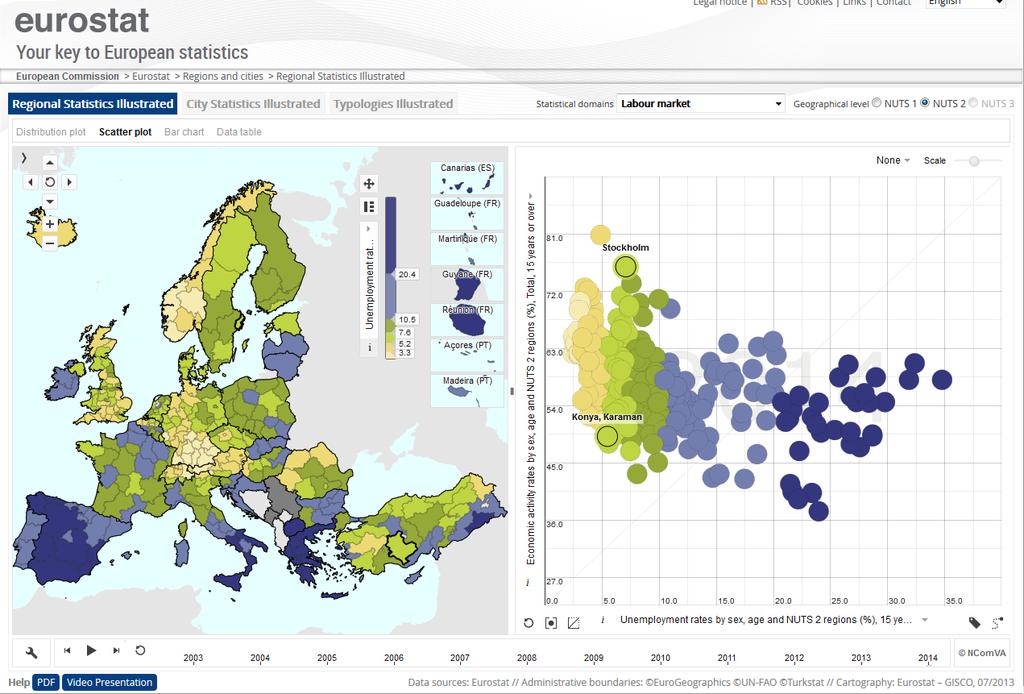
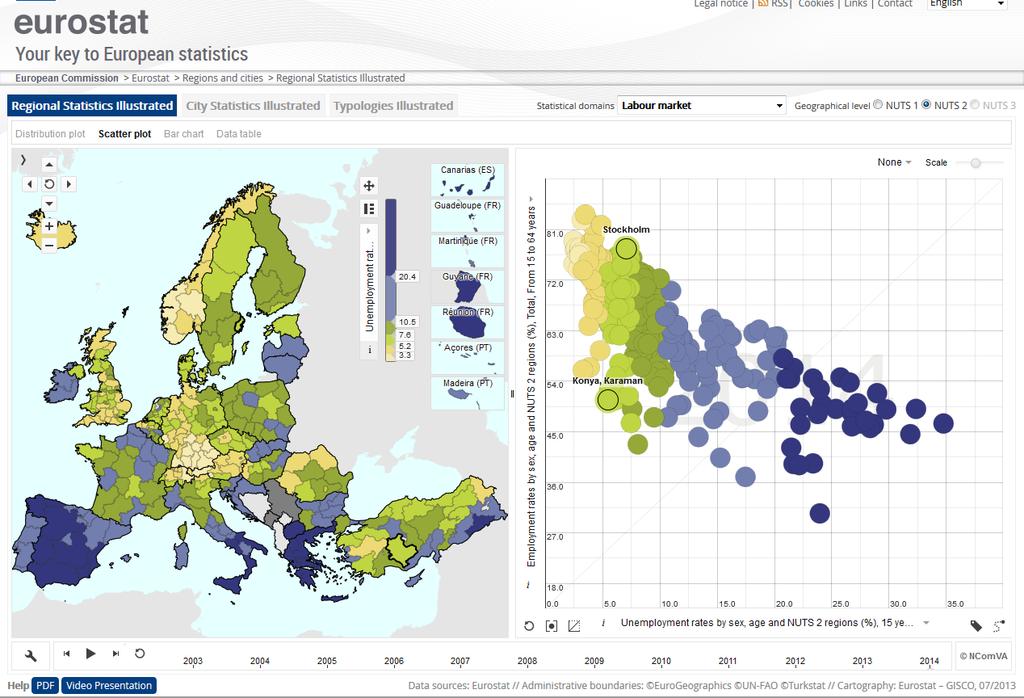
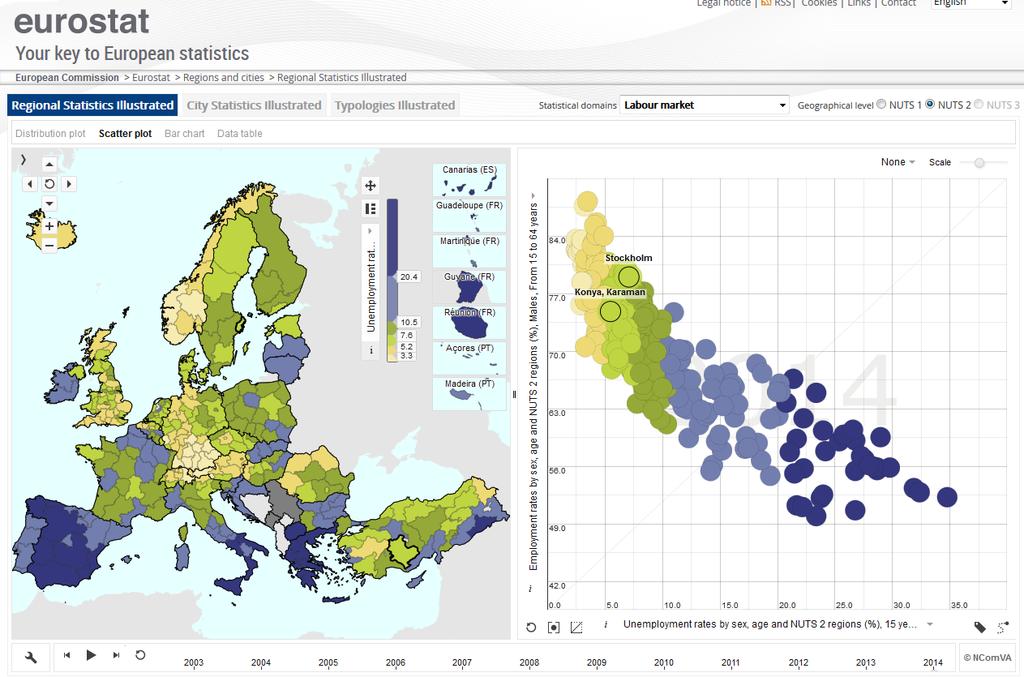
47 Employment rate and change rate
48 GDP per inhabitant in PPS, NUTS 2 and 3
49 Using colours to signalise gender gap Life expectancy at birth Activity rate Part-time employment
50 Reinforcing the message with map and graph: showing the gender gap in life expectancy
51 Any questions or comments? Remember "less is more", don't be afraid to show relatively simple maps! Tailor-made your data visualisations depending on the audience / target group. Are you already using maps and graphs in your work what is your experience?

52 "My region" mobile app A new development we now are finalising. Indicator selection and bug-fixing. The new app will be launched for ios and Android in the beginning of next year.


53 Select and compare up to 3 regions at a time
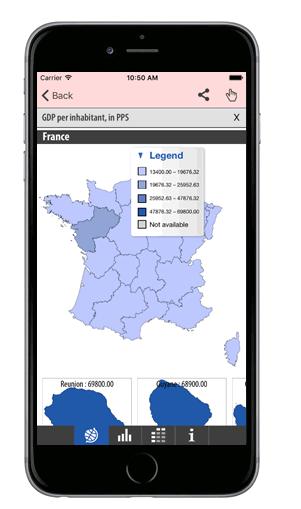
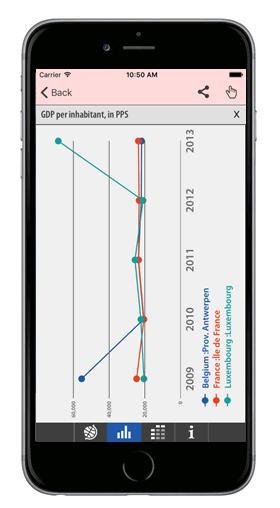
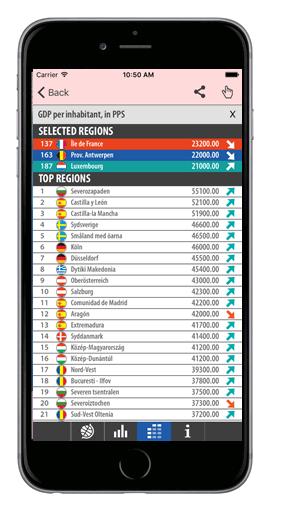
54 National comparison, timeline graph and ranking
55 Any questions or comments? Interesting topics for the next edition of the Eurostat regional yearbook? What kind of data on regions and cities are you looking for? Have you been visiting the Eurostat website and database what is your experience?


56 Thank you for your attention!
Compact guides GISCO. Geographic information system of the Commission
 Compact guides GISCO Geographic information system of the Commission What is GISCO? GISCO, the Geographic Information System of the COmmission, is a permanent service of Eurostat that fulfils the requirements
European Regional and Urban Statistics
 European Regional and Urban Statistics Dr. Berthold Feldmann berthold.feldmann@ec.europa.eu Eurostat Structure of the talk Regional statistics in the EU The tasks of Eurostat Regional statistics Urban
Physical Geography Lab Activity #15
 Physical Geography Lab Activity #15 Due date Name Choropleth Maps COR Objective 1 & 7, SLOs 1 & 3 15.1. Introduction Up until this point we have used maps to find locations on the Earth. While they are
Mapping Data 1: Constructing a Choropleth Map
 Mapping Data 1: Constructing a Choropleth Map OVERVIEW & OBJECTIVES Students will become acquainted with mapping data and understanding the importance of recognizing patterns by constructing a choropleth
GED 554 IT & GIS. Lecture 6 Exercise 5. May 10, 2013
 GED 554 IT & GIS Lecture 6 Exercise 5 May 10, 2013 Free GIS data sources ******************* Mapping numerical data & Symbolization ******************* Exercise: Making maps for presentation GIS DATA SOFTWARE
ESPON public database
 ESPON public database - tables and indicators overview - NUTS-Reference: NUTS 0 reference NUTS 1 reference NUTS 2 reference NUTS 3 reference ESPON basic indicators: Area NUTS 2 Area in square kilometer
How can we assure that local decision makers have the right statistics
 How can we assure that local decision makers have the right statistics Petra Kuncová Czech Statistical Office How can we assure.? 1. We have to be in contact with regional users incl. local decision makers
The ESPON Programme. Goals Main Results Future
 The ESPON Programme Goals Main Results Future Structure 1. Goals Objectives and expectations Participation, organisation and networking Themes addressed in the applied research undertaken in ESPON projects
Mapping the most and the least
 Mapping the most and the least Why do you make a map To communicate information at a glance To explore the data to see what patterns and retionships you can find To develop hypothesis (will be topic of
What is a map? A simple representation of the real world Two types of maps
 Mapping with GIS What is a map? A simple representation of the real world Two types of maps Reference maps showing reference features such as roads, locations, political boundaries, cities etc. Thematic
CentropeSTATISTICS Working Interactively with Cross-Border Statistic Data Clemens Beyer, Walter Pozarek, Manfred Schrenk
 Clemens Beyer, Walter Pozarek, Manfred Schrenk (Dipl.-Ing. Clemens Beyer, CEIT ALANOVA, Concorde Business Park 2/F, 2320 Schwechat, Austria, c.beyer@ceit.at) (Dipl.-Ing. Walter Pozarek, PGO Planungsgemeinschaft
TERCET: A European regulation on statistical units and territorial typologies
 TERCET: A European regulation on statistical units and territorial typologies NUAC Meeting 10 May 2016 Eurostat Unit E4 Regulation (EC) No 1059/2003: - Establishes a classification of territorial units
Labour Market Areas in Italy. Sandro Cruciani Istat, Italian National Statistical Institute Directorate for territorial and environmental statistics
 Labour Market Areas in Italy Sandro Cruciani Istat, Italian National Statistical Institute Directorate for territorial and environmental statistics Workshop on Developing European Labour Market Areas Nuremberg,
BUILDING SOUND AND COMPARABLE METRICS FOR SDGS: THE CONTRIBUTION OF THE OECD DATA AND TOOLS FOR CITIES AND REGIONS
 BUILDING SOUND AND COMPARABLE METRICS FOR SDGS: THE CONTRIBUTION OF THE OECD DATA AND TOOLS FOR CITIES AND REGIONS STATISTICAL CAPACITY BUILDING FOR MONITORING OF SUSTAINABLE DEVELOPMENT GOALS Lukas Kleine-Rueschkamp
European spatial policy and regionalised approaches
 Findings of the ESPON 2006 Programme COMMIN Final Conference 26-27 April 2007 European spatial policy and regionalised approaches by Dr. Kai BöhmeB ! Territory matters Structure of presentation! Territorial
How proximity to a city influences the performance of rural regions by Lewis Dijkstra and Hugo Poelman
 n 01/2008 Regional Focus A series of short papers on regional research and indicators produced by the Directorate-General for Regional Policy Remote Rural Regions How proximity to a city influences the
from
 8Map Generalization and Classification Our human and natural environments are complex and full of detail. Maps work by strategically reducing detail and grouping phenomena together. Driven by your intent,
Case Study: Australia. LI: To understand urbanisation issues and management strategies in Australia
 Case Study: Australia LI: To understand urbanisation issues and management strategies in Australia Warm Up Match the place names to the map: Urbanisation In 1910, fewer than 40% of Australians lived in
Vibrant urban economies: growth and decline of European cities
 Vibrant urban economies: growth and decline of European cities Dr. Vlad Mykhnenko Centre for Urban and Regional Studies (CURS) School of Geography, Earth & Environmental Sciences University of Birmingham,
Location. Look over the indicators of location on your handout. What things about Baltimore s location make it unique from other places?
 Objective We will review the 5 Themes of Geography to explain why each place on earth is unique. We will apply the concepts related to the 5 Themes of Geography to Baltimore Tuesday, September 7, 2010
Workbook Exercises for Statistical Problem Solving in Geography
 Workbook Exercises for Statistical Problem Solving in Geography Arthur J. Lembo, Jr. This workbook is for use with the popular textbook Introduction to Statistical Problem Solving in Geography, and includes
Implementation of the ESPON 2020 cooperation program. 16 January 2017 Anneloes van Noordt
 Implementation of the ESPON 2020 cooperation program 16 January 2017 Anneloes van Noordt Outline! ESPON Cooperation Program! Specific Objectives! Applied Research! Targeted Analysis! Database & Tools!
Geography 281 Map Making with GIS Project Four: Comparing Classification Methods
 Geography 281 Map Making with GIS Project Four: Comparing Classification Methods Thematic maps commonly deal with either of two kinds of data: Qualitative Data showing differences in kind or type (e.g.,
Launch of the ESPON 2013 Programme. European observation network on territorial development and cohesion
 Launch of the ESPON 2013 Programme European observation network on territorial development and cohesion Framework conditions for the ESPON 2013 Programme Policy development in use of territorial evidence
Give 4 advantages of using ICT in the collection of data. Give. Give 4 disadvantages in the use of ICT in the collection of data
 Give 4 advantages of using ICT in the collection of data can use a handheld GPS to get accurate location information which can be used to show data linked to specific locations within a GIS can collect
Advanced/Advanced Subsidiary. You must have: Mathematical Formulae and Statistical Tables (Blue)
") Write your name here Surname Other names Pearson Edexcel International Advanced Level Centre Number Statistics S1 Advanced/Advanced Subsidiary Candidate Number Friday 5 June 2015 Morning Time: 1 hour 30
Write your name here Surname Other names Pearson Edexcel International Advanced Level Centre Number Statistics S1 Advanced/Advanced Subsidiary Candidate Number Friday 5 June 2015 Morning Time: 1 hour 30
PhysicsAndMathsTutor.com. International Advanced Level Statistics S1 Advanced/Advanced Subsidiary
 Write your name here Surname Other names Pearson Edexcel International Advanced Level Centre Number Statistics S1 Advanced/Advanced Subsidiary Candidate Number Friday 5 June 2015 Morning Time: 1 hour 30
Eurostat Business Cycle Clock (BCC): A user's guide
: A user's guide") EUROPEAN COMMISSION EUROSTAT Directorate C: National Accounts, Prices and Key Indicators Unit C-1: National accounts methodology. Indicators ESTAT.C.1 - National accounts methodology/indicators Eurostat
EUROPEAN COMMISSION EUROSTAT Directorate C: National Accounts, Prices and Key Indicators Unit C-1: National accounts methodology. Indicators ESTAT.C.1 - National accounts methodology/indicators Eurostat
MAPPING GUIDE CARTOGRAPHY IN ESPON 2013 CONTENT 24 PAGES
 MAPPING GUIDE CARTOGRAPHY IN ESPON 2013 CONTENT Enhancing information. This part explain how symbolize ESPON 2013 data with the good rules of graphic semiology. Maps are tool for communication. This part
Poland, European Territory, ESPON Programme Warsaw, 2 July 2007 STRATEGY OF THE ESPON 2013 PROGRAMME
 Poland, European Territory, ESPON Programme 2007-2013 Warsaw, 2 July 2007 STRATEGY OF THE ESPON 2013 PROGRAMME Territory matters Regional diversity as asset Territorial potentials increasing in importance
Version 1.1 GIS Syllabus
 GEOGRAPHIC INFORMATION SYSTEMS CERTIFICATION Version 1.1 GIS Syllabus Endorsed 1 Version 1 January 2007 GIS Certification Programme 1. Target The GIS certification is aimed at: Those who wish to demonstrate
Euro-indicators Working Group
 Euro-indicators Working Group Luxembourg, 9 th & 10 th June 2011 Item 9.3 of the Agenda Towards an early warning system for the Euro area By Gian Luigi Mazzi Doc 308/11 Introduction Clear picture of economic
Human Population Dynamics CAPT Embedded Task
 Name Per. Assigned Due Human Population Dynamics CAPT Embedded Task Essential Question: What factors influence population growth? The human population has existed for a little more than 500,000 years.
ANNEX 2: Defining and measuring rurality. Prepared by Dr Steve Goss
 ANNEX 2: Defining and measuring rurality Prepared by Dr Steve Goss June 2013 1 TABLE OF CONTENTS 1 Definitions of rurality in common use... 2 1.1 Measuring rurality... 2 1.1.1 OECD rural urban division...
Map Makeovers: How to Make Your Map Great!
 Esri International User Conference San Diego, CA Technical Workshops Map Makeovers: How to Make Your Map Great! Charlie Frye, Esri, Redlands, Jim Herries, Esri, Redlands Session Goals Demonstrate cartographic
Coastal regions: People living along the coastline and integration of NUTS 2010 and latest population grid
 Statistics in focus (SIF-SE background article) Authors: Andries ENGELBERT, Isabelle COLLET Coastal regions: People living along the coastline and integration of NUTS 2010 and latest population grid Among
There are benefits to viewing Europe as a collection of cities and regions rather than as a group of nation states
 Ballas, D., Dorling, D. and Hennig, B.D. (2014) There are benefits to viewing Europe as a collection of cities and regions rather than as a group of nation states, LSE European Politics and Policy Blog,
ESR#1 Research Model
 The Correlation of Air Pressure & Wind Speed of Hurricane Andrew ESR#1 Research Model Research is about focused communication through clear scientific writing and sharing supporting evidence. The Correlation
GISCO Working Party Meeting. 8 March 2012 Luxembourg. The ESPON 2013 Programme: State of Affairs. Marjan van Herwijnen project expert in the ESPON CU
 GISCO Working Party Meeting 8 March 2012 Luxembourg The ESPON 2013 Programme: State of Affairs Marjan van Herwijnen project expert in the ESPON CU The ESPON 2013 Programme Role in Structural Funds 2007-2013:
EVALUATING THE TOURIST SATISFACTION IN FIVE FAMOUS ITALIAN CITIES
 Rivista Italiana di Economia Demografia e Statistica Volume LXXIII n. 1 Gennaio-Marzo 219 EVALUATING THE TOURIST SATISFACTION IN FIVE FAMOUS ITALIAN CITIES Mariateresa Ciommi, Gennaro Punzo, Gaetano Musella
Do clusters generate greater innovation and growth?
 Do clusters generate greater innovation and growth? Andrés Rodríguez-Pose Department of Geography and Environment London School of Economics and IMDEA, Social Sciences, Madrid IRIS Stavanger, 14 September
Lecture 5. Symbolization and Classification MAP DESIGN: PART I. A picture is worth a thousand words
 Lecture 5 MAP DESIGN: PART I Symbolization and Classification A picture is worth a thousand words Outline Symbolization Types of Maps Classifying Features Visualization Considerations Symbolization Symbolization
AAG CENTER FOR GLOBAL GEOGRAPHY EDUCATION Internationalizing the Teaching and Learning of Geography
 Using the CGGE Materials in Advanced Placement Human Geography Classes About the CGGE: The AAG Center for Global Geography Education (CGGE) is a collection of online modules for undergraduate courses in
Typology of Rural Regions in Europe RUFUS. Johanna Scholz& Sylvia Herrmann. A regional typology as instrument for integrative rural development
 Typology of Rural Regions in Europe A regional typology as instrument for integrative rural development RUFUS Rural Future Networks Workshop Hannover 25-26 August 2010 `Diversities of rural areas in Europe
CHAPTER 9 DATA DISPLAY AND CARTOGRAPHY
 CHAPTER 9 DATA DISPLAY AND CARTOGRAPHY 9.1 Cartographic Representation 9.1.1 Spatial Features and Map Symbols 9.1.2 Use of Color 9.1.3 Data Classification 9.1.4 Generalization Box 9.1 Representations 9.2
D ESK A TLAS.COM MAPS N YSTROM NYSTROM. Name
 MAPS A TLAS.COM Exploring NystromDeskAtlas.com The resources in NystromDeskAtlas.com will help you learn more about our world. The site s maps, graphs, photos, and links offer a wealth of information about
FROM PHYSICAL TO DIGITAL SPACES Exploring space-time mobility through a telegeomonitoring approach
 1 July 2016 Session 7: The potential of open data and big data for territorial information designed to respond to the PT07 Mainstreaming Gender Equality and Promoting Work Life Balance (2nd Open Call -Support
Talking feet: Scatterplots and lines of best fit
 Talking feet: Scatterplots and lines of best fit Student worksheet What does your foot say about your height? Can you predict people s height by how long their feet are? If a Grade 10 student s foot is
PART A Project summary
 PART A Project summary A.1 Project identification Project title Project acronym Name of the lead partner organisation in English Specific objective Demonstrattion AF DAF Partner 1.1. Improving innovation
Book Review: A Social Atlas of Europe
 Book Review: A Social Atlas of Europe Ferreira, J Author post-print (accepted) deposited by Coventry University s Repository Original citation & hyperlink: Ferreira, J 2015, 'Book Review: A Social Atlas
A human atlas of Europe? A continent united in diversity
 A human atlas of Europe? A continent united in diversity Dimitris Ballas Department of Economic Geography Faculty of Spatial Sciences, University of Groningen e-mail: d.ballas@rug.nl twitter: @dimitris_ballas
DM-Group Meeting. Subhodip Biswas 10/16/2014
 DM-Group Meeting Subhodip Biswas 10/16/2014 Papers to be discussed 1. Crowdsourcing Land Use Maps via Twitter Vanessa Frias-Martinez and Enrique Frias-Martinez in KDD 2014 2. Tracking Climate Change Opinions
Graphing. LI To practice reading and creating graphs
 Graphing LI To practice reading and creating graphs Countries Quiz Write down the name of the country as their flag appears on the screen some may be revision! What country does this flag belong to? What
CHANGES IN THE STRUCTURE OF POPULATION AND HOUSING FUND BETWEEN TWO CENSUSES 1 - South Muntenia Development Region
 TERITORIAL STATISTICS CHANGES IN THE STRUCTURE OF POPULATION AND HOUSING FUND BETWEEN TWO CENSUSES 1 - South Muntenia Development Region PhD Senior Lecturer Nicu MARCU In the last decade, a series of structural
Intro to GIS Summer 2012 Data Visualization
 Intro to GIS Summer 2012 Data Visualization UNDERSTANDING YOUR MAP DATA Qualitative vs. Quantitative Data Qualitative Data classified by category e.g. Soil types, Animal Species Quantitative Data grouped
Study Guide Unit 6 Economics and Development
 Name Period Study Guide Unit 6 Economics and Development When you are asked to sketch maps, please put a key so that you can remember what the colors mean! Chapter 9: Development How does the author introduce
Massachusetts Institute of Technology Department of Urban Studies and Planning
 Massachusetts Institute of Technology Department of Urban Studies and Planning 11.204: Planning, Communications & Digital Media Fall 2002 Lecture 6: Tools for Transforming Data to Action Lorlene Hoyt October
Spotlight on Population Resources for Geography Teachers. Pat Beeson, Education Services, Australian Bureau of Statistics
 Spotlight on Population Resources for Geography Teachers Pat Beeson, Education Services, Australian Bureau of Statistics Population Population size Distribution Age Structure Ethnic composition Gender
Switching to AQA from Edexcel: Draft Geography AS and A-level (teaching from September 2016)
") Switching to AQA from Edexcel: Draft Geography AS and A-level (teaching from September 2016) If you are thinking of switching from OCR to AQA (from September 2016), this resource is an easy reference guide.
Switching to AQA from Edexcel: Draft Geography AS and A-level (teaching from September 2016) If you are thinking of switching from OCR to AQA (from September 2016), this resource is an easy reference guide.
Module 5: Function Composition
 Haberman / Kling MTH 111c Section I: Sets and Functions Module 5: Function Composition In The Algebra of Functions (Section I: Module 4) we discussed adding, subtracting, multiplying, and dividing functions.
Basic Training Battlemind to Home Symposium. Sept
 Basic Training Battlemind to Home Symposium Sept 2017 1 What is Measuring Communities? A social indicators project which allows users to obtain military-specific information about communities strengths
Data Matrix User Guide
 Data Matrix User Guide 1. Introduction The 2017 Data Matrix is designed to support the 2017 iteration of the Regional Skills Assessments (RSAs) in Scotland. The RSAs align with the Regional Outcome Agreement
Geographic Data Science - Lecture IV
 Geographic Data Science - Lecture IV Mapping Data Dani Arribas-Bel Today Mapping data MAUP Choropleths Definition Classes Cartograms Conditional maps Space-Time mapping Data maps Abstraction from the purely
Geography 360 Principles of Cartography. April 17, 2006
 Geography 360 Principles of Cartography April 17, 2006 Outlines Cartographic design principles Enhancing visual hierarchies on maps Kinds of numerical data and color scheme What is proportional symbol
Different types of maps and how to read them.
 Different types of maps and how to read them. A map is a picture or representation of the Earth's surface, showing how things are related to each other by distance, direction, and size. Maps have been
Methodological issues in the development of accessibility measures to services: challenges and possible solutions in the Canadian context
 Methodological issues in the development of accessibility measures to services: challenges and possible solutions in the Canadian context Alessandro Alasia 1, Frédéric Bédard 2, and Julie Bélanger 1 (1)
Sampling, Frequency Distributions, and Graphs (12.1)
") 1 Sampling, Frequency Distributions, and Graphs (1.1) Design: Plan how to obtain the data. What are typical Statistical Methods? Collect the data, which is then subjected to statistical analysis, which
1 Sampling, Frequency Distributions, and Graphs (1.1) Design: Plan how to obtain the data. What are typical Statistical Methods? Collect the data, which is then subjected to statistical analysis, which
Solving Equations by Adding and Subtracting
 SECTION 2.1 Solving Equations by Adding and Subtracting 2.1 OBJECTIVES 1. Determine whether a given number is a solution for an equation 2. Use the addition property to solve equations 3. Determine whether
COMMISSION ON ACCREDITATION 2017 ANNUAL REPORT ONLINE
 COMMISSION ON ACCREDITATION 2017 ANNUAL REPORT ONLINE SUMMARY DATA: DOCTORAL PROGRAMS ^Table titles are hyperlinks to the tables within this document INTRODUCTION The Annual Report was created in 1998
SOCIAL STUDIES GRADE 6. I Can Checklist REGIONS AND PEOPLE OF THE EASTERN HEMISPHERE. Office of Teaching and Learning Curriculum Division
 SOCIAL STUDIES REGIONS AND PEOPLE OF THE EASTERN HEMISPHERE GRADE 6 I Can Checklist 2018-2019 Aligned with Ohio s Learning Standards for Social Studies Office of Teaching and Learning Curriculum Division
2. Defining fisheries areas
 What does fisheries area mean in the context of the EFF? Axis 4 of the European Fisheries Fund (EFF) is different from the other three Axes in that it targets fisheries areas (it is titled Sustainable
Contents. Introduction 6. Aries At a glance 9 Your year ahead for Month-by-month forecasts 17
 Contents Introduction 6 Aries At a glance 9 Your year ahead for 2013 10 Month-by-month forecasts 17 Taurus At a glance 47 Your year ahead for 2013 48 Month-by-month forecasts 56 Gemini At a glance 84 Your
Key elements An open-ended questionnaire can be used (see Quinn 2001).
.") Tool Name: Risk Indexing What is it? Risk indexing is a systematic approach to identify, classify, and order sources of risk and to examine differences in risk perception. What can it be used assessing
Tool Name: Risk Indexing What is it? Risk indexing is a systematic approach to identify, classify, and order sources of risk and to examine differences in risk perception. What can it be used assessing
The ESPON Programme and the use of spatial data on the European level
 The ESPON Programme and the use of spatial data on the European level Plan4Business project ISOCARP Brussels Liaison Office 29 November 2013 Marjan van Herwijnen Project Expert - ESPON Coordination Unit
SPINCAM Kathy Belpaeme, province West-Flanders. Ostend, 16 februari 2016
 SPINCAM Kathy Belpaeme, province West-Flanders Ostend, 16 februari 2016 The Belgian coast in a glace www.kustatlas.be The atlas in 2004 The website in 2005: The same look and feel Available in 4 languages
Merging statistics and geospatial information
 Merging statistics and geospatial information Demography / Commuting / Spatial planning / Registers Mirosław Migacz Chief GIS Specialist Janusz Dygaszewicz Director Central Statistical Office of Poland
St. James C of E Primary School
 St. James C of E Primary School Geography Policy St. James C of E Primary School Geography Policy Written by: Lisa Harford Written: April 2016 Reviewed: April 2018 1. Introduction Geography is concerned
Name Lab Instructor Miles
 EXERCISE EUROPEAN WORLD REGION Name Lab Instructor Time of Class Lab Due Date N W E S 0 300 600 Miles Figure 2.1 Europe Directions Part I and Part II are homework. Do Not Turn Part I and Part II me. I
GIS FOR MAZOWSZE REGION - GENERAL OUTLINE
 GIS FOR MAZOWSZE REGION - GENERAL OUTLINE S. Bialousz 1), K Mączewski 2), E. Janczar 2), K. Osinska-Skotak 1) 1) Warsaw University of Technology, Warsaw, Poland 2) Office of the Surveyor of the Mazowieckie
C/W Qu: How is development measured? 13/6/12 Aim: To understand how development is typically measured/classified and the pros/cons of these
 C/W Qu: How is development measured? 13/6/12 Aim: To understand how development is typically measured/classified and the pros/cons of these Starter: Comment on this image Did you spot these? Rubbish truck
Classroom Activities/Lesson Plan
 Grade Band: Middle School Unit 18 Unit Target: Earth and Space Science Unit Topic: This Is the Solar System Lesson 3 Instructional Targets Reading Standards for Informational Text Range and Level of Text
Economic development in rural regions in the EU: empirical findings and theories
 Economic development in rural regions in the EU: empirical findings and theories Presentation at the IAMO Forum 2013 Rural areas in transition, June 19-21, 2013 Dr. Ida Terluin, Agricultural Economics
Energy and U.S. Consumers
 Energy and U.S. Consumers June 3, 2014 Sheril Kirshenbaum Director of The Energy Poll Impartial and authoritative source of public perspectives on energy to inform and guide discussion, business planning
SPATIAL COVERAGE guidelines. Version number 1.0 April 2012
 SPATIAL COVERAGE guidelines Version number 1.0 April 2012 Disclaimer The material contained in the Spatial coverage guidelines is for general information purposes only. Any use of the material is at your
1. Richard Milton 2. Steven Gray 3. Oliver O Brien Centre for Advanced Spatial Analysis (UCL)
") UCL CENTRE FOR ADVANCED SPATIAL ANALYSIS Apps Delivering Information to Mass Audiences 1. Richard Milton 2. Steven Gray 3. Oliver O Brien Centre for Advanced Spatial Analysis (UCL) Scott Adams 1995 The
UCL CENTRE FOR ADVANCED SPATIAL ANALYSIS Apps Delivering Information to Mass Audiences 1. Richard Milton 2. Steven Gray 3. Oliver O Brien Centre for Advanced Spatial Analysis (UCL) Scott Adams 1995 The
ENV208/ENV508 Applied GIS. Week 2: Making maps, data visualisation, and GIS output
 ENV208/ENV508 Applied GIS Week 2: Making maps, data visualisation, and GIS output Overview GIS Output Map Making Types of Maps Key Elements GIS Output Formats Table Graph Statistics Maps Map Making Maps
Republic of Korea in Czech atlases and geography textbooks. Jan Ptacek, Kartografie Praha
 Republic of Korea in Czech atlases and geography textbooks Jan Ptacek, Kartografie Praha Schools in the Czech republic Primary schools 9 years (age 6 15) Geography from the age of 11, only one year of
Introduction to Linear Regression Analysis
 Introduction to Linear Regression Analysis Samuel Nocito Lecture 1 March 2nd, 2018 Econometrics: What is it? Interaction of economic theory, observed data and statistical methods. The science of testing
Geog183: Cartographic Design and Geovisualization Winter Quarter 2017 Lecture 6: Map types and Data types
 Geog183: Cartographic Design and Geovisualization Winter Quarter 2017 Lecture 6: Map types and Data types Data types Data dimension: Point, Line, Area, Volume (Text) Data continuity: Discrete, Point, Polygon:
Thank you for your interest in the Support Resistance Strength Analyzer!
 This user manual refer to FXCM s Trading Station version of the indicator Support Resistance Strength Analyzer Thank you for your interest in the Support Resistance Strength Analyzer! This unique indicator
Overview. GIS Data Output Methods
 Overview GIS Output Formats ENV208/ENV508 Applied GIS Week 2: Making maps, data visualisation, and GIS output GIS Output Map Making Types of Maps Key Elements Table Graph Statistics Maps Map Making Maps
Observe Reflect Question What type of document is this?
 Appendix 2 An Empty Primary Source Analysis Tool and a Full Primary Source Analysis Tool with Guiding Questions Observe Reflect Question What type of document is this? What is the purpose of this document?
Geography Undergraduate
 Geography Undergraduate Bristol pushes its students to try and help them reach their full potential. This means you re made to analyse, to challenge your preconceived ideas and to push yourself intellectually
How rural the EU RDP is? An analysis through spatial funds allocation
 How rural the EU RDP is? An analysis through spatial funds allocation Beatrice Camaioni, Roberto Esposti, Antonello Lobianco, Francesco Pagliacci, Franco Sotte Department of Economics and Social Sciences
The European territory: Strategic developmentd
 The European territory: Strategic developmentd Peter Mehlbye Workshop Strategic Development Catalonia 11 June 2002 THE LECTURE Structure I. Territorial trends II. Strategy for European spatial development
Visual Studies Exercise, Assignment 07 (Architectural Paleontology) Geographic Information Systems (GIS), Part II
 Geographic Information Systems (GIS), Part II") ARCH1291 Visual Studies II Week 8, Spring 2013 Assignment 7 GIS I Prof. Alihan Polat Visual Studies Exercise, Assignment 07 (Architectural Paleontology) Geographic Information Systems (GIS), Part II Medium:
ARCH1291 Visual Studies II Week 8, Spring 2013 Assignment 7 GIS I Prof. Alihan Polat Visual Studies Exercise, Assignment 07 (Architectural Paleontology) Geographic Information Systems (GIS), Part II Medium:
Spatial Data Infrastructures in Greece: State of play Spring 2003
 Spatial Data Infrastructures in : State of play Spring 2003 Country report on SDI elaborated in the context of a study commissioned by the EC (EUROSTAT & DGENV) in the framework of the INSPIRE initiative
Learning Target : Describe the purposes and uses of different types of maps.
 Learning Target : Describe the purposes and uses of different types of maps. Directions: 1. Below, place a where you think you are located. 2. In which continent are you located? 3. In which country are
This term refers to the physical quantity that is the result of the measurement activity.
 Metrology is the science of measurement and involves what types of measurements are possible, standards, how to properly represent a number and how to represent the uncertainty in measurement. In 1993
A is one of the categories into which qualitative data can be classified.
 Chapter 2 Methods for Describing Sets of Data 2.1 Describing qualitative data Recall qualitative data: non-numerical or categorical data Basic definitions: A is one of the categories into which qualitative