How proximity to a city influences the performance of rural regions by Lewis Dijkstra and Hugo Poelman
|
|
|
- Julius Kelly
- 6 years ago
- Views:
Transcription
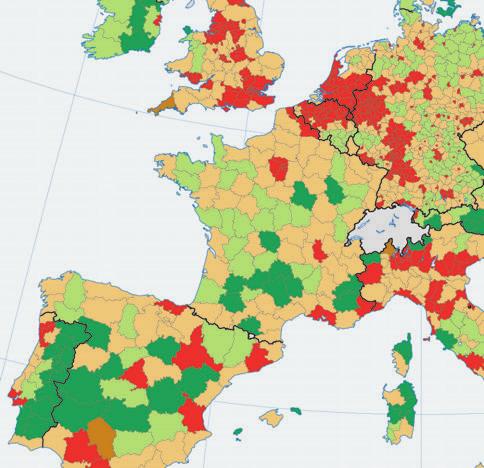
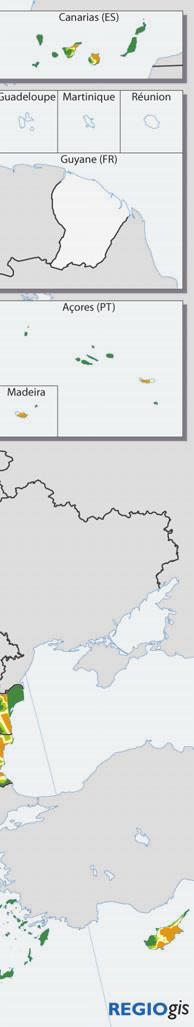
1 n 01/2008 Regional Focus A series of short papers on regional research and indicators produced by the Directorate-General for Regional Policy Remote Rural Regions How proximity to a city influences the performance of rural regions by Lewis Dijkstra and Hugo Poelman 1. Introduction This short paper describes the characteristics of remote rural regions and how remoteness can be defined and measured. This new approach combines a new classification of remoteness, based on driving time to the closest city, with the OECD classification of regions into predominantly urban, intermediate and predominantly rural regions1. rate. This stands in clear contrast to rural regions close to a city which saw better results for these two indicators. The scores obtained by rural areas close to a city were almost identical to the EU-27 average. GDP per head is the lowest in remote rural regions, three index points below rural regions close to a city and substantially lower than in intermediate and urban regions3. 2. Remote rural regions An analysis of sectoral productivity shows that remote rural regions consistently have the lowest productivity in agriculture, industry and services. Productivity in rural regions close to a city in all three sectors is at least 10 index points higher. The distinction between rural regions close to a city and remote rural regions reveals significant differences. Remote rural regions are the only group with a negative population growth. The average population density in remote rural regions is half that of rural regions close to a city. The low overall population density and the absence of a nearby city are probably the main reasons why access levels to passenger flights in remote rural regions are so low. Remote rural regions have the highest share of GVA in the agriculture sector, but also the lowest productivity in this sector. Remote rural regions have a similar share of GVA in industry to intermediate regions, but industrial productivity is more than 20% below average in remote rural regions, while it is just above average in intermediate regions. Rural regions close to a city have a higher share of industrial GVA than remote rural regions (32% as compared to 29%) with productivity also being higher in rural regions close to a city (88% of the EU-27 average as opposed to 77%). A comparison between regional population trends and national population trends reveals that remote rural regions are far more likely to have suffered a reduction in the share of their country s population. Four out of five remote rural regions either had a loss of population or grew more slowly than their country s growth rate. The same is true for their share of national GDP2. Almost three out of four regions saw their GDP shrink or grow more slowly than their country s (1) For ease of reading, predominantly will not be used in the rest of the text. For example, predominantly urban regions becomes urban regions, and predominantly rural regions becomes rural regions. (2) Because changes in population and GDP between 1995 and 2004 varied significantly between countries, a simple analysis of growing or shrinking regions may distort the figures. For example, some categories may appear to have grown because more of the regions in these countries are located in countries experiencing rapid growth, however in reality the regions in this category all grew more slowly than the country they are located in. A more accurate approach is therefore to analyse changes in the share of the national GDP or population. (3) GDP per head in urban regions may be artificially high due to commuting. Nevertheless, it would still be higher than in rural areas if the figures could be corrected for this bias. 1
2 Table 1: Characteristics of predominantly urban, close and remote intermediate regions and close and remote predominantly rural regions Predominantly Urban Intermediate Total Close to a city Predominantly rural Remote Total Close to a city EU-27 Remote Average annual % change in population, % of regions with a reduced share of national population % of regions with a reduced share of national GDP Population density in 2004 inhabitants/km GDP per head 2004, EU-27= Access to flights Number of NUTS3 regions Share of NUTS3 regions in % Total population in 0s Share of population in %, 2004 Table 2: Productivity by sector and share of GVA by sector for urban, intermediate and rural regions (2004) Urban Intermediate Total Close to a city Rural Remote Total EU-27 Close to a city Remote Productivity 2004, EU-27= Agriculture Industry Services Industry Services Share of GVA in 2004 Agriculture 2
3 In terms of services, remote rural regions have a slightly higher share than rural regions close to a city, but again with significantly lower productivity. The analysis of remoteness significantly reduces the impact of the two geographic limitations mentioned above. The distortion created by the variation in size of the local units is alleviated by identifying all cities over inhabitants in a harmonised manner throughout the EU. In this analysis, small LAU2s have been grouped to created individual cities, and within very large LAU2s, cities have been identified by using a population grid and land cover map. This removes part of the bias stemming from the different sizes of local units. The influence of neighbouring regions is introduced by calculating the driving time to cities over across regional boundaries. The lower level of GDP per head in remote rural regions is in part caused by low productivity in each sector as well as the relatively high share of GVA in the agricultural sector. 3. OECD classification combined with remoteness 3.1. OECD classification into urban, intermediate and rural regions Of the rural regions, 37% were considered remote. The intermediate regions were almost all considered close to a city (96%), which is a reflection of their nature. These are typically regions which may either be close to a large city or have one or more smaller cities in the region. Given that only 21 intermediate regions were classified as remote, representing only 1% of the EU-27 population, this category is perhaps not the most pertinent from an analytical point of view. Urban regions were, by default, considered to be close to a city. The OECD classification is based on the share of a region s population living in rural local units. Rural local units in Europe are defined as local administrative units (LAU1 or 2) with a population density below 150 inhabitants/km2. In rural regions, more than 50% live in rural local units. In intermediate regions, between 15% and 50% live in rural local units. In urban regions, less than 15% live in rural local units Why is proximity to a city relevant for rural regions? If a region has an urban centre, a rural region may be reclassified as intermediate, or an intermediate region as urban, depending on the size of the urban centre. Access to a city is an indicator of access to a wide range of services and opportunities. For example, cities with over people are more likely to offer diverse employment opportunities, higher education, specialised health care, a sizeable local market, shops and services such as banking. All of these aspects influence the region s capacity to attract and retain people and also its labour productivity. However, from a geographical point of view, the OECD classification does have two shortcomings: 1) the outcome of this approach depends to a large degree on the size of local units and the regions; and 2) this approach does not take into account the characteristics of adjacent regions. For example, in several EU Member States, NUTS3 regions separate cities from their surroundings. The NUTS3 city is classified as urban and the surroundings as rural. If these NUTS3 regions were combined into a single region, it would be classified as intermediate or even urban. In countries with very large local units, units with a small urban centre would be considered rural due to the low overall density4. 4. Why cities over inhabitants and why 45 minutes driving time? For the city size, two different groups were examined: around 500 cities with at least 000 inhabitants and around 900 cities with at least inhabitants. Proximity to a city is used here as an indicator of access to services and jobs. Therefore, the question is whether or not cities over have such services. This varies from Member State to Member State, but notably in Member States with few cities of more than 000 inhabitants. These smaller cities tend to play an important role when it comes to providing services. In Finland for example, cities like Joensuu, Rovaniemi and Vaasa, each with approximately inhabitants, have a university, polytechnic or both. This is also the case in Slovakia where Žilina, Banská Bystrica and Prešov, all cities with around inhabitants, each have a university Remoteness and proximity to a city A region is considered close to a city if more than half of its residents can drive to the centre of a city of at least inhabitants within 45 minutes. Conversely, if less than half its population can reach a city within 45 minutes, it is considered remote. (For more detail, see the methodology section.) (4) For more information on the OECD classification, see: OECD Regional Typology: Updated Statistics. 12 November 2007, GOV/TDPC/TI(2007)8 by OECD, Paris. 3
4 The impact of excluding cities with inhabitants between and 000 is substantial in these two countries. In Slovakia, five out of eight regions would be remote when considering only cities over 000, while all regions would be close to a city if cities above were included. In Finland, including cities with more than inhabitants would decrease the number of remote regions from 15 to 9 out of a total of 20 regions. 5. Conclusion The distinction between remote rural regions and rural regions close to a city complements the OECD s regional EU typology in a way which is very relevant to policy making. Remote rural regions are clearly faced with a different set of problems than rural regions close to a city. This is clear from the lower levels of productivity and GDP per head and the declining population of remote rural regions. In Poland, France, the Czech Republic, Bulgaria and Romania, many more regions would also become remote if cities with populations between and 000 were excluded. However, in several countries, both approaches produce the same classification. In the UK, Germany, Spain, Portugal, the Netherlands, Belgium and Hungary, it makes very little difference whether all cities over are included or only those above Methodology The proposed urban/rural typology combines two dimensions: categorisation based on local population density and on the presence of main cities; Table 3: Number and share of remote regions according to travel time categorisation based on the remoteness of regions, compared to city centres. Driving Time 30 Minutes 45 Minutes 6.1. Categorisation according to population density 60 Minutes % 13% 9% NUTS3 regions can be categorised as urban, intermediate or rural, using the OECD methodology of categorisation of TL3 regions5. For the driving time to cities over , three thresholds were considered: 30, 45 or 60 minutes. The driving time was calculated from the city centre. Therefore, for large cities, driving time from the edge of the city to the centre was often 30 minutes or more. However, people do not necessarily need to reach the city centre to access some of the jobs or services. The impact of travel time on the share of remote regions is also worth considering. Using 30 minutes means that one in four regions were remote. At the other extreme, 60 minutes means that less than one in ten were remote. Using 45 minutes, a reasonable maximum daily commuting time, saw one in eight regions classified as remote with a plausible geographic pattern. As the OECD does not cover all EU Member States, and the TL3 breakdown is not identical to the NUTS3 breakdown, the OECD methodology has been reproduced to categorise the NUTS3 regions outside the OECD TL3 scope. This involved using LAU2 population density data, categorising NUTS3 regions according to local density patterns, and taking into account the presence of bigger cities in intermediate or rural regions. For the latter step, we used the Urban Audit (2007) cities to identify the presence of bigger cities Assessment of remoteness of regions All NUTS3 regions can be characterised as remote or close to a city, depending on the distribution of the regional population in relation to selected cities. In our definition, a region is labelled remote if at least half of its population lives at more than 45 minutes by road from any city of at least inhabitants. For a region to be considered remote, more than half of its population needs to live more than 45 minutes away from a city. The choice to use at least 50% ensures that the designation of remote or close applies to the majority of the residents. The main goal in establishing this classification was to make a clear distinction between rural regions with different development patterns. The combination of cities over and 45 minutes revealed the most marked distinction between rural regions Estimating accessibility around cities The accessibility by road of city centres is estimated by creating service areas around points representing cities of at least inhabitants. To define the city points, (5) See footnote 4. 4
5 preference is given to the Urban Audit6 cities with more than inhabitants. These cities were defined taking into account the size of local administrative units (LAU2). In countries with very small LAU2s, these were grouped, as for example in France. In countries with very large local units, the distribution of the population within these units was seen as determining whether or not an urban centre over a certain size existed. This was used in the case of several Nordic and UK cities. In a similar way, an approximation of congestion risks is derived from the urban morphological zones (UMZ). The road network is overlaid with the extent of the urban morphological zones, i.e. with a generalised version of the main built-up areas. When a road crosses a UMZ, the crossing time is multiplied by 1.5 on motorways, and by 2 on other roads Estimating population in remote areas To estimate the regional population living close to cites or in more remote areas, we need the population distribution over the entire territory. This distribution is modelled using the population disaggregation grid as produced by the Joint Research Centre9. By overlaying the population grid with the service areas, we obtain an estimate of regional population inside and outside the service areas. To obtain a more complete collection of cities, points were added for the urban morphological zones7 (UMZ) of more than inhabitants, provided that they did not coincide with Urban Audit cities. Urban morphological zones are defined by the European Environmental Agency based on clusters of urban land use classes, which ensures that the size of local administrative units does not distort the outcome. The population of these UMZ is estimated using a raster-based population distribution8. It has to be noted that the population distribution given by the disaggregation grid tends to underestimate populations in urban areas. Yet this underestimation is constrained within the limits of the LAU2 units. Where LAU2 units are reasonably small, the error incurred can be disregarded. The situation is more problematic in sparsely populated areas with large LAU2 units. To overcome this problem, the population distribution for Sweden10 and Finland11 was taken from grids representing registered population, instead of the modelled distribution. Around all the selected cities, service areas representing a maximum travel time of 45 minutes were created. Once these merge, the entire territory of the Union is divided into two types of area: those close to cities, and those that are more remote Estimating distances by road The initial road network needed to be adapted to obtain a more realistic estimate of travel time. The calculated population outside the 45 minute service areas is expressed as a percentage of the total regional population. Where the percentage exceeds 50%, the NUTS3 region is labelled remote. Speed limits are attributed to road segments, taking into account the road category and a table of speed limits by category and country. The resulting crossing time per road segment is further adjusted to take into account the influence of the terrain and congestion risks Combining the two dimensions of the categorisation The final typology combines the two dimensions previously discussed, by creating five classes of NUTS3 regions: An approximation of the influence of the terrain is derived from the digital terrain model. The slope raster, calculated from the terrain model, is re-classified into 3 slope classes. The road network is overlaid with these slope classes. Each resulting road segment receives an index, according to the slope class. For slopes of 0 to 5%, the index is 1. For slopes of 6 to 10%, the index is 1.2, whereas for slopes of 11% or more, the index is 1.5. The indices are used as impedances on speed. Thus, the initial crossing time is multiplied by the slope index to take into account the average slope conditions related to the segment. urban regions intermediate regions close to a city intermediate, remote regions rural regions close to a city rural, remote regions. (6) For more information on the Urban Audit, please consult the Eurostat website where methodological information and the latest data can be found. In addition, provides information in a format easily accessible to a wide audience. (7) European Environmental Agency, 2007, Urban morphological zones 2000, EEA, Copenhagen. (8) See footnotes 9, 10 and 11. (9) Joint Research Centre, 2007, Population density disaggregated with CORINE land cover 2000, EEA, Copenhagen. (10) Sources: raster data on population in Sweden: Statistics Sweden. (11) Sources: raster data on population in Finland: Statistics Finland, Population Statistics. 5
6 6.4. Perspectives for further analysis 6.5. Data sources It should be remembered that the results of this analysis are dependent on the quality and availability of several data sources. The strength of the current approach clearly lies in the fact that harmonised definitions and data sets have been used where possible. However, an analysis based on better and/or more precise data might yield different results. The analysis required the following data sources: Regional boundaries: NUTS3 boundaries, corresponding to the NUTS breakdowns valid in 2008 and in 2007 (GISCO and REGIO-GIS); local (LAU2) boundaries, corresponding to the census status, and combined with LAU2 censusbased population and population-density figures (GISCO); The following have been identified as possible areas for improvement and/or further analysis: the OECD definition of urban/rural areas initially uses urban/rural classification of TL3 regions by the OECD; road network: EuroGlobalMap network population density at LAU2 level. Consequently, the results are dependent on the size of the LAU2 units, which is somewhat variable from country to country. An alternative method could be to test the use of a density threshold at raster cell level; (EuroGeographics Association), completed with GISCO road network segments for missing countries (especially Bulgaria); digital elevation model (GISCO DEM_WD_3M); point locations of Urban Audit 2007 cities (REGIO-GIS) the road network used should be as complete and harmonised as possible, in terms of both thematic extent (road categories, density) and time stamp. The use of a more detailed road network (e.g. EuroRegionalMap) would yield more precise and smaller service areas, and consequently result in larger remote areas; and of Urban Morphological Zones (UMZ) (EEA). This point layer is available on the Inforegio webpage where this paper is published: extent of morphological agglomerations: UMZ layer slope impedances are clearly dependent on the (EEA); resolution of the digital terrain model. The use of a more precise DEM could be tested (e.g. SRTM), especially in combination with a more precise road network; population disaggregation grid (JRC), combined with raster results of registered populations for Sweden and Finland (NSIs, processed by REGIO-GIS). the collection of city points currently contains Urban The regional classification of all NUTS3 regions can be found in a spreadsheet on the Inforegio webpage where this paper is published: Audit cities and additional UMZ centroids. This implies some mixture of functional, administrative and morphological definitions; the results of the typology would gain in precision if they could use a population raster based on recent and registered population figures, rather than on a modelled population distribution. 6


7 7
8 Any question, comment, contribution should be sent to the following address: Consult this website for further information: Editor: Nicola DE MICHELIS, European Commission, Regional Policy The texts of this publication do not bind the Commission.
Refinement of the OECD regional typology: Economic Performance of Remote Rural Regions
 [Preliminary draft April 2010] Refinement of the OECD regional typology: Economic Performance of Remote Rural Regions by Lewis Dijkstra* and Vicente Ruiz** Abstract To account for differences among rural
THE NEW DEGREE OF URBANISATION
 THE NEW DEGREE OF URBANISATION EXECUTIVE SUMMARY This paper describes the new degree of urbanisation classification as approved by the Eurostat Labour Market Working Group in 2011. This classification
Compact guides GISCO. Geographic information system of the Commission
 Compact guides GISCO Geographic information system of the Commission What is GISCO? GISCO, the Geographic Information System of the COmmission, is a permanent service of Eurostat that fulfils the requirements
Vít PÁSZTO Karel MACKŮ
 What is a rural region? A comparative study on Eurostat data and methods for rural areas delimitation Vít PÁSZTO Karel MACKŮ Department of Geoinformatics, Faculty of Science, Palacký University Olomouc,
How the science of cities can help European policy makers: new analysis and perspectives
 How the science of cities can help European policy makers: new analysis and perspectives By Lewis Dijkstra, PhD Deputy Head of the Economic Analysis Unit, DG Regional and European Commission Overview Data
Growth Trends and Characteristics of OECD Rural Regions
 Please cite this paper as: Garcilazo, E. (2013), Growth Trends and Characteristics of OECD Rural Regions, OECD Regional Development Working Papers, 2013/10, OECD Publishing, Paris. http://dx.doi.org/10.1787/5k4522x3qk9q-en
USING DOWNSCALED POPULATION IN LOCAL DATA GENERATION
 USING DOWNSCALED POPULATION IN LOCAL DATA GENERATION A COUNTRY-LEVEL EXAMINATION CONTENT Research Context and Approach. This part outlines the background to and methodology of the examination of downscaled
Typology of Rural Regions in Europe RUFUS. Johanna Scholz& Sylvia Herrmann. A regional typology as instrument for integrative rural development
 Typology of Rural Regions in Europe A regional typology as instrument for integrative rural development RUFUS Rural Future Networks Workshop Hannover 25-26 August 2010 `Diversities of rural areas in Europe
Populating urban data bases with local data
 Populating urban data bases with local data (ESPON M4D, Géographie-cités, June 2013 delivery) We present here a generic methodology for populating urban databases with local data, applied to the case of
Urban settlements delimitation using a gridded spatial support
 Urban settlements delimitation using a gridded spatial support Rita Nicolau 1, Elisa Vilares 1, Cristina Cavaco 1, Ana Santos 2, Mário Lucas 2 1 - General Directorate for Territory Development DGT, Portugal
Changes in population and industries in the rural areas of Finland: from analysis of administrative regions to a GIS based approach
 Toivo Muilu*, Jarmo Rusanen** * University of Oulu, Department of Geography, Agrifood Research Finland, Ruukki Research Station P.O. Box 3000, FIN-90014, Finland toivo.muilu@oulu.fi ** University of Oulu,
TOWNs in Europe. Loris Servillo. Luxemburg, 12 December 2014
 Luxembourgish Small and Medium-Sized Towns in Europe: Challenges and Opportunities Ministère du Développement durable et des Infrastructures Luxemburg-Kirchberg TOWNs in Europe Loris Servillo Luxemburg,
ANNEX 2: Defining and measuring rurality. Prepared by Dr Steve Goss
 ANNEX 2: Defining and measuring rurality Prepared by Dr Steve Goss June 2013 1 TABLE OF CONTENTS 1 Definitions of rurality in common use... 2 1.1 Measuring rurality... 2 1.1.1 OECD rural urban division...
TERCET: A European regulation on statistical units and territorial typologies
 TERCET: A European regulation on statistical units and territorial typologies NUAC Meeting 10 May 2016 Eurostat Unit E4 Regulation (EC) No 1059/2003: - Establishes a classification of territorial units
Towards indicators of proximity to services in Europe's major cities
 Towards indicators of proximity to services in Europe's major cities Enhancing the analytical use of the GMES Urban Atlas in combination with population distribution data Hugo Poelman European Commission
The European regional Human Development and Human Poverty Indices Human Development Index
 n 02/2011 The European regional Human Development and Human Poverty Indices Contents 1. Introduction...1 2. The United Nations Development Programme Approach...1 3. Regional Human Development and Poverty
BUILDING SOUND AND COMPARABLE METRICS FOR SDGS: THE CONTRIBUTION OF THE OECD DATA AND TOOLS FOR CITIES AND REGIONS
 BUILDING SOUND AND COMPARABLE METRICS FOR SDGS: THE CONTRIBUTION OF THE OECD DATA AND TOOLS FOR CITIES AND REGIONS STATISTICAL CAPACITY BUILDING FOR MONITORING OF SUSTAINABLE DEVELOPMENT GOALS Lukas Kleine-Rueschkamp
Developing a global, people-based definition of cities and settlements
 Developing a global, people-based definition of cities and settlements Cooperation between: Directorate General for Regional and, Joint Research Centre, EUROSTAT (European Commission, European Union) OECD,
Developing a global, peoplebased definition of cities and settlements
 Developing a global, peoplebased definition of cities and settlements By Lewis Dijkstra, Lewis.Dijkstra@ec.europa.eu Head of the Economic Analysis Sector DG for Regional and Urban Policy, Regional & Urban
ESPON Typology Compilation. Kai Böhme Sabine Zillmer, Kai Pflanz, Tomas Hanell & Petteri Niemi
 ESPON Typology Compilation Kai Böhme Sabine Zillmer, Kai Pflanz, Tomas Hanell & Petteri Niemi Scope of the study Tasks Compilation / assessment of existing typologies of typologies for ESPON Interim report
Territorial evidence for a European Urban Agenda TOWN in Europe
 Territorial evidence for a European Urban Agenda TOWN in Europe Loris Servillo Brussels, 25 November 2014 Outline 1. SMSTs in the EU territory 2. General vs specific trends? 3. Evidences for more appropriated
European Regional and Urban Statistics
 European Regional and Urban Statistics Dr. Berthold Feldmann berthold.feldmann@ec.europa.eu Eurostat Structure of the talk Regional statistics in the EU The tasks of Eurostat Regional statistics Urban
I&CLC2000 in support to new policy initiatives (INSPIRE, GMES,..)
") I&CLC2000 in support to new policy initiatives (INSPIRE, GMES,..) Manfred Grasserbauer, Director Joint Research Centre Institute for Environment and Sustainability 1 IMAGE 2000 European mosaic of satellite
I&CLC2000 in support to new policy initiatives (INSPIRE, GMES,..) Manfred Grasserbauer, Director Joint Research Centre Institute for Environment and Sustainability 1 IMAGE 2000 European mosaic of satellite
Are EU Rural Areas still Lagging behind Urban Regions? An Analysis through Fuzzy Logic
 Are EU Rural Areas still Lagging behind Urban Regions? An Analysis through Fuzzy Logic Francesco Pagliacci Department of Economics and Social Sciences Università Politecnica delle Marche Ancona (Italy)
PROFECY Processes, Features and Cycles of Inner Peripheries in Europe
 PROFECY Processes, Features and Cycles of Inner Peripheries in Europe (Inner Peripheries: National territories facing challenges of access to basic services of general interest) Applied Research Final
Figure 10. Travel time accessibility for heavy trucks
 Figure 10. Travel time accessibility for heavy trucks Heavy truck travel time from Rotterdam to each European cities respecting the prescribed speed in France on the different networks - Road, motorway
Summary and Implications for Policy
 Summary and Implications for Policy 1 Introduction This is the report on a background study for the National Spatial Strategy (NSS) regarding the Irish Rural Structure. The main objective of the study
A WALK TO THE PARK? ASSESSING ACCESS TO GREEN AREAS IN EUROPE'S CITIES
 Working Papers A series of short papers on regional research and indicators produced by the Directorate-General for Regional Policy WP 01/2016 A WALK TO THE PARK? ASSESSING ACCESS TO GREEN AREAS IN EUROPE'S
CHAPTER 6 RURAL EMPOWERMENT
 CHAPTER 6 RURAL EMPOWERMENT While Europe is a highly urbanised continent, 20% of its population live in rural areas. Furthermore, while agriculture accounts for only 2% of its GDP and 5.7% of its employment,
Classifications of the Rural Areas in Bulgaria
 Centre for Research on Settlements and Urbanism Journal of Settlements and Spatial Planning J o u r n a l h o m e p a g e: http://jssp.reviste.ubbcluj.ro Classifications of the Rural Areas in Bulgaria
The Added Value of Geospatial Data in a Statistical Office. Pedro Diaz Munoz Director Sectoral and Regional Statistics EUROSTAT European Commission
 The Added Value of Geospatial Data in a Statistical Office Pedro Diaz Munoz Director Sectoral and Regional Statistics EUROSTAT European Commission Why integrate Responsibility of all the information we
Progress of UN-GGIM: Europe Working Group A on Core Data
 PolicyKEN Budapest 29 November 2016 Progress of UN-GGIM: Europe Working Group A on Core Data François Chirié, Dominique Laurent, IGNF Core data context Background and purpose Aim of Work Group A to propose
How rural the EU RDP is? An analysis through spatial funds allocation
 How rural the EU RDP is? An analysis through spatial funds allocation Beatrice Camaioni, Roberto Esposti, Antonello Lobianco, Francesco Pagliacci, Franco Sotte Department of Economics and Social Sciences
The Governance of Land Use
 The Governance of Land Use Country fact sheet Czech Republic The planning system Levels of government and their responsibilities The Czech Republic is a unitary state with 3 levels of government: the national
Improving rural statistics. Defining rural territories and key indicators of rural development
 Improving rural statistics Defining rural territories and key indicators of rural development Improving rural statistics Improving Rural Statistics In 2016, the Global Strategy to improve Agricultural
Methodological issues in the development of accessibility measures to services: challenges and possible solutions in the Canadian context
 Methodological issues in the development of accessibility measures to services: challenges and possible solutions in the Canadian context Alessandro Alasia 1, Frédéric Bédard 2, and Julie Bélanger 1 (1)
Lecture 9: Location Effects, Economic Geography and Regional Policy
 Lecture 9: Location Effects, Economic Geography and Regional Policy G. Di Bartolomeo Index, EU-25 = 100 < 30 30-50 50-75 75-100 100-125 >= 125 Canarias (E) Guadeloupe Martinique RÈunion (F) (F) (F) Guyane
Kai Böhme Kai Böhme Sabine Zillmer, Kai Pflanz, Tomas Hanell & Petteri Niemi
 ESPON Typology ogy Compilation o Kai Böhme Kai Böhme Sabine Zillmer, Kai Pflanz, Tomas Hanell & Petteri Niemi Scope of the study Tasks Compilation / assessment of existing typologies of typologies for
City definitions. Sara Ben Amer. PhD Student Climate Change and Sustainable Development Group Systems Analysis Division
 City definitions Sara Ben Amer PhD Student Climate Change and Sustainable Development Group Systems Analysis Division sbea@dtu.dk Contents 1. Concept of a city 2. Need for the city definition? 3. Challenges
Key Findings and Policy Briefs No. 2 SPATIAL ANALYSIS OF RURAL DEVELOPMENT MEASURES
 SPATIAL ANALYSIS OF RURAL DEVELOPMENT MEASURES Key Findings and Policy Briefs No. 2 RDP expenditures and their objectives from a spatial perspective: Does funding correspond to needs? RDP expenditures
REGIONAL PATTERNS OF KIS (KNOWLEDGE INTENSIVE SERVICES) ACTIVITIES: A EUROPEAN PERSPECTIVE
 ACTIVITIES: A EUROPEAN PERSPECTIVE") REGIONAL PATTERNS OF KIS (KNOWLEDGE INTENSIVE SERVICES) ACTIVITIES: A EUROPEAN PERSPECTIVE Esther Schricke and Andrea Zenker Fraunhofer-Institut für System- und Innovationsforschung (ISI) Karlsruhe evoreg-workshop
REGIONAL PATTERNS OF KIS (KNOWLEDGE INTENSIVE SERVICES) ACTIVITIES: A EUROPEAN PERSPECTIVE Esther Schricke and Andrea Zenker Fraunhofer-Institut für System- und Innovationsforschung (ISI) Karlsruhe evoreg-workshop
Coastal regions: People living along the coastline and integration of NUTS 2010 and latest population grid
 Statistics in focus (SIF-SE background article) Authors: Andries ENGELBERT, Isabelle COLLET Coastal regions: People living along the coastline and integration of NUTS 2010 and latest population grid Among
International Economic Geography- Introduction
 International Economic Geography- Introduction dr hab. Bart Rokicki Chair of Macroeconomics and Foreign Trade Theory Faculty of Economic Sciences, University of Warsaw Course structure Introduction LocationtheoryI
Enhancing indicators on urban public transport in combination with geostatistics
 Enhancing indicators on urban public transport in combination with geostatistics Hugo Poelman European Commission DG and Urban GIS team April 2015 Harmonised indicators on European cities? EU-OECD definition
Accessibility to urban areas of different sizes
 Working paper/pm 2010:10 Accessibility to urban areas of different sizes - Modelling through indexed accessibility The Swedish Agency for Growth Policy Analysis has developed a tool for measuring and analysing
Labour Market Areas in Italy. Sandro Cruciani Istat, Italian National Statistical Institute Directorate for territorial and environmental statistics
 Labour Market Areas in Italy Sandro Cruciani Istat, Italian National Statistical Institute Directorate for territorial and environmental statistics Workshop on Developing European Labour Market Areas Nuremberg,
Accessibility, rurality, remoteness an investigation on the Island of Sardinia, Italy
 UNIVERSITY OF SASSARI DIPARTIMENTO DI INGEGNERIA DEL TERRITORIO UNIVERSITY OF CAGLIARI DIPARTIMENTO DI FISICA AND DIPARTIMENTO DI INGEGNERIA DEL TERRITORIO Accessibility, rurality, remoteness an investigation
The ESPON Programme. Goals Main Results Future
 The ESPON Programme Goals Main Results Future Structure 1. Goals Objectives and expectations Participation, organisation and networking Themes addressed in the applied research undertaken in ESPON projects
GEORGIA CITIES IN EUROPE AND CENTRAL ASIA METHODOLOGY. Public Disclosure Authorized. Public Disclosure Authorized. Public Disclosure Authorized
 Public Disclosure Authorized Public Disclosure Authorized Public Disclosure Authorized Public Disclosure Authorized CITIES IN EUROPE AND CENTRAL ASIA GEORGIA METHODOLOGY This Country Snapshot was produced
The Combination of Geospatial Data with Statistical Data for SDG Indicators
 Session x: Sustainable Development Goals, SDG indicators The Combination of Geospatial Data with Statistical Data for SDG Indicators Pier-Giorgio Zaccheddu Fabio Volpe 5-8 December2018, Nairobi IAEG SDG
Analysis of travel-to-work patterns and the identification and classification of REDZs
 Analysis of travel-to-work patterns and the identification and classification of REDZs Dr David Meredith, Teagasc, Spatial Analysis Unit, Rural Economy Development Programme, Ashtown, Dublin 15. david.meredith@teagasc.ie
European Landscape Convention in the Slovak Republic
 13th COUNCIL OF EUROPE MEETING OF THE WORKSHOPS FOR THE EUROPEAN LANDSCAPE CONVENTION European Landscape Convention in the Slovak Republic Mrs. Ida Vanáková, state advisor, Department of Spatial Planning
Progress of UN-GGIM: Europe Working Group A on Core Data
 INSPIRE KEN 13 December 2016 Progress of UN-GGIM: Europe Working Group A on Core Data François Chirié, Dominique Laurent, IGN France Plan Introduction Objectives of the working group with respect to INSPIRE
Developing harmonised indicators on urban public transport in Europe
 Developing harmonised indicators on urban public transport in Europe Hugo Poelman European Commission DG Regional and Urban GIS team Regional May 2015 context EU Cohesion European Regional Development
The Governance of Land Use
 The Governance of Land Use COUNTRY FACT SHEET SPAIN The planning system Levels of government and their responsibilities Spain is defined by the OECD as a quasi-federal state with 4 levels of government;
The more, the merrier? Urbanization and regional GDP growth in Europe over the 20th century
 The more, the merrier? Urbanization and regional GDP growth in Europe over the 20th century Kerstin Enflo * Anna Missiaia Joan Rosés Abstract Preliminary draft prepared for the Economic History Society
DEFINING AND MEASURING WORLD-METRO REGIONS FOR INTERNATIONAL COMPARISONS
 DEFINING AND MEASURING WORLD-METRO REGIONS FOR INTERNATIONAL COMPARISONS Mario Piacentini, OECD 27th Scorus Conference, 11-13 August 2010, Latvia Why we need comparable measures of city performance Growing
Bathing water results 2011 Latvia
 Bathing water results 2011 Latvia 1. Reporting and assessment This report gives a general overview of water in Latvia for the 2011 season. Latvia has reported under the Directive 2006/7/EC since 2008.
Poland, European Territory, ESPON Programme Warsaw, 2 July 2007 STRATEGY OF THE ESPON 2013 PROGRAMME
 Poland, European Territory, ESPON Programme 2007-2013 Warsaw, 2 July 2007 STRATEGY OF THE ESPON 2013 PROGRAMME Territory matters Regional diversity as asset Territorial potentials increasing in importance
ACCESSIBILITY TO SERVICES IN REGIONS AND CITIES: MEASURES AND POLICIES NOTE FOR THE WPTI WORKSHOP, 18 JUNE 2013
 ACCESSIBILITY TO SERVICES IN REGIONS AND CITIES: MEASURES AND POLICIES NOTE FOR THE WPTI WORKSHOP, 18 JUNE 2013 1. Significant differences in the access to basic and advanced services, such as transport,
TRACC Transport Accessibility at Regional/Local Scale and Patterns in Europe
 TRACC Transport Accessibility at Regional/Local Scale and Patterns in Europe Applied Research 2013/1/10 Final Report Version 06/02/2015 Volume 3 TRACC Regional Case Study Book ESPON 2013 I This report
Indicator: Proportion of the rural population who live within 2 km of an all-season road
 Goal: 9 Build resilient infrastructure, promote inclusive and sustainable industrialization and foster innovation Target: 9.1 Develop quality, reliable, sustainable and resilient infrastructure, including
Final report for the Expert Group on the Integration of Statistical and Geospatial Information, May 2015
 Final report for the Expert Group on the Integration of Statistical and Geospatial Information, May 2015 Global geographic classification and geocoding practices Executive summary This final report was
European spatial policy and regionalised approaches
 Findings of the ESPON 2006 Programme COMMIN Final Conference 26-27 April 2007 European spatial policy and regionalised approaches by Dr. Kai BöhmeB ! Territory matters Structure of presentation! Territorial
Land Use and Land cover statistics (LUCAS)
") EUROPEAN COMMISSION EUROSTAT Directorate E: Sectoral and regional statistics Doc. ENV/DIMESA/7.1/2012 Original in EN Agenda point 7.1 Land Use and Land cover statistics (LUCAS) DIMESA Directors' Meeting
EUROPEAN COMMISSION EUROSTAT Directorate E: Sectoral and regional statistics Doc. ENV/DIMESA/7.1/2012 Original in EN Agenda point 7.1 Land Use and Land cover statistics (LUCAS) DIMESA Directors' Meeting
Sharthi Laldaparsad Statistics South Africa, Policy Research & Analysis. Sub-regional workshop on integration of administrative data,
 Sub-regional workshop on integration of administrative data, big data and geospatial information for the compilation of SDG indicators and International Workshop on Global Fundamental Geospatial Data Themes
EARTH OBSERVATION FOR ENVIRONMENTAL AND HEALTH IMPACT ASSESSMENT A METHODOLOGY WITH SYNERGIES FOR EUROPEAN POLICIES
 EARTH OBSERVATION FOR ENVIRONMENTAL AND HEALTH IMPACT ASSESSMENT A METHODOLOGY WITH SYNERGIES FOR EUROPEAN POLICIES Andreas N. Skouloudis (1), David G. Rickerby (2), Peter Pärt (3) (1) European Commission,
Bathing water results 2011 Slovakia
 Bathing water results Slovakia 1. Reporting and assessment This report gives a general overview of water in Slovakia for the season. Slovakia has reported under the Directive 2006/7/EC since 2008. When
Urban-Rural spatial classification of Finland
 Urban-Rural spatial classification of Finland Finnish Environment Institute SYKE The geographical information-based area classification system has been created by the Finnish Environment Institute and
Directorate E: Sectoral and regional statistics Unit E-4: Regional statistics and geographical information LUCAS 2018.
 EUROPEAN COMMISSION EUROSTAT Directorate E: Sectoral and regional statistics Unit E-4: Regional statistics and geographical information Doc. WG/LCU 52 LUCAS 2018 Eurostat Unit E4 Working Group for Land
Calculating the Natura 2000 network area in Europe: The GIS approach
 Calculating the Natura 2000 network area in Europe: The GIS approach 1. INTRODUCTION A precise area calculation is needed to check to what extent member states have designated Natura 2000 sites of their
Operational Definitions of Urban, Rural and Urban Agglomeration for Monitoring Human Settlements
 Operational Definitions of Urban, Rural and Urban Agglomeration for Monitoring Human Settlements By Markandey Rai United Nations Human Settlements Programme PO Box-30030 Nairobi, Kenya Abstract The United
Possible links between a sample of VHR images and LUCAS
 EUROPEAN COMMISSION EUROSTAT Directorate E: Sectoral and regional statistics Unit E-1: Farms, agro-environment and rural development CPSA/LCU/08 Original: EN (available in EN) WORKING PARTY "LAND COVER/USE
UZBEKISTAN CITIES IN EUROPE AND CENTRAL ASIA METHODOLOGY. Public Disclosure Authorized. Public Disclosure Authorized. Public Disclosure Authorized
 Public Disclosure Authorized Public Disclosure Authorized Public Disclosure Authorized Public Disclosure Authorized CITIES IN EUROPE AND CENTRAL ASIA UZBEKISTAN METHODOLOGY This country snapshot was produced
The Governance of Land Use
 The planning system The Governance of Land Use United Kingdom Levels of government and their responsibilities The United Kingdom is a unitary state with three devolved governments in Northern Ireland,
GISCO Working Party Meeting. 8 March 2012 Luxembourg. The ESPON 2013 Programme: State of Affairs. Marjan van Herwijnen project expert in the ESPON CU
 GISCO Working Party Meeting 8 March 2012 Luxembourg The ESPON 2013 Programme: State of Affairs Marjan van Herwijnen project expert in the ESPON CU The ESPON 2013 Programme Role in Structural Funds 2007-2013:
Frontier and Remote (FAR) Area Codes: A Preliminary View of Upcoming Changes John Cromartie Economic Research Service, USDA
 Area Codes: A Preliminary View of Upcoming Changes John Cromartie Economic Research Service, USDA") National Center for Frontier Communities webinar, January 27, 2015 Frontier and Remote (FAR) Area Codes: A Preliminary View of Upcoming Changes John Cromartie Economic Research Service, USDA The views
National Center for Frontier Communities webinar, January 27, 2015 Frontier and Remote (FAR) Area Codes: A Preliminary View of Upcoming Changes John Cromartie Economic Research Service, USDA The views
Globally Estimating the Population Characteristics of Small Geographic Areas. Tom Fitzwater
 Globally Estimating the Population Characteristics of Small Geographic Areas Tom Fitzwater U.S. Census Bureau Population Division What we know 2 Where do people live? Difficult to measure and quantify.
Statistical-geospatial integration - The example of Sweden. Marie Haldorson Director, Statistics Sweden
 Statistical-geospatial integration - The example of Sweden Marie Haldorson Director, Statistics Sweden Spatial data and geospatial applications at Statistics Sweden Long tradition GI integrated in production
CHANGES IN THE STRUCTURE OF POPULATION AND HOUSING FUND BETWEEN TWO CENSUSES 1 - South Muntenia Development Region
 TERITORIAL STATISTICS CHANGES IN THE STRUCTURE OF POPULATION AND HOUSING FUND BETWEEN TWO CENSUSES 1 - South Muntenia Development Region PhD Senior Lecturer Nicu MARCU In the last decade, a series of structural
Governance and Functional Urban Areas CEMAT Conference
 Governance and Functional Urban Areas CEMAT Conference Mart Grisel Bucharest, Romania 30/05/2017 FUA: various definitions KEY ASPECTS: CITY & COMMUTING AREA The area occupied by a large city and its surrounding
BELARUS CITIES IN EUROPE AND CENTRAL ASIA METHODOLOGY. Public Disclosure Authorized. Public Disclosure Authorized. Public Disclosure Authorized
 Public Disclosure Authorized Public Disclosure Authorized CITIES IN EUROPE AND CENTRAL ASIA BELARUS Public Disclosure Authorized Public Disclosure Authorized METHODOLOGY This country snapshot was produced
PASSENGER RAIL ACCESSIBILITY IN EUROPE'S BORDER AREAS
 PASSENGER RAIL ACCESSIBILITY IN EUROPE'S BORDER AREAS HUGO POELMAN AND LINDE ACKERMANS Working Papers A series of short papers on regional research and indicators produced by the Directorate-General for
The National Spatial Strategy
 Purpose of this Consultation Paper This paper seeks the views of a wide range of bodies, interests and members of the public on the issues which the National Spatial Strategy should address. These views
Land Cover and Land Use Diversity Indicators in LUCAS 2009 data
 Land Cover and Land Use Diversity Indicators in LUCAS 2009 data A. Palmieri, L. Martino, P. Dominici and M. Kasanko Abstract Landscape diversity and changes are connected to land cover and land use. The
RISK ASSESSMENT METHODOLOGIES FOR LANDSLIDES
 RISK ASSESSMENT METHODOLOGIES FOR LANDSLIDES Jean-Philippe MALET Olivier MAQUAIRE CNRS & CERG. Welcome to Paris! 1 Landslide RAMs Landslide RAM A method based on the use of available information to estimate
The Governance of Land Use
 The Governance of Land Use Country fact sheet Poland The planning system Levels of government and their responsibilities Poland has 4 levels of government; the national government, 16 regional governments
GERMANY CITIES IN EUROPE AND CENTRAL ASIA METHODOLOGY. Public Disclosure Authorized. Public Disclosure Authorized. Public Disclosure Authorized
 Public Disclosure Authorized Public Disclosure Authorized Public Disclosure Authorized Public Disclosure Authorized CITIES IN EUROPE AND CENTRAL ASIA GERMANY METHODOLOGY This country snapshot was produced
1. Demand for property on the coast
 1. Demand for property on the coast Key message Irrespective of density and location, population in Europe in general tends to concentrate in coastal areas. Detailed spatial elaboration of processes shows
Key Indicators for Territorial Cohesion and Spatial Planning in Preparing Territorial Development Strategies
 ESPON Evidence in a North European Context Challenges and Opportunities for Territorial Development and Cohesion in a North European Macro Region, 10-11 April, 2014, Vilnius, Lithuania Key Indicators for
Sampling scheme for LUCAS 2015 J. Gallego (JRC) A. Palmieri (DG ESTAT) H. Ramos (DG ESTAT)
 A. Palmieri (DG ESTAT) H. Ramos (DG ESTAT)") Sampling scheme for LUCAS 2015 J. Gallego (JRC) A. Palmieri (DG ESTAT) H. Ramos (DG ESTAT) Abstract The sampling design of LUCAS 2015 took into account experience from previous campaigns. While remaining
Sampling scheme for LUCAS 2015 J. Gallego (JRC) A. Palmieri (DG ESTAT) H. Ramos (DG ESTAT) Abstract The sampling design of LUCAS 2015 took into account experience from previous campaigns. While remaining
A Markov system analysis application on labour market dynamics: The case of Greece
 + A Markov system analysis application on labour market dynamics: The case of Greece Maria Symeonaki Glykeria Stamatopoulou This project has received funding from the European Union s Horizon 2020 research
British Household Panel Survey, waves 1-17 ( )
") UK Data Archive Study Number 6032 - British Household Panel Survey, Waves 1-17, 1991-2008: Conditional Access, Rural-Urban s British Household Panel Survey, waves 1-17 (1991-2008) User Documentation: Rural-Urban
UK Data Archive Study Number 6032 - British Household Panel Survey, Waves 1-17, 1991-2008: Conditional Access, Rural-Urban s British Household Panel Survey, waves 1-17 (1991-2008) User Documentation: Rural-Urban
SPIMA Spatial dynamics and strategic planning in metropolitan areas
 SPIMA Spatial dynamics and strategic planning in metropolitan areas Dr. Vanya Simeonova Wageningen Environmental Research Wageningen University and research, The Netherlands Key outcomes: SPIMA Framework
Workshop B Spatial positioning and definition of characteristics
 This presentation expresses the author's views. It does not necessarily reflect the opinion of the ESPON Monitoring Committee, which is not liable for any use that may be made of the information provided.
Entrepreneurship on islands and other peripheral regions. Specific Contract No 6511 implementing Framework contract No CDR/DE/16/2015/
 Entrepreneurship on islands and other peripheral regions Specific Contract No 6511 implementing Framework contract No CDR/DE/16/2015/ Aims of this study: To analyse the particular challenges and obstacles
Sustainable and Harmonised Development for Smart Cities The Role of Geospatial Reference Data. Peter Creuzer
 Sustainable and Harmonised Development for Smart Cities The Role of Geospatial Reference Data Peter Creuzer 1. Introduction - Smart Cities and Geodata 2. Geodata in Germany 3. Examples 4. Data and Service
Urban Geography. Unit 7 - Settlement and Urbanization
 Urban Geography Unit 7 - Settlement and Urbanization Unit 7 is a logical extension of the population theme. In their analysis of the distribution of people on the earth s surface, students became aware
Identification of Very Shallow Groundwater Regions in the EU to Support Monitoring
 Identification of Very Shallow Groundwater Regions in the EU to Support Monitoring Timothy Negley Paul Sweeney Lucy Fish Paul Hendley Andrew Newcombe ARCADIS Syngenta Ltd. Syngenta Ltd. Phasera Ltd. ARCADIS
ESPON public database
 ESPON public database - tables and indicators overview - NUTS-Reference: NUTS 0 reference NUTS 1 reference NUTS 2 reference NUTS 3 reference ESPON basic indicators: Area NUTS 2 Area in square kilometer