THE NEW DEGREE OF URBANISATION
|
|
|
- Tyler Green
- 5 years ago
- Views:
Transcription
1 THE NEW DEGREE OF URBANISATION EXECUTIVE SUMMARY This paper describes the new degree of urbanisation classification as approved by the Eurostat Labour Market Working Group in This classification distinguishes three types of areas: densely, intermediate and thinly populated areas. The paper explains the background of new approach, the new method and the advantages of the new classification. A more detailed explanation of the methodology is also provided as are the original and the new guidance note on the degree of urbanisation. This new classification can be found here: For tables (MS Access mdb format) and maps (PDF) at European level: For tables (Excel) and maps (PDF) per country:
2 EXECUTIVE SUMMARY BACKGROUND THE NEW APPROACH Definitions: Adjustments and validation by national statistical institutes Adjusting city boundaries Other adjustments ADVANTAGES OF THE NEW APPROACH Greater comparability and less distortion Harmonising four spatial concepts UPDATES Annual updates due to changes in the LAU2 boundary Updates due to changes in the distribution of population DETAILED METHODOLOGY OF THE NEW DEGREE OF URBANISATION CLASSIFICATION Introduction Population grid Rural grid cells and urban clusters High-density clusters (city centres) Three contiguity rules Completing and correcting the classifications LAU2 without an raster equivalent Border effects LAU2 with no population in the raster equivalent LAU2s outside the current population grid Adjusting the cities Other adjustments ANNEX I: ORIGINAL DEGREE OF URBANISATION ANNEX II: NEW DEGREE OF URBANISATION
3 1. BACKGROUND The original degree of urbanisation was introduced in 1991 to indicate the character of the area where the respondent lives. It distinguished three types of areas: densely, intermediate and thinly populated areas. This definition was based on the population size and density and contiguity of local administrative units level 2 (LAU2, see annex 1 for official names of this level in each country and original language). As this method is based on LAU2s which vary considerably in area size, the results are distorted and reduce the comparability between countries with large LAU2s and small LAU2s. In 2010, a new urban-rural regional typology was published in the Eurostat regional yearbook to be used by all Commission services. This typology was derived from the OECD method. The OECD method defines rural regions based on the share of population in rural LAU2s defined based on population density, while the new method is based on grid cells of 1km 2. As the grid cells are identical in size, this new method eliminates the distortions of using LAU2s that vary in size. This new urban-rural regional typology created the opportunity to revise the definition of rural LAU2s and harmonise it with the definition of thinly populated areas as used in the degree of urbanisation. The review of the Urban Audit created the opportunity to revise the definition, boundary and number of cities and harmonise it with the densely populated areas as used in the degree of urbanisation. 2. THE NEW APPROACH The new degree of urbanisation creates a three-way classification of LAU2s as follows: (1) Densely populated area: (alternate name: cities or large urban area) At least 50% lives in high-density clusters 1 (2) Intermediate density area (alternate name: towns and suburbs or small urban area) Less than 50% of the population lives in rural grid cells and Less than 50% lives in a high-density cluster (3) Thinly populated area (alternate name: rural area) More than 50% of the population lives in rural grid cells. This classification can be downloaded. For tables (MS Access.mdb format) and maps (PDF) at European level: 1 To ensure that the population of each high-density cluster is appropriately represented (min 75%) by densely populated LAU2s, twenty five LAU2s were added to this category. This also ensures that twenty high-density clusters are included, which otherwise would be dropped. 3
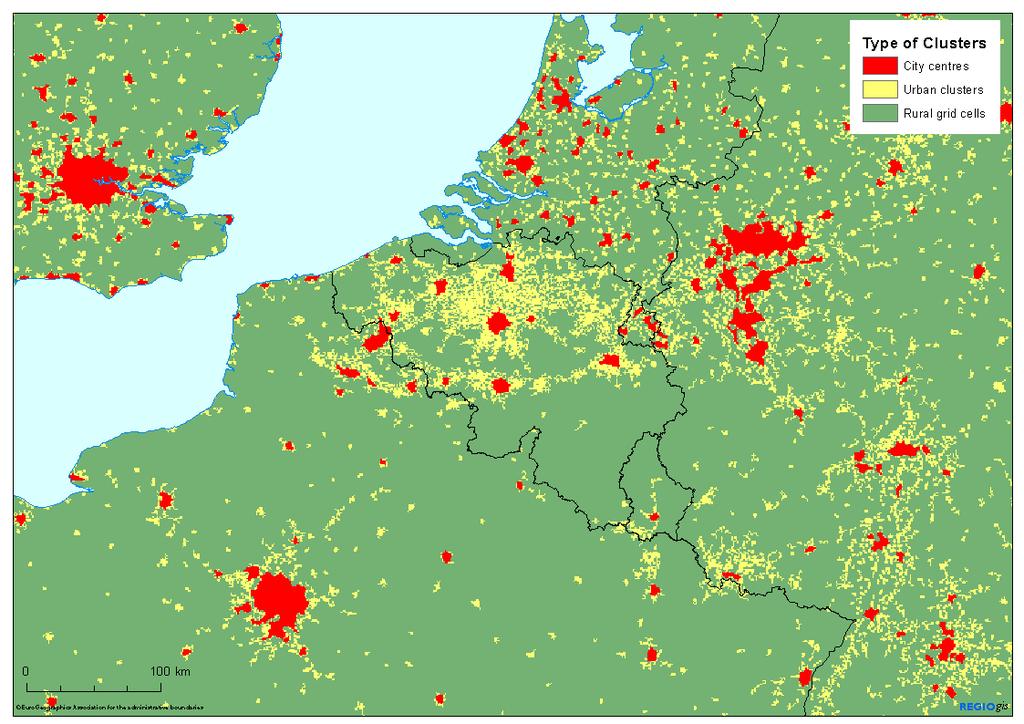
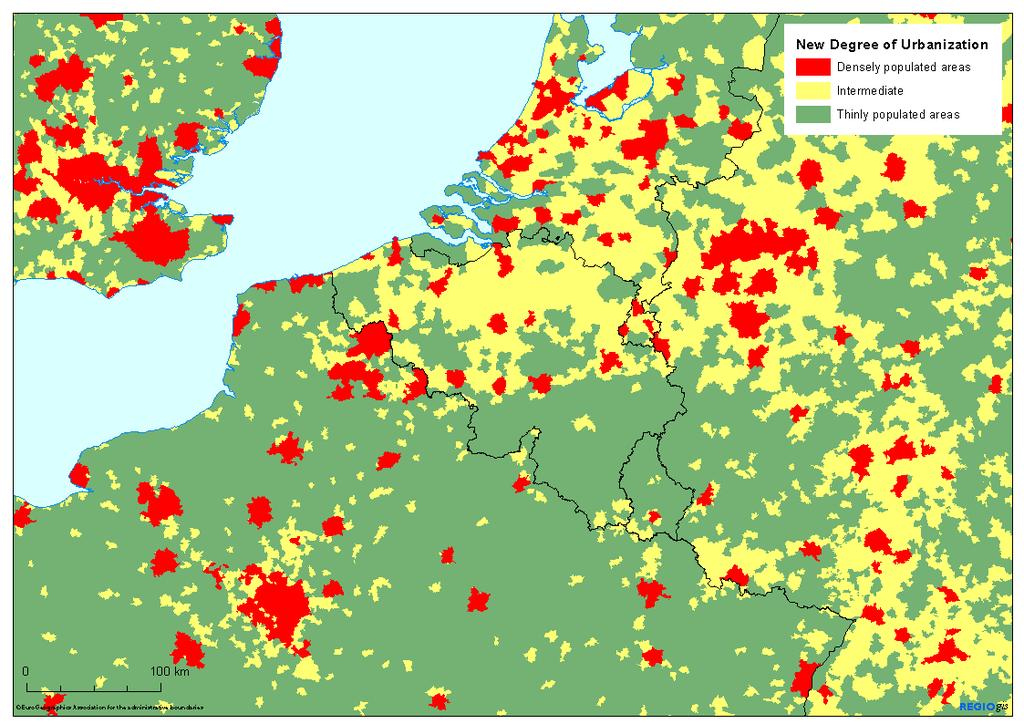
4 For tables (Excel) and maps (PDF) per country: The set of two images below gives an example of Cork in Ireland. Figure 1: Cork, Ireland: Type of cluster and degree of urbanisation 4
5 2.1. Definitions: Rural grid cells: Grid cells outside urban clusters Urban clusters: clusters of contiguous 2 grid cells of 1km 2 with a density of at least 300 inhabitants per km 2 and a minimum population of High-density cluster (or city centre): Contiguous 3 grid cells of 1km 2 with a density of at least inhabitants per km 2 and a minimum population of Adjustments and validation by national statistical institutes The application of this methodology was sent to the national statistical institutes (NSI) for adjustments and validation. The NSIs could make two types of adjustments: adjusting city boundaries and adjusting LAU2 classifications Adjusting city boundaries The guidance note highlights that due to the variation of the area size of LAU2s, the match between the high-density cluster and the densely populated LAU2s could be adjusted within certain constraints. In this context, several NSI have requested changes to the densely populated areas to ensure a better match between the appropriate political level and/or a level for which annual data is collected Other adjustments Due to the sources of the population grid and the fairly coarse resolution of the population grid, the classification of a limited number of LAU2s may not correspond to this approach. As a result, National Statistical Institutes (NSI) were invited to critical review this classification and to make, where necessary, adjustments to the classification. 2 3 Contiguity includes the diagonal. For more detail see section 4.5. Contiguity does not include the diagonal (i.e. cells with only the corners touching) and gaps in the cluster are filled (i.e. cells surrounded by a majority of high-density cells applied iteratively). For more detail see section
6 3. ADVANTAGES OF THE NEW APPROACH The two main advantages are greater comparability and a harmonisation of spatial concepts Greater comparability and less distortion The problem with the original degree of urbanisation is that it relied on the population size of LAU2s as one of the main criteria. If a LAU2 was large enough, even the presence of a large city would lead to it being classified as thinly populated. For example, the original degree of urbanisation classified the LAU2 of Uppsala (SE), Aalborg (DK) and Badajoz (ES) as thinly populated despite the presence of cities with more than inhabitants. As a result, the degree of urbanisation of countries with large LAU2s was underestimated compared to countries with small LAU2s. This new approach also uses the criterion of population density but applied to units of analysis of the same size: 1km 2 grid cells. As a result, it can look inside the large LAU2s and detect the presence of towns or cities within a LAU2. Therefore, the results are less distorted and more comparable between countries Harmonising four spatial concepts Prior to the new degree of urbanisation four similar but not identical urban-rural spatial concepts were used: rural areas (OECD), thinly populated area, densely populated area, and Urban Audit City. The OECD method classifies all LAU2 with a population density below 150 inhabitants per km 2 as rural. This is different from the original degree of urbanisation method which also took into account population size and contiguity. This OECD method will also classify large LAU2s with a city as rural due to low population density. The Urban Audit covered a large sample of cities with at least inhabitants. These cities were not selected in a harmonised manner and not all cities were included. The Urban Audit was not compatible with the densely populated areas identified by the original LFS method. 6
7 Figure 2: Four conflicting spatial concepts Urban-Rural Typology Degree of urbanisation Urban Audit Rural LAU2 Thinly populated Intermediate density Densely populated Cities The new degree of urbanisation ensures that rural areas equal thinly populated areas. This also means that rural regions are identified using the same approach (share of population in rural grids). For more information see Eurostat Regional Yearbook The high-density clusters were used to identify all cities with an urban centre with at least inhabitants. As a result the Urban Audit now covers all those cities and the densely populated areas are identical to the Urban Audit cities. Figure 3: Harmonised spatial concepts New Degree of urbanisation Thinly populated Rural areas Intermediate density Densely populated Urban Audit Cities 7
8 4. UPDATES The current classification has been based on population data for 2006 and the LAU2 boundaries of There are two types of updates that will be needed: 1) updates because the LAU2 boundaries have changed and 2) updates because the population distribution has changed Annual updates due to changes in the LAU2 boundary The first changes will have to be made annually and can be implemented in two ways: 1) applying the methodology as described here to the new layer of LAU2s or 2) estimating the degree of urbanisation based on the changes. The first approach is more labour intensive. The second approach is particularly suitable if the changes are minor or consist mainly of mergers. In such cases, the degree of urbanisation of the new LAU2s could be based on the codes of the previous ones. For example, a merge of LAU2s with the same degree of urbanisation would still have the same degree. Merging two LAU2s with different degrees of urbanisation could be resolved by given precedence to the highest degree of urbanisation: densely + intermediate = densely or intermediate + thinly = intermediate. Taking into account the relative population size of these two LAU2s could further refine the process Updates due to changes in the distribution of population As this classification is expected to be relatively stable, there is no need to update it annually. In addition, an update can only be done based on a 1km 2 population grid, which not all countries have or update annually. For the disaggregation grid, updated land cover data and census tract or LAU2 population data is needed. This is typically only available every five or ten years. As a result, this classification will only be updated to reflect changes in the population distribution every five years. The next update will be for population of reference year A complete population grid should be available for this reference year in 2014, allowing the modification to be used starting in January


9 Canarias Guyane Guadeloupe Martinique Réunion Açores Madeira REGIOgis Clusters 2011 City Centres Urban Clusters Rural Grid Cells Sources: EFGS, JRC, Eurostat, LandScan, REGIO-GIS 0 1,000 Km EuroGeographics Association for the administrative boundaries
10 10
11 Canarias Guyane Guadeloupe Martinique Réunion Açores Madeira REGIOgis Degree of Urbanisation 2011 Densely populated areas Intermediate Thinly populated areas No Data Sources: EFGS, JRC, Eurostat, LandScan, REGIO-GIS 0 1,000 Km EuroGeographics Association for the administrative boundaries
12 12
13 5. DETAILED METHODOLOGY OF THE NEW DEGREE OF URBANISATION CLASSIFICATION 5.1. Introduction This document describes in detail the methodology described in the Labour Force Survey Guidance note on degree of urbanisation (2011). It explains how to classify local administrative units (LAU2) in thinly (rural), intermediate (towns and suburbs/small urban) and densely populated (cities/large urban) areas. This methodology has been jointly developed by DG AGRI and DG REGIO with support of JRC and Eurostat Population grid This new classification is based on a 1 km² population grid. A grid based on geo-coding address locations and population register data is available for Croatia, Denmark, Sweden, Finland, Austria, the Netherlands, Slovenia, Switzerland and Norway and the classification is based on those 'bottom-up' grids in these Member States. For the remaining countries, the classification relies on the population disaggregation grid created by the JRC based on LAU2 population and CORINE land cover 4. The disaggregation grid has a resolution of 100x100 m, but has been aggregated to a cell size of 1 km 2 for this analysis. Because the CORINE land cover map does not cover the four French overseas regions and Madeira and Açores in Portugal, the population disaggregation grid does not cover these regions. Therefore, the classification for these regions has been done based on other sources (LandScan 5 data) which DG REGIO has acquired Rural grid cells and urban clusters A rural LAU2 has 50% of its population is living in rural grid cells. Rural grid cells: Grid cells outside urban clusters Urban clusters: clusters of contiguous 6 grid cells of 1km 2 with a density of at least 300 inhabitants per km 2 and a minimum population of The calculation is done in two steps: A provisional version, disaggregating the LAU2 population of 2006 has been used. More information about the disaggregation method can be found at: A final version of the 2006 population grid is expected in the first half of Contiguity includes the diagonal.


14 First, all cells with a population density of 300 inhabitants per km 2 are selected. Second contiguous cells (see figure below). The groups of contiguous cells with a density above the threshold with a total population of or more are selected. These are urban clusters. The resulting raster of urban clusters is available here: The urban clusters can be overlayed on LAU2s, which allows us to calculate the share of population of each LAU2 living in an urban cluster. If less then 50% lives in an urban cluster, the LAU2 is classified as rural High-density clusters (city centres) To make distinction between densely (large urban) and intermediate (small urban) we classify as densely those LAU2s where 50% or more of the population lives in a highdensity cluster. High-density cluster: Contiguous 7 grid cells of 1km 2 with a density of at least inhabitants per km 2 and a minimum population of The raster of high-density clusters is available here: 2c6f2b606b46/HDENS_CLST_2006.zip 7 Contiguity does not include the diagonal (i.e. cells with only the corners touching) and gaps in the cluster are filled (i.e. cells surrounded by a majority of high-density cells applied iteratively). 14
.")

15 The method to identify high-density cluster is similar to the method of the urban clusters. First, all cells with a population density of more than 1500 inhabitants per km 2 are selected. Second, contiguous high-density cells are grouped. In contrast to the urban clusters, diagonal contiguity is not included. The last steps fills gaps and smoothes sharp borders (see figure below). This is done by applying the majority rule iteratively. This means that if five or more of cells surrounding a cell belonged to a single high-density cluster, it was added to that high density cluster. This was repeated until no more cells were added. Clusters before filling Clusters after filling. Clusters with at least The high-density clusters can be overlaid with LAU2s, which allows us to calculate the share of population of each LAU2 living in a high-density cluster. If more than 50% lives in a high-density cluster, the LAU2 is classified as densely populated. As a last step, a number of LAU2s are included in the densely populated class to ensure that all high-density clusters have at least 75% of their population in this class Three contiguity rules This section illustrates the three contiguity rules mentioned above: 1. Contiguous including diagonals (urban clusters) If the central square in Figure 1 is above the density threshold, it will be grouped with each of the other surrounding eight cells that exceed the density threshold 2. Contiguous excluding diagonals (high-density clusters) If the central square in Figure 1 is above the density threshold, it will be grouped with each of the four cells directly above, below or next to the central square that exceed the density threshold. This means that cells with number 2, 4, 5 and 7 can be included. Cells with number 1, 3, 6 and 8 cannot as they have a diagonal connection. 3. The majority rule (gap filling in high-density clusters) The goal for the high-density clusters was to identify urban centres without any gaps. Therefore enclaves needed to be filled. If the central square in figure 1 is not part of a high-density cluster, it will be added to a high-density cluster if five 15
16 or more of the eight surrounding cells belong to a single high-density cluster. This rule is applied iteratively until no more cells can be added Completing and correcting the classifications Figure 1: Contiguous grid cells To classify LAU2s based on a population grid, the LAU2s have to be transformed into a raster as well, which can lead to a few situations which require an ad-hoc solution LAU2 without an raster equivalent Some small LAU2s do not have a raster equivalent. These have been classified according to the share of area in rural grid cells and high-density clusters Border effects Thinly populated LAU2s classified as intermediate density or densely populated may be classified incorrectly if rural grid cells cover most of the territory. The LAU2s with a population below 5000 inhabitants and with 90% or more of its area in rural grid cells were reclassified as thinly. Small LAU2s classified as "Rural area" may be classified incorrectly due to the coarse resolution of the population grid compared to the small size of the LAU2s. LAU2s with an area less than 5 km² but with a share of surface outside rural grid cells higher than 30 % were reclassified as intermediate density or densely populated according to the share of the corresponding cluster LAU2 with no population in the raster equivalent A few LAU2s do not have a population in their raster equivalent, although according to the census they do have a density higher than 150 inh./km². These have been classified according to the surrounding LAU2s and the census data. 16
17 LAU2s outside the current population grid The CORINE land cover map does not cover the four French overseas regions, the Azores and Madeira of Portugal. DG REGIO has acquired the LandScan population grid for these regions and used that grid to classify the LAU2s of these regions Adjusting the cities The definition of the degree of urbanisation specifies that: As LAU2s vary considerably in area, this methodology will lead to a closer match between a high-density cluster and densely populated LAU2s in countries with small LAU2s than in those with large LAU2s. To take this difference into account, the classification can be adjusted as following: A densely populated LAU2 can be classified intermediate as long as 75% of its high-density cluster population remains in densely populated LAU2s. An thinly populated or intermediate density LAU2 can be classified as densely populated if it belongs to a group of LAU2s with a political function and if the majority of population of this group of LAU2s lives in a high-density cluster. An example of the application of the first rule is Luxembourg 17
18 An example of the second rule is Toulouse. These modifications were made based on requests from the national statistical institutes and verified by the European Commission Other adjustments This method can be distorted by two elements: 1) the type of grid used and 2) the geography of the area. In countries where no bottom up grid was available, the method may be less accurate due to the resolution of the data (mainly CORINE land cover and LAU2 population) used in the population disaggregation grid. More information about the disaggregation method can be found at: Future updates will increasingly rely on bottom up grids and disaggregation using high resolution data. The method does not take into account the presence of steep slopes or bodies of water. As a result, the method may not identify high-density clusters or urban clusters in these types of areas. Due to these two sources of possible distortion, national statistical institutes were asked to verify and validate the classification. NSIs could propose additional cities with an urban centre with at least inhabitants. These were verified by the Commission to ensure that they indeed had such an urban centre, for example by examining the population size of the high-density clusters below within the city boundaries or analysing the data produced using a more precise national population grid. For example, the cities of Namur and Trier were not identified by the method due to their geography. At the request of the respective NSIs, these cities were added. 18
19 In some cases, NSIs have asked to drop a city. Some of the reasons to drop a city were that it lacked centre functions, it had a negative commuter balance or the population of its urban centre was likely to be below (today). These requests were verified by the Commission and if the estimated population of the urban centre was close to the threshold and/or the other reasons were valid, the city was dropped. NSIs could also request minor corrections to the thinly populated and intermediate categories. 19
20 6. ANNEX I: ORIGINAL DEGREE OF URBANISATION DEGURBA Col 174 : Degree of urbanisation Periodicity QUARTERLY Short description Degree of urbanisation Filter (Everybody) Codes: (Y = Yes N = No) Column Code Description Degree of urbanisation 1 Densely-populated area Y Y Y Y N 2 Intermediate area Y Y Y Y N 3 Thinly-populated area Y Y Y Y N Purpose Variable needed to calculate employment and unemployment rate breakdown by density of population. Definitions The concept of "urbanisation" has been introduced to indicate the character of the area where the respondent lives. Three types of area have been identified, as follows: densely-populated (Code 1) intermediate (Code 2) thinly-populated (Code 3) In the definition of "Degree of urbanisation" there is a criterion of geographical contiguity together with a population threshold. Harmonised, comparable correspondence between the Degree of Urbanisation and NUTS 5 regions has been (re- )defined on the basis of 2001 census data (for Member States and Candidate countries) in
21 An "area" consists of a group of contiguous "local areas" where a "local area" corresponds to the following entities in the respective countries : Belgium Gemeenten/Communes Czech Republic Obce 6,249 Denmark Kommuner 271 Germany Gemeinden 13,176 Estonia Vald, Inn 241 Greece Demotiko 6,130 diamerisma/koinotiko diamerisma Spain Municipios 8,108 France Communes 36,678 Ireland DEDs/Wards 3,440 Italy Comuni 8,100 Cyprus Dimoi, koinotites 614 Latvia Pilsētas, novadi, pagasti 530 Lithuania Seniūnijos 515 Luxembourg Communes 118 Hungary Települések 3,145 Malta Kunsilli 68 The Gemeenten 489 Netherlands Austria Gemeinden 2,381 Poland Gminy 2,478 Portugal Freguesias 4,257 Slovenia Občine 193 Slovakia Obce 2,928 Finland Kunnat /Kommuner 446 Sweden Kommuner 290 United Wards (or parts thereof) 10,679 Kingdom Bulgaria Naseleni Mesta 5,340 Croatia Romania Communes+ Municipiu 2,951 +Orajse Turkey Köy 37,675 Iceland Sveitarfélag 101 Norway Kommuner 433 Switzerland Gemeinden / Communes / Comuni 2,815 The three types of area described above are defined as follows: - Code 1: Densely-populated area This is a contiguous set of local areas, each of which has a density superior to 500 inhabitants per square kilometre, where the total population for the set is at least 50,000 inhabitants. 21
22 - Code 2: Intermediate area This is a contiguous set of local areas, not belonging to a densely-populated area, each of which has a density superior to 100 inhabitants per square kilometre, and either with a total population for the set of at least 50,000 inhabitants or adjacent to a denselypopulated area. - Code 3: Thinly-populated area This is a contiguous set of local areas belonging neither to a densely-populated nor to an intermediate area. A set of local areas totalling less than 100 square kilometres, not reaching the required density, but entirely enclosed within a densely-populated or intermediate area, is to be considered to form part of that area. If it is enclosed within a densely-populated area and an intermediate area it is considered to form part of the intermediate area. 22
23 7. ANNEX II: NEW DEGREE OF URBANISATION DEGURBA col 168 Periodicity QUARTERLY Short description Degree of urbanisation Codes 1 Densely-populated area 2 Intermediate area 3 Thinly-populated area Filter Everybody Purpose Variable needed to calculate employment and unemployment rate and main population characteristics separately for urban and rural areas Definitions The concept of "urbanisation" has been introduced to indicate the character of the area where the respondent lives. Three types of area have been identified and defined using a criterion of geographical contiguity in combination with a minimum population threshold based on population grid square cells of 1 km2. These grid cells all have the same shape and surface, which avoids distortions caused by using units varying in size. The three types to be distinguished are: densely-populated (Code 1) intermediate (Code 2) thinly-populated (Code 3) The degree of urbanisation creates a classification of all LAU2s (Local Administrative Units Level 2) as follows: Thinly populated area (alternative name: rural area) More than 50% of the population lives in rural grid cells. Intermediate density area (alternative name: towns and suburbs/small urban area) Less than 50% of the population lives in rural grid cells and 23
24 Less than 50% lives in high-density clusters Densely populated area: (alternative names: cities/large urban area) At least 50% lives in high-density clusters 8 In the above, the following definitions are used: Rural grid cells: Grid cells outside urban clusters Urban clusters: clusters of contiguous 9 grid cells of 1 km2 with a density of at least 300 inhabitants per km2 and a minimum population of High-density cluster: Contiguous 10 grid cells of 1 km2 with a density of at least inhabitants per km2 and a minimum population of (Alternative names: urban centre or city centre) In order to classify properly LAU2s based on the grid cell approach described, a few additional correction rules must be provided: If the LAU2s do not have a raster equivalent, they are classified according to the share of territory in rural grid cells and high-density clusters. Thinly populated LAU2s may be classified as intermediate or densely populated due to border effects if rural grid cells cover most of the territory. For that reason, LAU2s with a population below 5000 inhabitants 11 and 90% of its area in rural grid cells are reclassified as rural area. Very small densely populated LAU2s may be classified as thinly populated due to the coarse 12 resolution of the population grid. For that reason, LAU2s with an area less than 5 km² but with a share of surface outside rural grid cells higher than 30 % are reclassified as intermediate density or densely populated according to the share of the correspondent cluster. As LAU2s vary considerably in area, this methodology will lead to a closer match between a high-density cluster and densely populated LAU2s in countries with small LAU2s than in those with large LAU2s. To take this difference into account, the classification can be adjusted as following: 8 Furthermore, each high-density cluster should have at least 75% of its population in densely populated LAU2s. This also ensures that all high-density clusters are part of at least one densely populated LAU2, even when this cluster represents less than 50% of the population of the LAU2. 9 Contiguity for urban clusters does include the diagonal (i.e. cells with only the corners touching). Gaps in the urban cluster are not filled (i.e. cells surrounded by urban cells). 10 Contiguity for high-density clusters does not include the diagonal (i.e. cells with only the corners touching) and gaps in the cluster are filled (i.e. cells surrounded by high-density cells). 11 Please note that this threshold refers to the population in the LAU2, whereas the threshold used in the definition of an urban cluster refers to the set of contiguous grid cells the cluster which may cover cells belonging to several LAU2s. 12 "Coarse" in relation to the small area of these particular LAUS2s. 24
25 A densely populated LAU2 can be classified intermediate as long as 75% of its high-density cluster population remains in densely populated LAU2s. An thinly populated or intermediate density LAU2 can be classified as densely populated if it belongs to a group of LAU2s with a political function and if the majority of population of this group of LAU2s lives in a high-density cluster. A LAU2 consists of municipalities or equivalent units in the 27 EU Member States and correspond to the following entities: Belgium Czech Republic Denmark Germany Estonia Greece Spain France Ireland Italy Cyprus Latvia Lithuania Luxembourg Hungary Malta The Netherlands Austria Poland Portugal Slovenia Slovakia Finland Sweden United Kingdom Bulgaria Croatia Romania Turkey Iceland Norway Switzerland Gemeenten/Communes Obce Kommuner Gemeinden Vald, Linn Demotiko diamerisma/koinotiko diamerisma Municipios Communes DEDs/Wards Comuni Dimoi, koinotites Pilsētas, novadi, pagasti Seniūnijos Communes Települések Kunsilli Gemeenten Gemeinden Gminy Freguesias Občine Obce Kunnat /Kommuner Kommuner Wards (or parts thereof) Naseleni Mesta Communes+Municipiu+Orajse Köy Sveitarfélag Kommuner Gemeinden / Communes / Comuni Note: This new methodology of classifying urban and rural areas has been agreed by DG for Regional Policy, DG for Agriculture and Rural Development and Eurostat. It replaces the methodology used in the LFS so far. The older methodology can be consulted in previous versions of the explanatory notes. 25
26 The definition of urban clusters is drawn from the new methodology to classify urban and rural regions developed and agreed by DG for Regional Policy, DG for Agriculture and Rural Development, Eurostat and JRC in The definition of high-density clusters is drawn from work by the OECD and the DG for Regional Policy on a new metropolitan area definition done in
How proximity to a city influences the performance of rural regions by Lewis Dijkstra and Hugo Poelman
 n 01/2008 Regional Focus A series of short papers on regional research and indicators produced by the Directorate-General for Regional Policy Remote Rural Regions How proximity to a city influences the
Refinement of the OECD regional typology: Economic Performance of Remote Rural Regions
 [Preliminary draft April 2010] Refinement of the OECD regional typology: Economic Performance of Remote Rural Regions by Lewis Dijkstra* and Vicente Ruiz** Abstract To account for differences among rural
TERCET: A European regulation on statistical units and territorial typologies
 TERCET: A European regulation on statistical units and territorial typologies NUAC Meeting 10 May 2016 Eurostat Unit E4 Regulation (EC) No 1059/2003: - Establishes a classification of territorial units
A Markov system analysis application on labour market dynamics: The case of Greece
 + A Markov system analysis application on labour market dynamics: The case of Greece Maria Symeonaki Glykeria Stamatopoulou This project has received funding from the European Union s Horizon 2020 research
WHO EpiData. A monthly summary of the epidemiological data on selected Vaccine preventable diseases in the European Region
 A monthly summary of the epidemiological data on selected Vaccine preventable diseases in the European Region Table : Reported measles cases for the period July 207 June 208 (data as of August 208) Population
Vít PÁSZTO Karel MACKŮ
 What is a rural region? A comparative study on Eurostat data and methods for rural areas delimitation Vít PÁSZTO Karel MACKŮ Department of Geoinformatics, Faculty of Science, Palacký University Olomouc,
WHO EpiData. A monthly summary of the epidemiological data on selected Vaccine preventable diseases in the WHO European Region
 A monthly summary of the epidemiological data on selected Vaccine preventable diseases in the WHO European Region Table : Reported cases for the period November 207 October 208 (data as of 30 November
Coastal regions: People living along the coastline and integration of NUTS 2010 and latest population grid
 Statistics in focus (SIF-SE background article) Authors: Andries ENGELBERT, Isabelle COLLET Coastal regions: People living along the coastline and integration of NUTS 2010 and latest population grid Among
WHO EpiData. A monthly summary of the epidemiological data on selected Vaccine preventable diseases in the European Region
 A monthly summary of the epidemiological data on selected Vaccine preventable diseases in the European Region Table : Reported cases for the period September 207 August 208 (data as of 0 October 208) Population
WHO EpiData. A monthly summary of the epidemiological data on selected Vaccine preventable diseases in the WHO European Region
 A monthly summary of the epidemiological data on selected Vaccine preventable diseases in the WHO European Region Table 1: Reported cases for the period January December 2018 (data as of 01 February 2019)
Weekly price report on Pig carcass (Class S, E and R) and Piglet prices in the EU. Carcass Class S % + 0.3% % 98.
 and Piglet prices in the EU. Carcass Class S % + 0.3% % 98.") Weekly price report on Pig carcass (Class S, E and R) and Piglet prices in the EU Disclaimer Please note that EU prices for pig meat, are averages of the national prices communicated by Member States weighted
Weekly price report on Pig carcass (Class S, E and R) and Piglet prices in the EU Disclaimer Please note that EU prices for pig meat, are averages of the national prices communicated by Member States weighted
AD HOC DRAFTING GROUP ON TRANSNATIONAL ORGANISED CRIME (PC-GR-COT) STATUS OF RATIFICATIONS BY COUNCIL OF EUROPE MEMBER STATES
 STATUS OF RATIFICATIONS BY COUNCIL OF EUROPE MEMBER STATES") Strasbourg, 29 May 2015 PC-GR-COT (2013) 2 EN_Rev AD HOC DRAFTING GROUP ON TRANSNATIONAL ORGANISED CRIME (PC-GR-COT) STATUS OF RATIFICATIONS BY COUNCIL OF EUROPE MEMBER STATES TO THE UNITED NATIONS CONVENTION
Strasbourg, 29 May 2015 PC-GR-COT (2013) 2 EN_Rev AD HOC DRAFTING GROUP ON TRANSNATIONAL ORGANISED CRIME (PC-GR-COT) STATUS OF RATIFICATIONS BY COUNCIL OF EUROPE MEMBER STATES TO THE UNITED NATIONS CONVENTION
Bathing water results 2011 Latvia
 Bathing water results 2011 Latvia 1. Reporting and assessment This report gives a general overview of water in Latvia for the 2011 season. Latvia has reported under the Directive 2006/7/EC since 2008.
WHO EpiData. A monthly summary of the epidemiological data on selected Vaccine preventable diseases in the European Region
 A monthly summary of the epidemiological data on selected Vaccine preventable diseases in the European Region Table : Reported measles cases for the period January December 207 (data as of 02 February
WHO EpiData. A monthly summary of the epidemiological data on selected Vaccine preventable diseases in the European Region
 A monthly summary of the epidemiological data on selected Vaccine preventable diseases in the European Region Table : Reported cases for the period June 207 May 208 (data as of 0 July 208) Population in
Populating urban data bases with local data
 Populating urban data bases with local data (ESPON M4D, Géographie-cités, June 2013 delivery) We present here a generic methodology for populating urban databases with local data, applied to the case of
2 European cities. Introduction. Urbanisation. 36 Eurostat regional yearbook 2010 eurostat. The spatial dimension. The topics.
 European cities 2 European cities ( 1 ) Council of the European Union, Review of the EU sustainable development strategy (EU SDS) Renewed strategy, 10117/06. ( 2 ) Eurostat, Sustainable development in
Growth Trends and Characteristics of OECD Rural Regions
 Please cite this paper as: Garcilazo, E. (2013), Growth Trends and Characteristics of OECD Rural Regions, OECD Regional Development Working Papers, 2013/10, OECD Publishing, Paris. http://dx.doi.org/10.1787/5k4522x3qk9q-en
How the science of cities can help European policy makers: new analysis and perspectives
 How the science of cities can help European policy makers: new analysis and perspectives By Lewis Dijkstra, PhD Deputy Head of the Economic Analysis Unit, DG Regional and European Commission Overview Data
Use of the ISO Quality standards at the NMCAs Results from questionnaires taken in 2004 and 2011
 Use of the ISO 19100 Quality standards at the NMCAs Results from questionnaires taken in 2004 and 2011 Eurogeographics Quality Knowledge Exchange Network Reference: History Version Author Date Comments
Land Use and Land cover statistics (LUCAS)
") EUROPEAN COMMISSION EUROSTAT Directorate E: Sectoral and regional statistics Doc. ENV/DIMESA/7.1/2012 Original in EN Agenda point 7.1 Land Use and Land cover statistics (LUCAS) DIMESA Directors' Meeting
EUROPEAN COMMISSION EUROSTAT Directorate E: Sectoral and regional statistics Doc. ENV/DIMESA/7.1/2012 Original in EN Agenda point 7.1 Land Use and Land cover statistics (LUCAS) DIMESA Directors' Meeting
EuroGeoSurveys An Introduction
 EGS -ASGMI Workshop, Madrid, 2015 EuroGeoSurveys An Introduction 40 Years Listening to the Beat of the Earth Click to edit Master title Albania style EuroGeoSurveys Austria Lithuania Luxembourg Belgium
WHO EpiData. A monthly summary of the epidemiological data on selected vaccine preventable diseases in the European Region
 A monthly summary of the epidemiological data on selected vaccine preventable diseases in the European Region Table 1: Reported measles cases for the 12-month period February 2016 January 2017 (data as
PLUTO The Transport Response to the National Planning Framework. Dr. Aoife O Grady Department of Transport, Tourism and Sport
 PLUTO 2040 The Transport Response to the National Planning Framework Dr. Aoife O Grady Department of Transport, Tourism and Sport Dublin Economics Workshop 15 th September 2018 The Story of Pluto National
Bathing water results 2011 Slovakia
 Bathing water results Slovakia 1. Reporting and assessment This report gives a general overview of water in Slovakia for the season. Slovakia has reported under the Directive 2006/7/EC since 2008. When
Economic and Social Council
 United Nations Economic and Social Council Distr.: General 30 August 2012 Original: English Economic Commission for Europe Inland Transport Committee Working Party on Rail Transport Sixty-sixth session
Sampling scheme for LUCAS 2015 J. Gallego (JRC) A. Palmieri (DG ESTAT) H. Ramos (DG ESTAT)
 A. Palmieri (DG ESTAT) H. Ramos (DG ESTAT)") Sampling scheme for LUCAS 2015 J. Gallego (JRC) A. Palmieri (DG ESTAT) H. Ramos (DG ESTAT) Abstract The sampling design of LUCAS 2015 took into account experience from previous campaigns. While remaining
Sampling scheme for LUCAS 2015 J. Gallego (JRC) A. Palmieri (DG ESTAT) H. Ramos (DG ESTAT) Abstract The sampling design of LUCAS 2015 took into account experience from previous campaigns. While remaining
Global City Definition
 Regional Training Workshop on Human Settlement Indicators Global City Definition Dennis Mwaniki Global Urban Observatory, Research and Capacity Development Branch, UN-Habitat Bangkok, Thailand Outline
Improving rural statistics. Defining rural territories and key indicators of rural development
 Improving rural statistics Defining rural territories and key indicators of rural development Improving rural statistics Improving Rural Statistics In 2016, the Global Strategy to improve Agricultural
Variance estimation on SILC based indicators
 Variance estimation on SILC based indicators Emilio Di Meglio Eurostat emilio.di-meglio@ec.europa.eu Guillaume Osier STATEC guillaume.osier@statec.etat.lu 3rd EU-LFS/EU-SILC European User Conference 1
Weighted Voting Games
 Weighted Voting Games Gregor Schwarz Computational Social Choice Seminar WS 2015/2016 Technische Universität München 01.12.2015 Agenda 1 Motivation 2 Basic Definitions 3 Solution Concepts Core Shapley
Classifications of the Rural Areas in Bulgaria
 Centre for Research on Settlements and Urbanism Journal of Settlements and Spatial Planning J o u r n a l h o m e p a g e: http://jssp.reviste.ubbcluj.ro Classifications of the Rural Areas in Bulgaria
Directorate C: National Accounts, Prices and Key Indicators Unit C.3: Statistics for administrative purposes
 EUROPEAN COMMISSION EUROSTAT Directorate C: National Accounts, Prices and Key Indicators Unit C.3: Statistics for administrative purposes Luxembourg, 17 th November 2017 Doc. A6465/18/04 version 1.2 Meeting
NASDAQ OMX Copenhagen A/S. 3 October Jyske Bank meets 9% Core Tier 1 ratio in EU capital exercise
 NASDAQ OMX Copenhagen A/S JYSKE BANK Vestergade 8-16 DK-8600 Silkeborg Tel. +45 89 89 89 89 Fax +45 89 89 19 99 A/S www. jyskebank.dk E-mail: jyskebank@jyskebank.dk Business Reg. No. 17616617 - meets 9%
Towards indicators of proximity to services in Europe's major cities
 Towards indicators of proximity to services in Europe's major cities Enhancing the analytical use of the GMES Urban Atlas in combination with population distribution data Hugo Poelman European Commission
Final report for the Expert Group on the Integration of Statistical and Geospatial Information, May 2015
 Final report for the Expert Group on the Integration of Statistical and Geospatial Information, May 2015 Global geographic classification and geocoding practices Executive summary This final report was
Composition of capital NO051
 Composition of capital POWSZECHNA (in million Euro) Capital position CRD3 rules A) Common equity before deductions (Original own funds without hybrid instruments and government support measures other than
Composition of capital CY007 CY007 POWSZECHNACY007 BANK OF CYPRUS PUBLIC CO LTD
 Composition of capital POWSZECHNA (in million Euro) Capital position CRD3 rules A) Common equity before deductions (Original own funds without hybrid instruments and government support measures other than
Composition of capital ES060 ES060 POWSZECHNAES060 BANCO BILBAO VIZCAYA ARGENTARIA S.A. (BBVA)
") Composition of capital POWSZECHNA (in million Euro) Capital position CRD3 rules A) Common equity before deductions (Original own funds without hybrid instruments and government support measures other than
Composition of capital POWSZECHNA (in million Euro) Capital position CRD3 rules A) Common equity before deductions (Original own funds without hybrid instruments and government support measures other than
Composition of capital DE025
 Composition of capital POWSZECHNA (in million Euro) Capital position CRD3 rules A) Common equity before deductions (Original own funds without hybrid instruments and government support measures other than
Composition of capital LU045 LU045 POWSZECHNALU045 BANQUE ET CAISSE D'EPARGNE DE L'ETAT
 Composition of capital POWSZECHNA (in million Euro) Capital position CRD3 rules A) Common equity before deductions (Original own funds without hybrid instruments and government support measures other than
Composition of capital CY006 CY006 POWSZECHNACY006 CYPRUS POPULAR BANK PUBLIC CO LTD
 Composition of capital POWSZECHNA (in million Euro) Capital position CRD3 rules A) Common equity before deductions (Original own funds without hybrid instruments and government support measures other than
Composition of capital DE028 DE028 POWSZECHNADE028 DekaBank Deutsche Girozentrale, Frankfurt
 Composition of capital POWSZECHNA (in million Euro) Capital position CRD3 rules A) Common equity before deductions (Original own funds without hybrid instruments and government support measures other than
Composition of capital FR015
 Composition of capital POWSZECHNA (in million Euro) Capital position CRD3 rules A) Common equity before deductions (Original own funds without hybrid instruments and government support measures other than
Composition of capital FR013
 Composition of capital POWSZECHNA (in million Euro) Capital position CRD3 rules A) Common equity before deductions (Original own funds without hybrid instruments and government support measures other than
Composition of capital DE017 DE017 POWSZECHNADE017 DEUTSCHE BANK AG
 Composition of capital POWSZECHNA (in million Euro) Capital position CRD3 rules A) Common equity before deductions (Original own funds without hybrid instruments and government support measures other than
Composition of capital ES059
 Composition of capital POWSZECHNA (in million Euro) Capital position CRD3 rules A) Common equity before deductions (Original own funds without hybrid instruments and government support measures other than
Trends in Human Development Index of European Union
 Trends in Human Development Index of European Union Department of Statistics, Hacettepe University, Beytepe, Ankara, Turkey spxl@hacettepe.edu.tr, deryacal@hacettepe.edu.tr Abstract: The Human Development
United Nations Environment Programme
 UNITED NATIONS United Nations Environment Programme Distr. GENERAL 13 April 2016 EP ORIGINAL: ENGLISH EXECUTIVE COMMITTEE OF THE MULTILATERAL FUND FOR THE IMPLEMENTATION OF THE MONTREAL PROTOCOL Seventy-sixth
STATISTICA MULTIVARIATA 2
 1 / 73 STATISTICA MULTIVARIATA 2 Fabio Rapallo Dipartimento di Scienze e Innovazione Tecnologica Università del Piemonte Orientale, Alessandria (Italy) fabio.rapallo@uniupo.it Alessandria, May 2016 2 /
The trade dispute between the US and China Who wins? Who loses?
 1 Munich, Jan 10 th, 2019 The trade dispute between the US and China Who wins? Who loses? by Gabriel Felbermayr and Marina Steininger This report offers a brief, quantitative analysis of the potential
F M U Total. Total registrants at 31/12/2014. Profession AS 2, ,574 BS 15,044 7, ,498 CH 9,471 3, ,932
 Profession AS 2,949 578 47 3,574 BS 15,044 7,437 17 22,498 CH 9,471 3,445 16 12,932 Total registrants at 31/12/2014 CS 2,944 2,290 0 5,234 DT 8,048 413 15 8,476 HAD 881 1,226 0 2,107 ODP 4,219 1,921 5,958
APPLYING BORDA COUNT METHOD FOR DETERMINING THE BEST WEEE MANAGEMENT IN EUROPE. Maria-Loredana POPESCU 1
 APPLYING BORDA COUNT METHOD FOR DETERMINING THE BEST MANAGEMENT IN EUROPE Maria-Loredana POPESCU 1 ABSTRACT This article presents the Borda Count method and its application for ranking the regarding the
I&CLC2000 in support to new policy initiatives (INSPIRE, GMES,..)
") I&CLC2000 in support to new policy initiatives (INSPIRE, GMES,..) Manfred Grasserbauer, Director Joint Research Centre Institute for Environment and Sustainability 1 IMAGE 2000 European mosaic of satellite
I&CLC2000 in support to new policy initiatives (INSPIRE, GMES,..) Manfred Grasserbauer, Director Joint Research Centre Institute for Environment and Sustainability 1 IMAGE 2000 European mosaic of satellite
Lecture 9: Location Effects, Economic Geography and Regional Policy
 Lecture 9: Location Effects, Economic Geography and Regional Policy G. Di Bartolomeo Index, EU-25 = 100 < 30 30-50 50-75 75-100 100-125 >= 125 Canarias (E) Guadeloupe Martinique RÈunion (F) (F) (F) Guyane
Identification of Very Shallow Groundwater Regions in the EU to Support Monitoring
 Identification of Very Shallow Groundwater Regions in the EU to Support Monitoring Timothy Negley Paul Sweeney Lucy Fish Paul Hendley Andrew Newcombe ARCADIS Syngenta Ltd. Syngenta Ltd. Phasera Ltd. ARCADIS
Composition of capital as of 30 September 2011 (CRD3 rules)
") Composition of capital as of 30 September 2011 (CRD3 rules) Capital position CRD3 rules September 2011 Million EUR % RWA References to COREP reporting A) Common equity before deductions (Original own funds
Composition of capital as of 30 September 2011 (CRD3 rules) Capital position CRD3 rules September 2011 Million EUR % RWA References to COREP reporting A) Common equity before deductions (Original own funds
Compact guides GISCO. Geographic information system of the Commission
 Compact guides GISCO Geographic information system of the Commission What is GISCO? GISCO, the Geographic Information System of the COmmission, is a permanent service of Eurostat that fulfils the requirements
Changes in population and industries in the rural areas of Finland: from analysis of administrative regions to a GIS based approach
 Toivo Muilu*, Jarmo Rusanen** * University of Oulu, Department of Geography, Agrifood Research Finland, Ruukki Research Station P.O. Box 3000, FIN-90014, Finland toivo.muilu@oulu.fi ** University of Oulu,
The European regional Human Development and Human Poverty Indices Human Development Index
 n 02/2011 The European regional Human Development and Human Poverty Indices Contents 1. Introduction...1 2. The United Nations Development Programme Approach...1 3. Regional Human Development and Poverty
RISK ASSESSMENT METHODOLOGIES FOR LANDSLIDES
 RISK ASSESSMENT METHODOLOGIES FOR LANDSLIDES Jean-Philippe MALET Olivier MAQUAIRE CNRS & CERG. Welcome to Paris! 1 Landslide RAMs Landslide RAM A method based on the use of available information to estimate
MB of. Cable. Wholesale. FWBA (fixed OAOs. connections of which Full unbundled. OAO owning. Internet. unbundled broadband
 ECTA Broadband scorecard end of March 2009 Incumbent retail and resale xdsl connections Incumbent wholesale xdsl connections Entrant xdsl connections Broadband cable FTTH/B Other fixed broadband Mobile
This document is a preview generated by EVS
 TECHNICAL SPECIFICATION SPÉCIFICATION TECHNIQUE TECHNISCHE SPEZIFIKATION CEN ISO/TS 15530-3 December 2007 ICS 17.040.30 English Version Geometrical product specifications (GPS) - Coordinate measuring machines
Urban settlements delimitation using a gridded spatial support
 Urban settlements delimitation using a gridded spatial support Rita Nicolau 1, Elisa Vilares 1, Cristina Cavaco 1, Ana Santos 2, Mário Lucas 2 1 - General Directorate for Territory Development DGT, Portugal
Developing a global, people-based definition of cities and settlements
 Developing a global, people-based definition of cities and settlements Cooperation between: Directorate General for Regional and, Joint Research Centre, EUROSTAT (European Commission, European Union) OECD,
United Nations Environment Programme
 UNITED NATIONS United Nations Environment Programme Distr. GENERAL UNEP/OzL.Pro/ExCom/80/3 26 October 2017 EP ORIGINAL: ENGLISH EXECUTIVE COMMITTEE OF THE MULTILATERAL FUND FOR THE IMPLEMENTATION OF THE
Regional economy upgrading triple helix at work? Some selected cases from the Czech republic (and Central Eastern Europe) Pavel Ptáček
 Pavel Ptáček") Regional economy upgrading triple helix at work? Some selected cases from the Czech republic (and Central Eastern Europe) Pavel Ptáček Department of Geography Palacký University in Olomouc, Czech republic
Regional economy upgrading triple helix at work? Some selected cases from the Czech republic (and Central Eastern Europe) Pavel Ptáček Department of Geography Palacký University in Olomouc, Czech republic
TOWNs in Europe. Loris Servillo. Luxemburg, 12 December 2014
 Luxembourgish Small and Medium-Sized Towns in Europe: Challenges and Opportunities Ministère du Développement durable et des Infrastructures Luxemburg-Kirchberg TOWNs in Europe Loris Servillo Luxemburg,
ANNEX 2: Defining and measuring rurality. Prepared by Dr Steve Goss
 ANNEX 2: Defining and measuring rurality Prepared by Dr Steve Goss June 2013 1 TABLE OF CONTENTS 1 Definitions of rurality in common use... 2 1.1 Measuring rurality... 2 1.1.1 OECD rural urban division...
ORGANISATION FOR ECONOMIC CO-OPERATION AND DEVELOPMENT
 ORGANISATION FOR ECONOMIC CO-OPERATION AND DEVELOPMENT Pursuant to Article 1 of the Convention signed in Paris on 14th December 1960, and which came into force on 30th September 1961, the Organisation
Modelling structural change using broken sticks
 Modelling structural change using broken sticks Paul White, Don J. Webber and Angela Helvin Department of Mathematics and Statistics, University of the West of England, Bristol, UK Department of Economics,
Measuring Instruments Directive (MID) MID/EN14154 Short Overview
 MID/EN14154 Short Overview") Measuring Instruments Directive (MID) MID/EN14154 Short Overview STARTING POSITION Approval vs. Type examination In the past, country specific approvals were needed to sell measuring instruments in EU
Measuring Instruments Directive (MID) MID/EN14154 Short Overview STARTING POSITION Approval vs. Type examination In the past, country specific approvals were needed to sell measuring instruments in EU
PASSENGER RAIL ACCESSIBILITY IN EUROPE'S BORDER AREAS
 PASSENGER RAIL ACCESSIBILITY IN EUROPE'S BORDER AREAS HUGO POELMAN AND LINDE ACKERMANS Working Papers A series of short papers on regional research and indicators produced by the Directorate-General for
This document is a preview generated by EVS
 TECHNICAL SPECIFICATION SPÉCIFICATION TECHNIQUE TECHNISCHE SPEZIFIKATION CEN/TS 17268 December 2018 ICS 35.240.60 English Version Intelligent transport systems - ITS spatial data - Data exchange on changes
Publication Date: 15 Jan 2015 Effective Date: 12 Jan 2015 Addendum 6 to the CRI Technical Report (Version: 2014, Update 1)
") Publication Date: 15 Jan 2015 Effective Date: 12 Jan 2015 This document updates the Technical Report (Version: 2014, Update 1) and details (1) Replacement of interest rates, (2) CRI coverage expansion,
Publication Date: 15 Jan 2015 Effective Date: 12 Jan 2015 This document updates the Technical Report (Version: 2014, Update 1) and details (1) Replacement of interest rates, (2) CRI coverage expansion,
USING DOWNSCALED POPULATION IN LOCAL DATA GENERATION
 USING DOWNSCALED POPULATION IN LOCAL DATA GENERATION A COUNTRY-LEVEL EXAMINATION CONTENT Research Context and Approach. This part outlines the background to and methodology of the examination of downscaled
EUMETSAT. A global operational satellite agency at the heart of Europe. Presentation for the Spanish Industry Day Madrid, 15 March 2012
 EUMETSAT A global operational satellite agency at the heart of Europe Presentation for the Spanish Industry Day Madrid, Angiolo Rolli EUMETSAT Director of Administration EUMETSAT objectives The primary
A WALK TO THE PARK? ASSESSING ACCESS TO GREEN AREAS IN EUROPE'S CITIES
 Working Papers A series of short papers on regional research and indicators produced by the Directorate-General for Regional Policy WP 01/2016 A WALK TO THE PARK? ASSESSING ACCESS TO GREEN AREAS IN EUROPE'S
This document is a preview generated by EVS
 EESTI STANDARD EVS-EN ISO 19117:2006 Geographic information - Portrayal Geographic information - Portrayal EESTI STANDARDIKESKUS EESTI STANDARDI EESSÕNA NATIONAL FOREWORD Käesolev Eesti standard EVS-EN
Annotated Exam of Statistics 6C - Prof. M. Romanazzi
 1 Università di Venezia - Corso di Laurea Economics & Management Annotated Exam of Statistics 6C - Prof. M. Romanazzi March 17th, 2015 Full Name Matricola Total (nominal) score: 30/30 (2/30 for each question).
This document is a preview generated by EVS
 TECHNICAL REPORT RAPPORT TECHNIQUE TECHNISCHER BERICHT CEN/TR 15641 August 2007 ICS 67.050 English Version Food analysis - Determination of pesticide residues by LC- MS/MS - Tandem mass spectrometric parameters
ACCESSIBILITY TO SERVICES IN REGIONS AND CITIES: MEASURES AND POLICIES NOTE FOR THE WPTI WORKSHOP, 18 JUNE 2013
 ACCESSIBILITY TO SERVICES IN REGIONS AND CITIES: MEASURES AND POLICIES NOTE FOR THE WPTI WORKSHOP, 18 JUNE 2013 1. Significant differences in the access to basic and advanced services, such as transport,
Part A: Salmonella prevalence estimates. (Question N EFSA-Q ) Adopted by The Task Force on 28 March 2007
 Adopted by The Task Force on 28 March 2007") The EFSA Journal (2007) 98, 1-85 Report of the Task Force on Zoonoses Data Collection on the Analysis of the baseline survey on the prevalence of Salmonella in broiler flocks of Gallus gallus, in the EU,
The EFSA Journal (2007) 98, 1-85 Report of the Task Force on Zoonoses Data Collection on the Analysis of the baseline survey on the prevalence of Salmonella in broiler flocks of Gallus gallus, in the EU,
DEFINING AND MEASURING WORLD-METRO REGIONS FOR INTERNATIONAL COMPARISONS
 DEFINING AND MEASURING WORLD-METRO REGIONS FOR INTERNATIONAL COMPARISONS Mario Piacentini, OECD 27th Scorus Conference, 11-13 August 2010, Latvia Why we need comparable measures of city performance Growing
"Transport statistics" MEETING OF THE WORKING GROUP ON RAIL TRANSPORT STATISTICS. Luxembourg, 25 and 26 June Bech Building.
 Document: Original: Rail/2007/9/EN English "Transport statistics" MEETING OF THE WORKING GROUP ON RAIL TRANSPORT STATISTICS Luxembourg, 25 and 26 June 2007 Bech Building Room BECH Ampere Beginning 10:00
Analysis of European Topographic Maps for Monitoring Settlement Development
 Analysis of European Topographic Maps for Monitoring Settlement Development Ulrike Schinke*, Hendrik Herold*, Gotthard Meinel*, Nikolas Prechtel** * Leibniz Institute of Ecological Urban and Regional Development,
City definitions. Sara Ben Amer. PhD Student Climate Change and Sustainable Development Group Systems Analysis Division
 City definitions Sara Ben Amer PhD Student Climate Change and Sustainable Development Group Systems Analysis Division sbea@dtu.dk Contents 1. Concept of a city 2. Need for the city definition? 3. Challenges
Gravity Analysis of Regional Economic Interdependence: In case of Japan
 Prepared for the 21 st INFORUM World Conference 26-31 August 2013, Listvyanka, Russia Gravity Analysis of Regional Economic Interdependence: In case of Japan Toshiaki Hasegawa Chuo University Tokyo, JAPAN
The World in Europe, global FDI flows towards Europe
 The World in Europe, global FDI flows towards Europe Drivers and impacts of intra-european FDI Applied Research Scientific Report March 2018 This applied research activity is conducted within the framework
PROFECY Processes, Features and Cycles of Inner Peripheries in Europe
 PROFECY Processes, Features and Cycles of Inner Peripheries in Europe (Inner Peripheries: National territories facing challenges of access to basic services of general interest) Applied Research Final
The Combination of Geospatial Data with Statistical Data for SDG Indicators
 Session 3: Sustainable Development Goals, SDG indicators The Combination of Geospatial Data with Statistical Data for SDG Indicators Pier-Giorgio Zaccheddu (with the assistance of Francisco Vala & Cátia
Governments that have requested pre-export notifications pursuant to article 12, paragraph 10 (a), of the 1988 Convention
, of the 1988 Convention") Annex X Governments that have requested pre-export notifications pursuant to article 12, paragraph 10 (a), of the 1988 Convention 1. Governments of all exporting countries and territories are reminded
Annex X Governments that have requested pre-export notifications pursuant to article 12, paragraph 10 (a), of the 1988 Convention 1. Governments of all exporting countries and territories are reminded
This document is a preview generated by EVS
 TECHNICAL SPECIFICATION SPÉCIFICATION TECHNIQUE TECHNISCHE SPEZIFIKATION CEN/TS 16272-5 April 2014 ICS 93.100 English Version Railway applications - Track - Noise barriers and related devices acting on
EuroGeoSurveys & ASGMI The Geological Surveys of Europe and IberoAmerica
 EuroGeoSurveys & ASGMI The Geological Surveys of Europe and IberoAmerica Geological Surveys, what role? Legal mandate for data & information: Research Collection Management Interpretation/transformation
1. Demand for property on the coast
 1. Demand for property on the coast Key message Irrespective of density and location, population in Europe in general tends to concentrate in coastal areas. Detailed spatial elaboration of processes shows