Map Makeovers: How to Make Your Map Great!
|
|
|
- Olivia Sutton
- 5 years ago
- Views:
Transcription


1 Esri International User Conference San Diego, CA Technical Workshops Map Makeovers: How to Make Your Map Great! Charlie Frye, Esri, Redlands, Jim Herries, Esri, Redlands
2 Session Goals Demonstrate cartographic thinking in action Instill confidence to think cartographically
3 Cartographic Thinking Includes Geographically informed rationale for communicating Creative minimalist design intent Communicating through graphics Ensuring readability for your map s intended readers Good sensible judgment (in the opinion of others) Forced and blatant objectivity Clarity But cartography is a cumbersome word
4 Basically, your map should tell a story that your audience can interpret and relate to
5 Communication first! A map must work overtly if necessary Most things worth communicating need to be tailored with clarity of purpose and: - Effort lots of effort - Inspiration It s like opportunity: you need to make your own - Experience speed and confidence Strive for self-evidence in communication - Water is blue - Trees are green - Full spectrum color ramps for heat maps? Really
6 The Makeovers Fukushima Daiichi Empirical Bayesian Kriging??? (Mystery Map) Food Deserts
7 Fukushima Daiichi Charlie Frye

8 Before What is the story???
9 After Shows radiation and danger levels associated with the Fukushima Diachi reactor after the earthquake in Japan
10 What was changed? Colors Map elements (legend, etc.) Wording
11 Original Colors Color scheme is confusing

12 Final Colors Light-to-dark color sequence shows a pattern

13 A Good Title Matters Original title doesn t make sense- what does it mean to an educated layperson? Titles that don t work for thematic maps include: - The name of the place shown on the map - The data provider - The analysis method

14 Less obscure, but map s purpose is still unclear

15 This makes sense

16 Original Labeling Nice art piece! What does it mean? The dots don t match???

17 After the color change Is this city important? Does this reactor matter? What are these rings? Is the hillshade necessary?

18 Much clearer Certain cities are in the danger zone This is the reactor we are worried about Rings show distance No hillshade

19 Original map elements

20 Added map elements Added a Standard Error map- why is the error margin significant? Should we panic? What are the data sources? Where is this located in Japan?

21 Final map Added locator map, explanation of standard error Neatly aligned map elements

22 Brevity v. Accuracy This description is specific, but too wordy to fit on the map Big paragraphs are hard to read Only describes methodology

23 Speak to your audience Give the reader s eye a place to go - data sources and human impact as well as methodology Use simpler, broadly approachable language


24 Relate units to reader Before After

25 Final Result Color and lightness show a pattern; danger and location are clear Map elements add to understanding Standard error and methodology explained
26 ??? Charlie Frye
27 Before
28 After
29 What was changed? Color scheme Labeling Corporate review

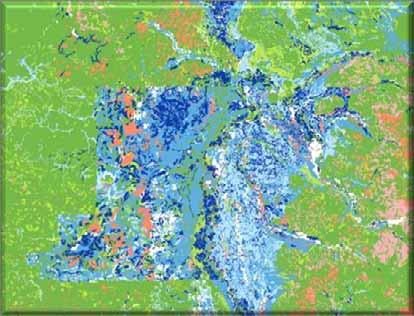
30 Original Color Scheme Qualitative color scheme It looks like a land cover map

31 Final Color Scheme Sequential colors show wettest to driest soil Readable as drainage classes

32 Labeling What location does this map show? Where are the water bodies that affect soil water content? Which features are more/less important?

33 Final Labeling Important roads and towns labeled Large rivers shown and labeled Tributaries shown Label colors and sizes follow hierachy
34 Corporate Review ESRI requires that all maps released to the public be reviewed before publish

35 Final Result


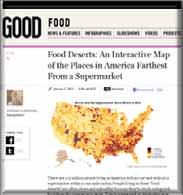
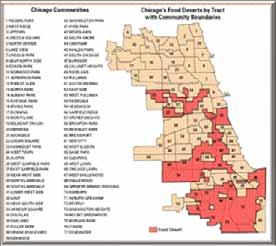
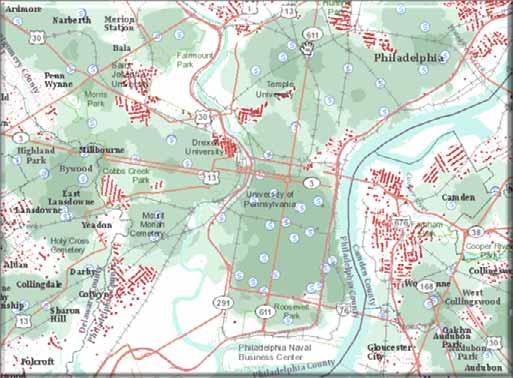
36 Food Deserts Jim Herries
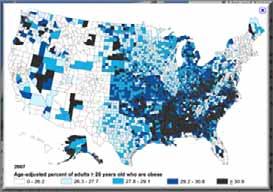
37 Food Deserts Defined by areas with limited access to affordable and nutritious food - Frequently associated with health issues (obesity) - Often associated with demographic characteristics - Sometimes includes competing destinations in the definition - Clear behavioral choice component - Access does not automatically result in good choices - lots of room to define a food desert, so it s important that the map is relatable and connects the reader to a definition.

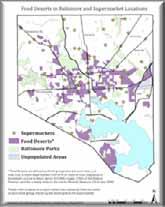
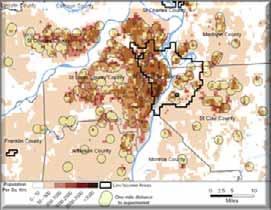
38 Small Scale Maps

39 Medium Scale Maps

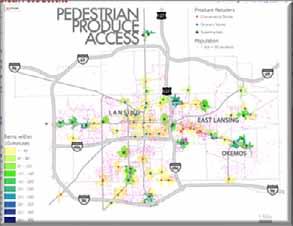
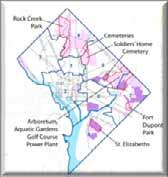
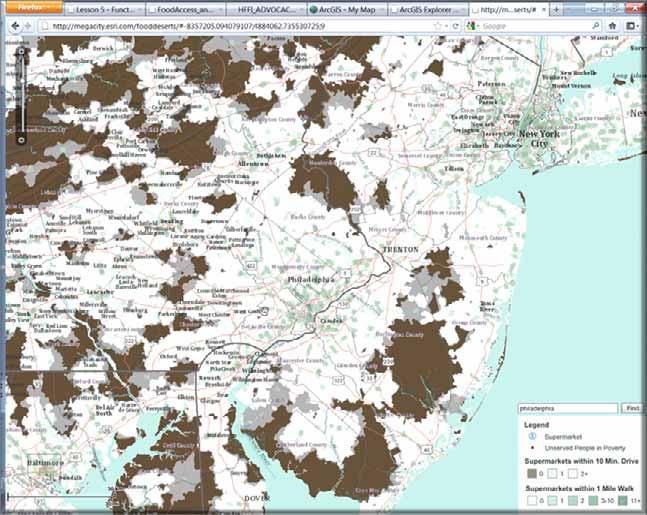
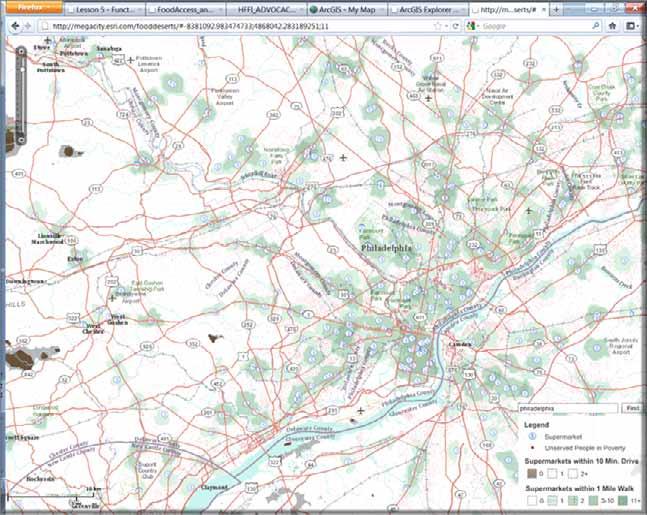
40 Large Scale Maps

41 Scale Matters Small and medium scales show national and regional patterns, but are less relatable Large scale maps showing neighborhood level information are something the public can relate to Would Zillow.com be as successful if it looked like this? Not all data is available at the neighborhood level
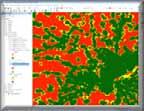
42 Before

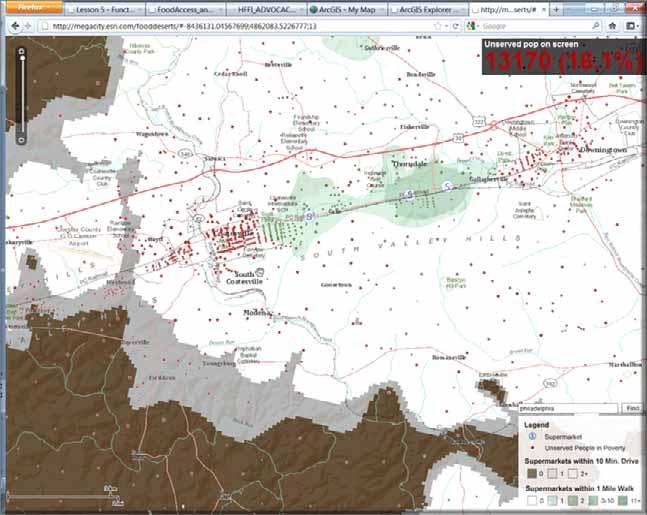
43 After Shows combined effects of socioeconomic status and significant differences in access
44 What was changed? Methodology Colors

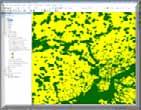
45 Original Methodology Which blocks have walk-able access to a supermarket? Goal was to put distance measurements in full view Partial view of how people access food
46 Revised Methodology Goal was to create a single, relatable measure of the food environment Distance is only a part of the story Assess areas based on multiple criteria - Poverty - Car ownership - % of income spent on food at home - Crime - Rural population - Distance to and number of restaurants and farmers markets - Distance to and number of supermarkets
 - 1 = likely not a problem area (yellow) - 2 = definitely not a problem area")
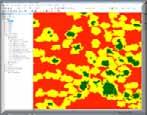
47 Classification Approach Use census block group data Interpolate a continuous surface using Natural Neighbor Reclassify the surface into 3 categories: - 0 = potential problem area (red) - 1 = likely not a problem area (yellow) - 2 = definitely not a problem area (green)

48 Raster calculator sum
 Candy?")
49 Original Colors Color scheme is culturally ambiguous: - Green is good - Red is bad (in the US) - (But red is good in China) Candy? People in poverty represented as dots Two measures of access shown: - Walkable - Drivable
50
51
52


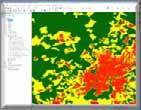
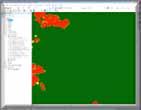
53 Almost Done Pre-shaded relief image and text Colors look like food Bilinear interpolation


54 Focal Statistics FocalMin smoothes the surface used as input for the hillshade and emphasizes the troughs


55 Hillshade before and after FocalMin
 - <16 and >13 is questionable (cheddar cheese) - <13 is a problem")
56 Final Colors Red indicates areas with a lower food environment score Color breaks based on cell score: - >16 is not a problem (squash) - <16 and >13 is questionable (cheddar cheese) - <13 is a problem (ketchup)
 Hillshade puts the reds in a trough for greater visual")
57 Final Result 60% transparency on the hillshade Color and hillshade show a pattern Neighborhoods with lower access and lower mobility have a lower score (red) Hillshade puts the reds in a trough for greater visual effect
58 Thank you! QUESTIONS? Please fill out your evaluations: it helps us improve every year Special thanks to Claire Steiner: Intern Extraordinaire!
Geographic Systems and Analysis
 Geographic Systems and Analysis New York University Robert F. Wagner Graduate School of Public Service Instructor Stephanie Rosoff Contact: stephanie.rosoff@nyu.edu Office hours: Mondays by appointment
from
 8Map Generalization and Classification Our human and natural environments are complex and full of detail. Maps work by strategically reducing detail and grouping phenomena together. Driven by your intent,
An Information Model for Maps: Towards Cartographic Production from GIS Databases
 An Information Model for s: Towards Cartographic Production from GIS Databases Aileen Buckley, Ph.D. and Charlie Frye Senior Cartographic Researchers, ESRI Barbara Buttenfield, Ph.D. Professor, University
Spatial Variation in Local Road Pedestrian and Bicycle Crashes
 2015 Esri International User Conference July 20 24, 2015 San Diego, California Spatial Variation in Local Road Pedestrian and Bicycle Crashes Musinguzi, Abram, Graduate Research Assistant Chimba,Deo, PhD.,
Lecture 5. Symbolization and Classification MAP DESIGN: PART I. A picture is worth a thousand words
 Lecture 5 MAP DESIGN: PART I Symbolization and Classification A picture is worth a thousand words Outline Symbolization Types of Maps Classifying Features Visualization Considerations Symbolization Symbolization
Aileen Buckley, Ph.D. and Charlie Frye
 An Information Model for Maps: Towards Production from GIS Databases Aileen Buckley, Ph.D. and Charlie Frye Researchers, ESRI GIS vs. cart GIS Outline of the presentation Introduction Differences between
Basic principles of cartographic design. Makram Murad-al-shaikh M.S. Cartography Esri education delivery team
 Basic principles of cartographic design Makram Murad-al-shaikh M.S. Cartography Esri education delivery team Cartographic concepts Cartography defined The communication channel - Why maps fail Objectives
The Five Themes of Geography
 The Five Themes of Geography The Five Themes of Geography Main Idea: Geographers use the Five Themes of Geography to help them study the Earth. The Five Themes of Geography Geography and You: Suppose a
Chapter 5. Presenting Data
 Chapter 5. Presenting Data Copyright McGraw-Hill Education. Permission required for reproduction or display. 5-1 Basic principles of map design 5-2 1 Map Design Process 5-3 The map objective The first
ArcGIS ArcMap: Making Professional Quality Thematic Maps Charlie Frye, ESRI Redlands Aileen Buckley, ESRI Redlands
 ArcGIS ArcMap: Making Professional Quality Thematic Maps Charlie Frye, ESRI Redlands Aileen Buckley, ESRI Redlands 1 ArcGIS ArcMap: Making Professional Quality Thematic Maps Charlie Frye, ESRI Redlands
Module 4 Educator s Guide Overview
 Module 4 Educator s Guide Overview Paths Module Overview This module looks at many different kinds of paths and considers why paths are where they are and how they look from space. Paths are usually not
CHAPTER 9 DATA DISPLAY AND CARTOGRAPHY
 CHAPTER 9 DATA DISPLAY AND CARTOGRAPHY 9.1 Cartographic Representation 9.1.1 Spatial Features and Map Symbols 9.1.2 Use of Color 9.1.3 Data Classification 9.1.4 Generalization Box 9.1 Representations 9.2
GED 554 IT & GIS. Lecture 6 Exercise 5. May 10, 2013
 GED 554 IT & GIS Lecture 6 Exercise 5 May 10, 2013 Free GIS data sources ******************* Mapping numerical data & Symbolization ******************* Exercise: Making maps for presentation GIS DATA SOFTWARE
Local Government Basemaps using ArcGIS
 Local Government Basemaps using ArcGIS Steve Grisé Scott Oppmann Tuesday, July 14, 10:15-11:30am SDCC 30B Topics Basemaps for Local Government Essential Application-Driven New Ideas Design Strategies Discussion
How not to give a poster: Some suggestions based on years of experience. D. Lund (credit to J. Granger)
") How not to give a poster: Some suggestions based on years of experience D. Lund (credit to J. Granger) Purpose of a Poster Summarize research concisely and attractively Help publicize it and generate discussion
How not to give a poster: Some suggestions based on years of experience D. Lund (credit to J. Granger) Purpose of a Poster Summarize research concisely and attractively Help publicize it and generate discussion
Final Group Project Paper. Where Should I Move: The Big Apple or The Lone Star State
 Final Group Project Paper Where Should I Move: The Big Apple or The Lone Star State By: Nathan Binder, Shannon Scolforo, Kristina Conste, Madison Quinones Main Goal: Determine whether New York or Texas
Different Displays of Thematic Maps:
 Different Displays of Thematic Maps: There are a number of different ways to display or classify thematic maps, including: Natural Breaks Equal Interval Quantile Standard Deviation What s important to
Quiz 1. Quiz Instruc ons. Question 1. Question 2. 2 pts. 3 pts. This is a preview of the published version of the quiz. Started: Jul 3 at 4:29pm
 Quiz 1 This is a preview of the published version of the quiz Started: Jul 3 at 4:29pm Quiz Instruc ons Quiz 1 Question 1 Which of the following is not a basic element of map design that should be considered
Chapter 7: Making Maps with GIS. 7.1 The Parts of a Map 7.2 Choosing a Map Type 7.3 Designing the Map
 Chapter 7: Making Maps with GIS 7.1 The Parts of a Map 7.2 Choosing a Map Type 7.3 Designing the Map What is a map? A graphic depiction of all or part of a geographic realm in which the real-world features
ENV208/ENV508 Applied GIS. Week 2: Making maps, data visualisation, and GIS output
 ENV208/ENV508 Applied GIS Week 2: Making maps, data visualisation, and GIS output Overview GIS Output Map Making Types of Maps Key Elements GIS Output Formats Table Graph Statistics Maps Map Making Maps
GTECH 380/722 Analytical and Computer Cartography Hunter College, CUNY Department of Geography
 GTECH 380/722 Analytical and Computer Cartography Hunter College, CUNY Department of Geography Fall 2014 Mondays 5:35PM to 9:15PM Instructor: Doug Williamson, PhD Email: Douglas.Williamson@hunter.cuny.edu
Week 8 Cookbook: Review and Reflection
 : Review and Reflection Week 8 Overview 8.1) Review and Reflection 8.2) Making Intelligent Maps: The map sheet as a blank canvas 8.3) Making Intelligent Maps: Base layers and analysis layers 8.4) ArcGIS
Overview. GIS Data Output Methods
 Overview GIS Output Formats ENV208/ENV508 Applied GIS Week 2: Making maps, data visualisation, and GIS output GIS Output Map Making Types of Maps Key Elements Table Graph Statistics Maps Map Making Maps
Geographical knowledge and understanding scope and sequence: Foundation to Year 10
 Geographical knowledge and understanding scope and sequence: Foundation to Year 10 Foundation Year 1 Year 2 Year 3 Year 4 Year 5 Year 6 Year level focus People live in places Places have distinctive features
GIS = Geographic Information Systems;
 What is GIS GIS = Geographic Information Systems; What Information are we talking about? Information about anything that has a place (e.g. locations of features, address of people) on Earth s surface,
Geography Can Be Cool. Seriously
 Geography Can Be Cool Seriously Why does geography matter? Geography: the study of looking at every aspect of the Earth s systems, such as human economies, societies, cultures, plants, animals, & climate.
Subject: Geography Scheme of Work: B1 to B6 Mastery tiles. Term: Autumn/Spring/Summer
 Subject: Geography Scheme of Work: B1 to B6 Mastery tiles Term: Autumn/Spring/Summer Topic / Unit(s) Overview / Context Introduction to geography. An introduction to geography including basic map skills
A Comprehensive Method for Identifying Optimal Areas for Supermarket Development. TRF Policy Solutions April 28, 2011
 A Comprehensive Method for Identifying Optimal Areas for Supermarket Development TRF Policy Solutions April 28, 2011 Profile of TRF The Reinvestment Fund builds wealth and opportunity for lowwealth communities
Designing GIS Databases to Support Mapping and Map Production Charlie Frye, ESRI Redlands Aileen Buckley, ESRI Redlands
 Designing GIS Databases to Support Mapping and Map Production Charlie Frye, ESRI Redlands Aileen Buckley, ESRI Redlands 1 Designing GIS Databases to Support Mapping and Map Production Charlie Frye, ESRI
Are You Maximizing The Value Of All Your Data?
 Are You Maximizing The Value Of All Your Data? Using The SAS Bridge for ESRI With ArcGIS Business Analyst In A Retail Market Analysis SAS and ESRI: Bringing GIS Mapping and SAS Data Together Presented
Demographic characteristics of the School of International Studies 9 th Grade class and their success their first semester.
 Project Tutorial 1. Topic Demographic characteristics of the School of International Studies 9 th Grade class and their success their first semester. 2. Research Question/Problem For the 9 th Grade class
The Choropleth Map Slide #2: Choropleth mapping enumeration units
 The Choropleth Map Slide #2: Choropleth mapping is a common technique for representing enumeration data These are maps where enumeration units, such as states or countries, are shaded a particular color
1. Origins of Geography
 II. ORIGINS AND BRANCHES OF GEOGRAPHY My Notes A. Origins of Geography Unit One 6 Before carefully examining the tools of the geographer, it would be useful to examine the origins and roots of this ancient
Observe Reflect Question What type of document is this?
 Appendix 2 An Empty Primary Source Analysis Tool and a Full Primary Source Analysis Tool with Guiding Questions Observe Reflect Question What type of document is this? What is the purpose of this document?
MAKING MAPS Cartographic Design & Principles Winter 2018
 MAKING MAPS Cartographic Design & Principles Winter 2018 Cartography the art, science, and technology of making maps, together with their study as scientific documents and works of art - The International
Urban Planning Word Search Level 1
 Urban Planning Word Search Level 1 B C P U E C O S Y S T E M P A R E U O E U R B A N P L A N N E R T N S T D H E C O U N T Y G E R E R D W R E N I C I T Y C O U N C I L A A A S U G G C I L A G P R I R
DATA APPLIANCE FOR ARCGIS
 DATA APPLIANCE FOR ARCGIS Data Appliance for ArcGIS Provides Access to Multi-Scale Basemaps Down to Medium Scale Levels Worldwide And Large Scale for Most of the World The Data Appliance includes Several
Map image from the Atlas of Oregon (2nd. Ed.), Copyright 2001 University of Oregon Press
, Copyright 2001 University of Oregon Press") Map Layout and Cartographic Design with ArcGIS Desktop Matthew Baker ESRI Educational Services Redlands, CA Education UC 2008 1 Seminar overview General map design principles Working with map elements
Map Layout and Cartographic Design with ArcGIS Desktop Matthew Baker ESRI Educational Services Redlands, CA Education UC 2008 1 Seminar overview General map design principles Working with map elements
Hennepin GIS. Tree Planting Priority Areas - Analysis Methodology. GIS Services April 2018 GOAL:
 Hennepin GIS GIS Services April 2018 Tree Planting Priority Areas - Analysis Methodology GOAL: To create a GIS data layer that will aid Hennepin County Environment & Energy staff in determining where to
KENTUCKY HAZARD MITIGATION PLAN RISK ASSESSMENT
 KENTUCKY HAZARD MITIGATION PLAN RISK ASSESSMENT Presentation Outline Development of the 2013 State Hazard Mitigation Plan Risk Assessment Determining risk assessment scale Census Data Aggregation Levels
Teacher s Guide Listen to Literature
 Teacher s Guide Listen to Literature Focus Skills Grammar Subject Pronouns Listening and Speaking Listen to Literature The Secret Water retold by Daphne Liu CD 1 Track 11 ABOUT THE FOLK TALE When Shu Fa
Spatial Pattern Analysis: Mapping Trends and Clusters
 2013 Esri International User Conference July 8 12, 2013 San Diego, California Technical Workshop Spatial Pattern Analysis: Mapping Trends and Clusters Lauren Rosenshein Bennett Brett Rose Presentation
The Physical Geographical Change of the Great Plains during the Dust Bowl (1930 s)
") The Physical Geographical Change of the Great Plains during the Dust Bowl (1930 s) Overview: This lesson shows how the Dust Bowl climate changed the physical geography of the Great Plains and forced the
The Physical Geographical Change of the Great Plains during the Dust Bowl (1930 s) Overview: This lesson shows how the Dust Bowl climate changed the physical geography of the Great Plains and forced the
Introducing GIS analysis
 1 Introducing GIS analysis GIS analysis lets you see patterns and relationships in your geographic data. The results of your analysis will give you insight into a place, help you focus your actions, or
ArcGIS Tools for Professional Cartography
 ArcGIS Tools for Professional Cartography By Makram Murad-al-shaikh M.S. Cartography Senior instructor ESRI Educational Services ICC - A Coruña - Spain, 9-16 July, 2005 Overview Overview of the ArcGIS
Eurostat regional yearbook using statistical maps and graphs to tell a story. Teodóra Brandmüller and Åsa Önnerfors, Eurostat
 Eurostat regional yearbook 2015 - using statistical maps and graphs to tell a story Teodóra Brandmüller and Åsa Önnerfors, Eurostat Gross domestic product (GDP) at current market prices per inhabitant
Praveen Subramani December 7, 2008 Athena: praveens Final Project: Placing a New Upscale Restaurant in Suffolk County, MA
 11.188 Final Project: Placing a New Upscale Restaurant in Suffolk County, MA Abstract According to an August 2008 New York Times article, over 60% of new restaurants, delis, and food shops close within
Integrating GIS into Food Access Analysis
 GIS Day at Kansas University Integrating GIS into Food Access Analysis Daoqin Tong School of Geography and Development Outline Introduction Research questions Method Results Discussion Introduction Food
CLAREMONT MASTER PLAN 2017: LAND USE COMMUNITY INPUT
 Planning and Development Department 14 North Street Claremont, New Hampshire 03743 Ph: (603) 542-7008 Fax: (603) 542-7033 Email: cityplanner@claremontnh.com www.claremontnh.com CLAREMONT MASTER PLAN 2017:
Neighborhood social characteristics and chronic disease outcomes: does the geographic scale of neighborhood matter? Malia Jones
 Neighborhood social characteristics and chronic disease outcomes: does the geographic scale of neighborhood matter? Malia Jones Prepared for consideration for PAA 2013 Short Abstract Empirical research
Key Processes
 Data Manipulation and Extraction Key Processes Key Processes Re-Projecting Data Selecting by Attributes Exporting Data Hillshade Reclassification Conversion of Raster to Vector Re-Projecting Data Purpose
Early College High School PreAP World Geography Summer Reading Assignment
 Early College High School PreAP World Geography Summer Reading Assignment In preparation for your studies in World Geography you will be familiarizing yourself with the 5 Themes of Geography. This assignment
Name Lab Instructor Miles
 EXERCISE EUROPEAN WORLD REGION Name Lab Instructor Time of Class Lab Due Date N W E S 0 300 600 Miles Figure 2.1 Europe Directions Part I and Part II are homework. Do Not Turn Part I and Part II me. I
Techniques for Science Teachers: Using GIS in Science Classrooms.
 Techniques for Science Teachers: Using GIS in Science Classrooms. After ESRI, 2008 GIS A Geographic Information System A collection of computer hardware, software, and geographic data used together for
Spatial Pattern Analysis: Mapping Trends and Clusters
 Esri International User Conference San Diego, California Technical Workshops July 24, 2012 Spatial Pattern Analysis: Mapping Trends and Clusters Lauren M. Scott, PhD Lauren Rosenshein Bennett, MS Presentation
Office of Geographic Information Systems
 Winter 2007 Department Spotlight SWCD GIS by Dave Holmen, Dakota County Soil and Water Conservation District The Dakota County Soil and Water Conservation District (SWCD) has collaborated with the Dakota
Council Workshop on Neighbourhoods Thursday, October 4 th, :00 to 4:00 p.m. Burlington Performing Arts Centre
 Council Workshop on Neighbourhoods Thursday, October 4 th, 2012 1:00 to 4:00 p.m. Burlington Performing Arts Centre Agenda Introductions Warm-Up Exercise Presentation Exercise Neighbourhood Planning Break
RiparianZone = buffer( River, 100 Feet )
") GIS Analysts perform spatial analysis when they need to derive new data from existing data. In GIS I, for example, you used the vector approach to derive a riparian buffer feature (output polygon) around
GIS Analysts perform spatial analysis when they need to derive new data from existing data. In GIS I, for example, you used the vector approach to derive a riparian buffer feature (output polygon) around
Grade 6 Social Studies
 Unit Title: Africa : Movement Location Place Human Region : Subject/Course: 6 th Grade Social Studies Essential Questions: peoples, cultures and ideas of the world? How is a location identified using map
Cartography and Geovisualization. Chapters 12 and 13 of your textbook
 Cartography and Geovisualization Chapters 12 and 13 of your textbook Why cartography? Maps are the principle means of displaying spatial data Exploration: visualization, leading to conceptualization of
APC Part I Workshop. Mapping and Cartography. 14 November 2014
 APC Part I Workshop Mapping and Cartography 14 November 2014 Cartography Cartography is the discipline dealing with the conception, production, dissemination and study of maps in all forms (ICA) A holistic
The Importance of Spatial Literacy
 The Importance of Spatial Literacy Dr. Michael Phoenix GIS Education Consultant Taiwan, 2009 What is Spatial Literacy? Spatial Literacy is the ability to be able to include the spatial dimension in our
Problem: Your paper doesn t fit on a 3x4 foot posterboard.
 Problem: Your paper doesn t fit on a 3x4 foot posterboard. Basics of Research Poster Design Nikki Dudley, The University of Iowa Digital Studio for Public Arts and Humanities Adapted by Bridget Draxler,
g. Sanger h. Denton i. Lewisville j. Dallas k. Prosper l. Frisco 2. What patterns can you identify as you study the places you located on the map?
 IR-15: Texas Cities 1. Use a Texas highway map as a reference to locate and mark the following cities on the outline map below: a. Anahuac b. Baytown c. Pasadena d. Houston e. Katy f. Brookshire g. Sanger
In matrix algebra notation, a linear model is written as
 DM3 Calculation of health disparity Indices Using Data Mining and the SAS Bridge to ESRI Mussie Tesfamicael, University of Louisville, Louisville, KY Abstract Socioeconomic indices are strongly believed
Transit Time Shed Analyzing Accessibility to Employment and Services
 Transit Time Shed Analyzing Accessibility to Employment and Services presented by Ammar Naji, Liz Thompson and Abdulnaser Arafat Shimberg Center for Housing Studies at the University of Florida www.shimberg.ufl.edu
Concepts and Applications of Kriging
 2013 Esri International User Conference July 8 12, 2013 San Diego, California Technical Workshop Concepts and Applications of Kriging Eric Krause Konstantin Krivoruchko Outline Intro to interpolation Exploratory
Sidestepping the box: Designing a supplemental poverty indicator for school neighborhoods
 Sidestepping the box: Designing a supplemental poverty indicator for school neighborhoods Doug Geverdt National Center for Education Statistics Laura Nixon U.S. Census Bureau 2018 Annual meeting of the
 estrandh@uoregon.edu Introduction The general topic of this paper describes a unique cartographic project depicting a mountain landscape for the Friends of Opal Creek (F.O.C.), a non-profit organization.
Tutorial 8 Raster Data Analysis
 Objectives Tutorial 8 Raster Data Analysis This tutorial is designed to introduce you to a basic set of raster-based analyses including: 1. Displaying Digital Elevation Model (DEM) 2. Slope calculations
MAP SCALE, ELEMENTS & USE
 MAP SCALE, ELEMENTS & USE Maps & Geospatial Concepts Fall 2015 What cartographic elements affect a map? Scale Elements Layout Data Representation Data Accuracy & Misuse Scale Scale http://micro.magnet.fsu.edu/primer/java/scienceop
Watershed Sciences 4930 & 6920 GEOGRAPHIC INFORMATION SYSTEMS
 Watershed Sciences 4930 & 6920 GEOGRAPHIC INFORMATION SYSTEMS WEEK TWELVE UNCERTAINTY IN GIS Joe Wheaton HOUSEKEEPING Labs Do you need extended Quinney Lab hours? Okay with Lab 9? Geoprocessing worked?
Demographic Data in ArcGIS. Harry J. Moore IV
 Demographic Data in ArcGIS Harry J. Moore IV Outline What is demographic data? Esri Demographic data - Real world examples with GIS - Redistricting - Emergency Preparedness - Economic Development Next
The econ Planning Suite: CPD Maps and the Con Plan in IDIS for Consortia Grantees Session 1
 The econ Planning Suite: CPD Maps and the Con Plan in IDIS for Consortia Grantees Session 1 1 Training Objectives Use CPD Maps to analyze, assess, and compare levels of need in your community Use IDIS
Your web browser (Safari 7) is out of date. For more security, comfort and. the best experience on this site: Update your browser Ignore
 is out of date. For more security, comfort and. the best experience on this site: Update your browser Ignore") Your web browser (Safari 7) is out of date. For more security, comfort and Activitydevelop the best experience on this site: Update your browser Ignore Places in the Park Why do we use symbols? Overview
Your web browser (Safari 7) is out of date. For more security, comfort and Activitydevelop the best experience on this site: Update your browser Ignore Places in the Park Why do we use symbols? Overview
MA30S APPLIED UNIT F: DATA MANAGEMENT CLASS NOTES
 1 MA30S APPLIED UNIT F: DATA MANAGEMENT CLASS NOTES 1. We represent mathematical information in more ways than just using equations! Often a simple graph or chart or picture can represent a lot of information.
Acknowledgments xiii Preface xv. GIS Tutorial 1 Introducing GIS and health applications 1. What is GIS? 2
 Acknowledgments xiii Preface xv GIS Tutorial 1 Introducing GIS and health applications 1 What is GIS? 2 Spatial data 2 Digital map infrastructure 4 Unique capabilities of GIS 5 Installing ArcView and the
Where, on Earth, are you?
 Where, on Earth, are you? We all live on a big planet called Earth, of course. But where on Earth? And if you want to go to a different spot on Earth other than the spot you are in, how do you know which
Cartographic Skills. L.O. To be aware of the various cartographic skills and when to use them
 Cartographic Skills L.O. To be aware of the various cartographic skills and when to use them Cartographic Skills The term cartography is derived from two words: Carto = map graphy = write/draw Cartography
Hampshire County Food Access Map
 Hampshire County Food Access Map v. 4/20/17 Hampshire County Food Access Map https://tinyurl.com/gqebkxx Overview The Hampshire County Food Access Map is an online map available at https://tinyurl.com/gqebkxx
Who Loves the Sun? Iguanas!
 Name Teacher Date / 5 ER.DFA2.2.R.RI.02: Identify and explain the main topic of a multiparagraph text as well as the focus of specific paragraphs within the text. Directions. Read the passage and select
PPT PRESENTATION. What works, and what doesn t. Associate Dean USF Graduate School. Revised
 PPT PRESENTATION TUTORIAL What works, and what doesn t RS Pollenz, PhD Associate Dean USF Graduate School Revised 5.5.10 Acknowledgment (This tutorial was based on a previous document constructed by by
Unit 1, Lesson 3 What Tools and Technologies Do Geographers Use?
 Unit 1, Lesson 3 What Tools and Technologies Do Geographers Use? Geographers use a variety of tools and technologies in investigating geographic questions. Maps and globes both represent the earth, but
Spatial Analyst. By Sumita Rai
 ArcGIS Extentions Spatial Analyst By Sumita Rai Overview What does GIS do? How does GIS work data models Extension to GIS Spatial Analyst Spatial Analyst Tasks & Tools Surface Analysis Surface Creation
Introduction to GIS I
 Introduction to GIS Introduction How to answer geographical questions such as follows: What is the population of a particular city? What are the characteristics of the soils in a particular land parcel?
Concepts and Applications of Kriging. Eric Krause
 Concepts and Applications of Kriging Eric Krause Sessions of note Tuesday ArcGIS Geostatistical Analyst - An Introduction 8:30-9:45 Room 14 A Concepts and Applications of Kriging 10:15-11:30 Room 15 A
Visualization of Commuter Flow Using CTPP Data and GIS
 Visualization of Commuter Flow Using CTPP Data and GIS Research & Analysis Department Southern California Association of Governments 2015 ESRI User Conference l July 23, 2015 l San Diego, CA Jung Seo,
Theory, Concepts and Terminology
 GIS Workshop: Theory, Concepts and Terminology 1 Theory, Concepts and Terminology Suggestion: Have Maptitude with a map open on computer so that we can refer to it for specific menu and interface items.
Appropriate Selection of Cartographic Symbols in a GIS Environment
 Appropriate Selection of Cartographic Symbols in a GIS Environment Steve Ramroop Department of Information Science, University of Otago, Dunedin, New Zealand. Tel: +64 3 479 5608 Fax: +64 3 479 8311, sramroop@infoscience.otago.ac.nz
Shaping Your Neighbourhood
 Shaping Your Neighbourhood Building a Core Sustainable Neighbourhood Action Plan Nov. 25 & 26, 2006 Welcome! Peter Russell Planner, Holland Barrs Planning Group Inc. Role in this project: Work with the
Different types of maps and how to read them.
 Different types of maps and how to read them. A map is a picture or representation of the Earth's surface, showing how things are related to each other by distance, direction, and size. Maps have been
Geo 327G Semester Project. Landslide Suitability Assessment of Olympic National Park, WA. Fall Shane Lewis
 Geo 327G Semester Project Landslide Suitability Assessment of Olympic National Park, WA Fall 2011 Shane Lewis 1 I. Problem Landslides cause millions of dollars of damage nationally every year, and are
Outline. 15. Descriptive Summary, Design, and Inference. Descriptive summaries. Data mining. The centroid
 Outline 15. Descriptive Summary, Design, and Inference Geographic Information Systems and Science SECOND EDITION Paul A. Longley, Michael F. Goodchild, David J. Maguire, David W. Rhind 2005 John Wiley
Learning Target : Describe the purposes and uses of different types of maps.
 Learning Target : Describe the purposes and uses of different types of maps. Directions: 1. Below, place a where you think you are located. 2. In which continent are you located? 3. In which country are
GIS Lecture 5: Spatial Data
 GIS Lecture 5: Spatial Data GIS 1 Outline Vector Data Formats Raster Data Formats Map Projections Coordinate Systems US Census geographic files US Census data files GIS Data Sources GIS 2 Vector Data Formats
Cartography: Modeling GIS data for Mapmaking. Aileen Buckley, Ph.D. Senior Cartographic Researcher, ESRI. Barbara Buttenfield, Ph.D.
 Slide 1 Cartography: Modeling GIS data for Mapmaking Aileen Buckley, Ph.D. Senior Cartographic Researcher, ESRI Barbara Buttenfield, Ph.D. Professor, University of Colorado-Boulder Thank you coming to
Introduction To Raster Based GIS Dr. Zhang GISC 1421 Fall 2016, 10/19
 Introduction To Raster Based GIS Dr. Zhang GISC 1421 Fall 2016, 10/19 Model of the course Using and making maps Navigating GIS maps Map design Working with spatial data Geoprocessing Spatial data infrastructure
Mapping Data 1: Constructing a Choropleth Map
 Mapping Data 1: Constructing a Choropleth Map OVERVIEW & OBJECTIVES Students will become acquainted with mapping data and understanding the importance of recognizing patterns by constructing a choropleth
Response on Interactive comment by Anonymous Referee #1
 Response on Interactive comment by Anonymous Referee #1 Sajid Ali First, we would like to thank you for evaluation and highlighting the deficiencies in the manuscript. It is indeed valuable addition and
How Geographers View the World: Human Geography. ESSENTIAL QUESTION: How does geography influence the way people live?
 How Geographers View the World: Human Geography ESSENTIAL QUESTION: How does geography influence the way people live? Geographers Think Spatially Gefffffdgfhfjgjp Guiding Question: What does it mean to