Cartography and Geovisualization. Chapters 12 and 13 of your textbook
|
|
|
- Francine Haynes
- 5 years ago
- Views:
Transcription

1 Cartography and Geovisualization Chapters 12 and 13 of your textbook


 Communication: convey information")
2 Why cartography? Maps are the principle means of displaying spatial data Exploration: visualization, leading to conceptualization of patterns and processes. (Chap 13) Communication: convey information and findings that are difficult to express verbally. (Chap 12)

3 The Connected States of America illustrates the emerging communities based on the social interactions defined by the anonymous cellphone usage data on AT&T s network. One can find that the communities defined by human networks do not always coincide with the administrative boundaries. Exploration and Communication
4 Cartographic communication Synthesis Presentation Confirmation Exploration


5 Why cartography? To become a complete GIS analyst, you need to become familiar with the basic elements of cartography and, in particular, map design.
6
7 Maps are not infallible. Maps must lie in order to convey information. All maps introduce distortion: shape (conformance) size (equivalence) direction distance Often mistakes are made: "The image on a map is drawn by human hands, controlled by operations in a human mind. John Kirkland Wright 1942 Sometimes errors are made deliberately.
8 How do they lie? Through: Simplification: choosing to take a complicated feature and make it simple Displacement: moving things from their true location Smoothing: making jagged shapes rounded Selection: Choosing what to show Enhancement: causing features to look like we expect, rather than how they really are Aggregation: merging features together Orientation (N/S or arbitrary rotation [to maximize use of page]) Think of how mandates would influence each of those processes.
9 Map design criteria What is the motive, intent or goal of the map? Who will read the map (the audience)? What are Map design criteria? How will the map be used: stand alone, in a report, or simply for your viewing? What things / circumstances would require you to design a map differently? Real world Conceptualization Measurement & representation Analysis Interpretation, validation & exploration
10 Cartographic transformations Three stages in the transformation of the Earth's surface from reality to map can be recognized: Primary: geometric -- map projections Going from 3-D reality to 2-D cartographic representation requires several transformations. What would they be? Secondary: semi-geometric -- geoid to ellipsoid (Datums) Tertiary: generalization Generalization is a non-reversible process, and therefore must be carefully considered.


11 Cartographic transformations Three stages in the transformation of the Earth's surface from reality to map are generally recognized: Primary: geometric -- map projections Secondary: semi-geometric -- geoid to ellipsoid (Datums) Tertiary: generalization Generalization is a non-reversible process, and therefore must be carefully considered.
12 Generalization Generalization has four main components: Simplification: excluding unwanted, enhancing desired Classification: reduces complexity (qualitative, quantitative) Symbolization: implicit or explicit, mimetic or abstract Induction: logical inference--integration of parts into a whole What are the main concepts / requirements / processes Mandates & the involved scale at which in generalization? the data will be displayed are a prime consideration.
13 Generalization? Simplification Topology? Classification Both processes reduce the detail

14 Simplification Impact of simplification tolerance Simplification routines are available in most GISystems. The first image: ungeneralized data set, the second: generalized at an 0.1 foot tolerance, the third: generalized at a 10 foot tolerance. A necessary process as the scale changes ArcMap s simplify line ArcMap s Generalization toolset
15 Classification Categorical (nominal, ordinal) vs numerical (interval, ratio) data [NOIR] Categorical classification: mostly qualitative Numerical classification: quantitative Number of classes? (4-6 is considered best)
 Ideographic schemes (e.")

 and try different class schemes before settling on one.")
16 Classification schemes Dividing up data: numerical classification Exogenous schemes Arbitrary schemes (e.g., equal interval) Ideographic schemes (e.g., natural breaks, quantiles) Serial schemes (e.g., standard deviation) Unclassified schemes When looking at numerical data, what ways of grouping the data can you think of? You should always explore your data (e.g., histograms) and try different class schemes before settling on one. Know your data!
17 Symbolization components (PGEs) Can you identify ways in which graphic components can be varied in order to distinguish different graphic elements? (Such as allowing a reader to distinguish different lines, different areas.)

18 Symbolization components (PGEs) In creating symbols, what can you vary? Primary Graphic Elements Is the data quantitative or qualitative? A useful site that explains statistics.
![Bertin s graphic primitives, extended from seven to ten variables (the variable location is not depicted) [Info here] PGEs You must also consider how the spatial primitives (point, line, area)](/docs-images/90/101224433/images/19-2.jpg "interact with the Primary Graphic Elements (PGEs). Source: MacEachren 1994 (from Visualization in Geographical Information Systems, Hearnshaw H.M. and Unwin D.J. (eds.). Reproduced by permission of John Wiley & Sons, Ltd.")
19 Bertin s graphic primitives, extended from seven to ten variables (the variable location is not depicted) [Info here] PGEs You must also consider how the spatial primitives (point, line, area) interact with the Primary Graphic Elements (PGEs). Source: MacEachren 1994 (from Visualization in Geographical Information Systems, Hearnshaw H.M. and Unwin D.J. (eds.). Reproduced by permission of John Wiley & Sons, Ltd.)

20 Qualitative data symbolization Abstract vs mimetic (Implicit vs explicit)

21 Ternary plots

22 Visual hierarchy Other cartographic concerns, such as the visual hierarchy, are also important. The proper use of type is also very important.


23 Every map must contain some fundamental elements Inset map Scale Author North Arrow Map Body Data Source All maps should be enclosed by a neat line. Title Grid Legend Projection Depending on the scale, you may or may not need a grid and an inset map.


24 Map design is an art It is easy to make a map, but making a great looking map... requires consideration of all of the elements, and a sense of design.
.")
25 Dasymetric maps Dasymetric maps use the intersection of two datasets to obtain a more precise estimate of a spatial distribution. For example, census tracts often contain large tracts of land whereon people cannot live (e.g., parks, industrial areas). Excluding those areas when determining statistics such as population density can make a significant difference to the values.
26 Summary Cartography is both an art and a science. Maps are fundamental to any GIS project. Modern advances in GISoftware make it very easy to produce both good and bad maps. Any map is just one of all possible maps. Complex maps can be difficult to understand.
27 Summary We have only scratched the surface with respect to the elements of cartography that are important in presenting the results of your GIS-based analyses. The quality of the map will determine, to a large extent, the reception of your work. A poorly produced map suggests that the analyses were also poorly handled. A quality map suggests that the analyses were also done properly and with due care.

28
0 Maps are the principle means of displaying spatial data
 Why cartography? 0 Maps are the principle means of displaying spatial data 0 Exploration: visualization, leading to conceptualization of patterns and processes. (Chap 13) 0 Communication: convey information
Software. People. Data. Network. What is GIS? Procedures. Hardware. Chapter 1
 People Software Data Network Procedures Hardware What is GIS? Chapter 1 Why use GIS? Mapping Measuring Monitoring Modeling Managing Five Ms of Applied GIS Chapter 2 Geography matters Quantitative analyses
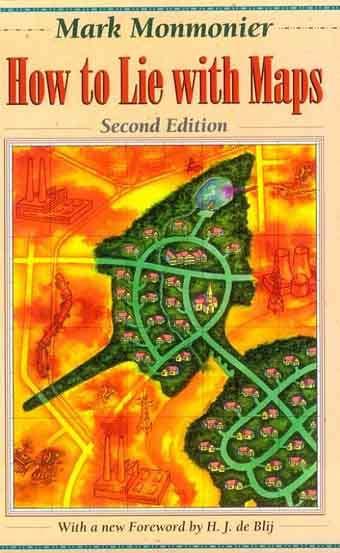
How to Lie with Maps. Author: Mark Monmonier
 How to Lie with Maps Author: Mark Monmonier Maps are not infallible. "The image on a map is drawn by human hands, controlled by operations in a human mind. John Kirkland Wright in 1942. An Example- What
Geographers Perspectives on the World
 What is Geography? Geography is not just about city and country names Geography is not just about population and growth Geography is not just about rivers and mountains Geography is a broad field that
Chapter 7: Making Maps with GIS. 7.1 The Parts of a Map 7.2 Choosing a Map Type 7.3 Designing the Map
 Chapter 7: Making Maps with GIS 7.1 The Parts of a Map 7.2 Choosing a Map Type 7.3 Designing the Map What is a map? A graphic depiction of all or part of a geographic realm in which the real-world features
Overview key concepts and terms (based on the textbook Chang 2006 and the practical manual)
") Introduction Geo-information Science (GRS-10306) Overview key concepts and terms (based on the textbook 2006 and the practical manual) Introduction Chapter 1 Geographic information system (GIS) Geographically
Introduction Geo-information Science (GRS-10306) Overview key concepts and terms (based on the textbook 2006 and the practical manual) Introduction Chapter 1 Geographic information system (GIS) Geographically
Representation of Geographic Data
 GIS 5210 Week 2 The Nature of Spatial Variation Three principles of the nature of spatial variation: proximity effects are key to understanding spatial variation issues of geographic scale and level of
What is a map? A simple representation of the real world Two types of maps
 Mapping with GIS What is a map? A simple representation of the real world Two types of maps Reference maps showing reference features such as roads, locations, political boundaries, cities etc. Thematic
CHAPTER 9 DATA DISPLAY AND CARTOGRAPHY
 CHAPTER 9 DATA DISPLAY AND CARTOGRAPHY 9.1 Cartographic Representation 9.1.1 Spatial Features and Map Symbols 9.1.2 Use of Color 9.1.3 Data Classification 9.1.4 Generalization Box 9.1 Representations 9.2
Intro to GIS Summer 2012 Data Visualization
 Intro to GIS Summer 2012 Data Visualization UNDERSTANDING YOUR MAP DATA Qualitative vs. Quantitative Data Qualitative Data classified by category e.g. Soil types, Animal Species Quantitative Data grouped
GEOREFERENCING, PROJECTIONS Part I. PRESENTING DATA Part II
 Week 7 GEOREFERENCING, PROJECTIONS Part I PRESENTING DATA Part II topics of the week Georeferencing Coordinate systems Map Projections ArcMap and Projections Geo-referencing Geo-referencing is the process
MAP SCALE, ELEMENTS & USE
 MAP SCALE, ELEMENTS & USE Maps & Geospatial Concepts Fall 2015 What cartographic elements affect a map? Scale Elements Layout Data Representation Data Accuracy & Misuse Scale Scale http://micro.magnet.fsu.edu/primer/java/scienceop
Geog183: Cartographic Design and Geovisualization Winter Quarter 2017 Lecture 6: Map types and Data types
 Geog183: Cartographic Design and Geovisualization Winter Quarter 2017 Lecture 6: Map types and Data types Data types Data dimension: Point, Line, Area, Volume (Text) Data continuity: Discrete, Point, Polygon:
APC Part I Workshop. Mapping and Cartography. 14 November 2014
 APC Part I Workshop Mapping and Cartography 14 November 2014 Cartography Cartography is the discipline dealing with the conception, production, dissemination and study of maps in all forms (ICA) A holistic
Appropriate Selection of Cartographic Symbols in a GIS Environment
 Appropriate Selection of Cartographic Symbols in a GIS Environment Steve Ramroop Department of Information Science, University of Otago, Dunedin, New Zealand. Tel: +64 3 479 5608 Fax: +64 3 479 8311, sramroop@infoscience.otago.ac.nz
MAKING MAPS Cartographic Design & Principles Winter 2018
 MAKING MAPS Cartographic Design & Principles Winter 2018 Cartography the art, science, and technology of making maps, together with their study as scientific documents and works of art - The International
Designing Better Maps
 Designing Better Maps presented by: Tim Haithcoat University of Missouri Columbia with materials of: Dennis Fizsimons, SW Texas State University George McCleary, Jr., University of Kansas Design is a Choice
Geo-Visualization. GRS09/10 Ron van Lammeren
 Geo-Visualization GRS09/10 Ron van Lammeren 2/30 Theory Semiologie Graphique http://www.flickr.com/photos/kbean/491051226/ 3/30 How to present my geo data? Visualization definitions Map making Cartographic
Geo-Visualization. GRS1011 Ron van Lammeren
 Geo-Visualization GRS1011 Ron van Lammeren Theory Semiologie Graphique http://www.flickr.com/photos/kbean/491051226/ 2/30 How to present my geo data? Visualization definitions Map making Cartographic process
An Information Model for Maps: Towards Cartographic Production from GIS Databases
 An Information Model for s: Towards Cartographic Production from GIS Databases Aileen Buckley, Ph.D. and Charlie Frye Senior Cartographic Researchers, ESRI Barbara Buttenfield, Ph.D. Professor, University
What should you consider concerning colors in maps in order to illustrate qualitative data, and quantitative data, respectively? Exemplify.
 1, Cartography, 10 p (HA) _ When doing a map based on quantitative data you have for example to decide upon the classification. Three common classifications are Equal interval, Quantiles (percentiles)
The Choropleth Map Slide #2: Choropleth mapping enumeration units
 The Choropleth Map Slide #2: Choropleth mapping is a common technique for representing enumeration data These are maps where enumeration units, such as states or countries, are shaded a particular color
Basic principles of cartographic design. Makram Murad-al-shaikh M.S. Cartography Esri education delivery team
 Basic principles of cartographic design Makram Murad-al-shaikh M.S. Cartography Esri education delivery team Cartographic concepts Cartography defined The communication channel - Why maps fail Objectives
Chapter 5. Presenting Data
 Chapter 5. Presenting Data Copyright McGraw-Hill Education. Permission required for reproduction or display. 5-1 Basic principles of map design 5-2 1 Map Design Process 5-3 The map objective The first
GED 554 IT & GIS. Lecture 6 Exercise 5. May 10, 2013
 GED 554 IT & GIS Lecture 6 Exercise 5 May 10, 2013 Free GIS data sources ******************* Mapping numerical data & Symbolization ******************* Exercise: Making maps for presentation GIS DATA SOFTWARE
STUDYING THE EFFECT OF DISTORTION IN BASIC MAP ELEMENTS FOR THE DEGREE OF SPATIAL ACCURACY OF GAZA STRIP MAPS
 STUDYING THE EFFECT OF DISTORTION IN BASIC MAP ELEMENTS FOR THE DEGREE OF SPATIAL ACCURACY OF GAZA STRIP MAPS Maher A. El-Hallaq Assistant professor, Civil Engineering Department, IUG,, mhallaq@iugaza.edu.ps
Topic 9: Proportional Symbol Mapping Chapter 9: Chang Chapter 8: Dent
 Geography 38/42:286 GIS 1 Topic 9: Proportional Symbol Mapping Chapter 9: Chang Chapter 8: Dent 1 What is a Proportional Symbol Map? Depicts spatial variations in value or magnitude Using proportionally
Version 1.1 GIS Syllabus
 GEOGRAPHIC INFORMATION SYSTEMS CERTIFICATION Version 1.1 GIS Syllabus Endorsed 1 Version 1 January 2007 GIS Certification Programme 1. Target The GIS certification is aimed at: Those who wish to demonstrate
Theory, Concepts and Terminology
 GIS Workshop: Theory, Concepts and Terminology 1 Theory, Concepts and Terminology Suggestion: Have Maptitude with a map open on computer so that we can refer to it for specific menu and interface items.
9/7/ Studying Geography: Introduction to Mapping. Cartographic Terms. Cartographic Terms. Geographers Tools. Geographers Needs.
 Geographers Tools Studying Geography: Introduction to Mapping Prof. Anthony Grande Hunter College Geography Lecture design, content and presentation AFG0918. Individual images and illustrations may be
Terms GIS GPS Vector Data Model Raster Data Model Feature Attribute Table Point Line Polygon Pixel RGB Overlay Function
 FINAL REVIEW FOR GIS (2016) PRACTICAL COMPONENT The first 40 mins of the exam will be open book and will require you to make a map using all the techniques learned over the semester. This map will be e-mailed
Item Sampler. Tennessee End of Course Assessment Biology I Form 6. Reporting Category 6: Biodiversity and Change. Student Name. Teacher Name.
 Student Name Teacher Name School System Item Sampler Tennessee End of Course Assessment Biology I Form 6 Reporting Category 6: Biodiversity and Change PEARSON Developed and published under contract with
Observe Reflect Question What type of document is this?
 Appendix 2 An Empty Primary Source Analysis Tool and a Full Primary Source Analysis Tool with Guiding Questions Observe Reflect Question What type of document is this? What is the purpose of this document?
Lecture 2. A Review: Geographic Information Systems & ArcGIS Basics
 Lecture 2 A Review: Geographic Information Systems & ArcGIS Basics GIS Overview Types of Maps Symbolization & Classification Map Elements GIS Data Models Coordinate Systems and Projections Scale Geodatabases
4 Studying Geography:
 4 Studying Geography: Introduction to Mapping Prof. Anthony Grande Hunter College Geography Lecture design, content and presentation AFG0119 Individual images and illustrations may be subject to prior
Making Maps With GIS. Making Maps With GIS
 Making Maps With GIS Getting Started with GIS Chapter 7 Making Maps With GIS 7.1 The Parts of a Map 7.2 Choosing a Map Type 7.3 Designing the Map 1 What is a map? Map is the communication tool for the
Physical Geography Lab Activity #15
 Physical Geography Lab Activity #15 Due date Name Choropleth Maps COR Objective 1 & 7, SLOs 1 & 3 15.1. Introduction Up until this point we have used maps to find locations on the Earth. While they are
WHO IS WHO ON THE MAP?
 WHO IS WHO ON THE MAP? Eng. Stanislav Vasilev, PhD Assoc. Professor in Department of Photogrammetry and Cartography 1, Christo Smirnenski blvd. 1046 Sofia, Bulgaria e-mail: vasilevs_fgs@uacg.bg Abstract
Summary thematic point techniques
 Summary thematic point techniques Dot maps Graduated symbols Bar linear (1D) proportional symbol Circle 2D proportional symbol (and other shapes) Range graded symbols classed by size Segmented symbols
Studying Geography: Tools of the Trade
 GEOG 101 TUTORING AVAILABLE Free tutoring is available to all GEOG 101 students by experienced teachers. No appointment is necessary. Walk in/walk out sessions. Bring your notes, textbook, handouts, and
APC PART I WORKSHOP MAPPING AND CARTOGRAPHY
 APC PART I WORKSHOP MAPPING AND CARTOGRAPHY 5 June 2015 MAPPING The act or process of making a map. A matching process where the points of one set are matched against the points of another set. Graphical
Item Sampler. Tennessee End of Course Assessment Biology I Form 6. Reporting Category 6: Biodiversity and Change. Student Name. Teacher Name.
 Student Name Teacher Name School System Item Sampler Tennessee End of Course Assessment Biology I Form 6 Reporting Category 6: Biodiversity and Change PEARSON Developed and published under contract with
Intro to GIS In Review
 Intro to GIS In Review GIS Analysis Winter 2016 GIS A quarter in review Geographic data types Acquiring GIS data Projections / Coordinate systems Working with attribute tables Data classification Map design
Different Displays of Thematic Maps:
 Different Displays of Thematic Maps: There are a number of different ways to display or classify thematic maps, including: Natural Breaks Equal Interval Quantile Standard Deviation What s important to
Chapter 02 Maps. Multiple Choice Questions
 Chapter 02 Maps Multiple Choice Questions 1. Every projection has some degree of distortion because A. a curved surface cannot be represented on a flat surface without distortion. B. parallels and meridians
Agenda. Introduction Exercise 1 Map Types. Part 1 ArcGIS Information and Organization Part 2 Purpose, Audience & Constraints.
 Agenda Introduction Exercise 1 Map Types Part 1 ArcGIS Information and Organization Part 2 Purpose, Audience & Constraints Exercise 2 Map Critique Break Part 3 Basic Cartographic Design Principles Part
Geographical knowledge and understanding scope and sequence: Foundation to Year 10
 Geographical knowledge and understanding scope and sequence: Foundation to Year 10 Foundation Year 1 Year 2 Year 3 Year 4 Year 5 Year 6 Year level focus People live in places Places have distinctive features
Logical data integration into digital landscape model 1
 Logical data integration into digital landscape model 1 1 Lecture contents: 1. Overview of geodata applicable in the modelling in the landscape. 2. Introduction into the models and modelling. 3. Classification
Fundamentals of ArcGIS Desktop Pathway
 Fundamentals of ArcGIS Desktop Pathway Table of Contents ArcGIS Desktop I: Getting Started with GIS 3 ArcGIS Desktop II: Tools and Functionality 5 Understanding Geographic Data 8 Understanding Map Projections
Overview. GIS Data Output Methods
 Overview GIS Output Formats ENV208/ENV508 Applied GIS Week 2: Making maps, data visualisation, and GIS output GIS Output Map Making Types of Maps Key Elements Table Graph Statistics Maps Map Making Maps
Revive, Contemplate, and Integrate Lesson Plan. Your Name: Amanda Pellerin, Amanda Kodeck, and Pat Cruz Grade: 7
 Revive, Contemplate, and Integrate Lesson Plan Your Name: Amanda Pellerin, Amanda Kodeck, and Pat Cruz Grade: 7 Unit of Study: Social Studies/ Visual Arts Lesson Title: Modern Day Maps Goal/Purpose: Students
ENV208/ENV508 Applied GIS. Week 2: Making maps, data visualisation, and GIS output
 ENV208/ENV508 Applied GIS Week 2: Making maps, data visualisation, and GIS output Overview GIS Output Map Making Types of Maps Key Elements GIS Output Formats Table Graph Statistics Maps Map Making Maps
Electric Field Mapping
 Electric Field Mapping I hear and I forget. I see and I remember. I do and I understand Anonymous OBJECTIVE To visualize some electrostatic potentials and fields. THEORY Our goal is to explore the electric
Children s Understanding of Generalisation Transformations
 Children s Understanding of Generalisation Transformations V. Filippakopoulou, B. Nakos, E. Michaelidou Cartography Laboratory, Faculty of Rural and Surveying Engineering National Technical University
Diamonds on the soles of scholarship?
 Educational Performance and Family Income Diamonds on the soles of scholarship? by Introduction Problem Two young girls entering elementary school in Boston aspire to be doctors. Both come from twoparent,
Data Collection: What Is Sampling?
 Project Planner Data Collection: What Is Sampling? Title: Data Collection: What Is Sampling? Originally Published: 2017 Publishing Company: SAGE Publications, Inc. City: London, United Kingdom ISBN: 9781526408563
Where on Earth are We? Projections and Coordinate Reference Systems
 Where on Earth are We? Projections and Coordinate Reference Systems Nick Eubank February 11, 2018 If I told you that there was a treasure chest buried at the coordinates p2, 5q, your first response might
Geography 281 Map Making with GIS Project Four: Comparing Classification Methods
 Geography 281 Map Making with GIS Project Four: Comparing Classification Methods Thematic maps commonly deal with either of two kinds of data: Qualitative Data showing differences in kind or type (e.g.,
Mapping Census Data in ArcView 3.x
 Mapping Census Data in ArcView 3.x Nancy Lemay University of Ottawa Barbara Znamirowski Trent University Workshop Outline Defining certain concepts and terms: Map scale, coordinate systems, datum and projections.
Map Makeovers: How to Make Your Map Great!
 Esri International User Conference San Diego, CA Technical Workshops Map Makeovers: How to Make Your Map Great! Charlie Frye, Esri, Redlands, Jim Herries, Esri, Redlands Session Goals Demonstrate cartographic
Vector Analysis: Farm Land Suitability Analysis in Groton, MA
 Vector Analysis: Farm Land Suitability Analysis in Groton, MA Written by Adrienne Goldsberry, revised by Carolyn Talmadge 10/9/2018 Introduction In this assignment, you will help to identify potentially
Applied Cartography and Introduction to GIS GEOG 2017 EL. Lecture-1 Chapters 1 and 2
 Applied Cartography and Introduction to GIS GEOG 2017 EL Lecture-1 Chapters 1 and 2 What is GIS? A Geographic Information System (GIS) is a computer system for capturing, storing, querying, analyzing and
Quiz 1. Quiz Instruc ons. Question 1. Question 2. 2 pts. 3 pts. This is a preview of the published version of the quiz. Started: Jul 3 at 4:29pm
 Quiz 1 This is a preview of the published version of the quiz Started: Jul 3 at 4:29pm Quiz Instruc ons Quiz 1 Question 1 Which of the following is not a basic element of map design that should be considered
An Introduction to Scientific Research Methods in Geography Chapter 3 Data Collection in Geography
 An Introduction to Scientific Research Methods in Geography Chapter 3 Data Collection in Geography Learning Objectives What is the distinction between primary and secondary data sources? What are the five
Projections and Coordinate Systems
 Projections and Coordinate Systems Overview Projections Examples of different projections Coordinate systems Datums Projections Overview Projections and Coordinate Systems GIS must accurately represent
Experiment 2 Electric Field Mapping
 Experiment 2 Electric Field Mapping I hear and I forget. I see and I remember. I do and I understand Anonymous OBJECTIVE To visualize some electrostatic potentials and fields. THEORY Our goal is to explore
Spatial Analysis II. Spatial data analysis Spatial analysis and inference
 Spatial Analysis II Spatial data analysis Spatial analysis and inference Roadmap Spatial Analysis I Outline: What is spatial analysis? Spatial Joins Step 1: Analysis of attributes Step 2: Preparing for
Geomatics: Geotechnologies in Action, Grade 12, University/College Expectations
 Geographic Foundations: Space and Systems SSV.01 explain how the earth is modelled for scientific and mapping purposes; SSV.02 demonstrate an understanding of basic spatial concepts; Page 1 SSV.03 explain
Slide #1: Slide #2: Slide #3: Slide #4: Slide #5: Cartographic Basics Slide #6: Cartographic Basics Slide #13: Scale & Generalization
 Slide #1: Introduction to Cartography Slide #2: Overview Slide #3: What is a map? (Clarke, 2001) Slide #4: What is a map? (ICA, 1995) o In short, a map is a tool used for sharing and presenting spatial
Introduction to Geographic Information Science. Updates/News. Last Lecture 1/23/2017. Geography 4103 / Spatial Data Representations
 Geography 4103 / 5103 Introduction to Geographic Information Science Spatial Data Representations Updates/News Waitlisted students First graded lab this week: skills learning Instructional labs vs. independence
LIMITS AND DERIVATIVES
 2 LIMITS AND DERIVATIVES LIMITS AND DERIVATIVES The intuitive definition of a limit given in Section 2.2 is inadequate for some purposes.! This is because such phrases as x is close to 2 and f(x) gets
Quality and Coverage of Data Sources
 Quality and Coverage of Data Sources Objectives Selecting an appropriate source for each item of information to be stored in the GIS database is very important for GIS Data Capture. Selection of quality
MAP SYMBOL BREWER A NEW APPROACH FOR A CARTOGRAPHIC MAP SYMBOL GENERATOR
 MAP SYMBOL BREWER A NEW APPROACH FOR A CARTOGRAPHIC MAP SYMBOL GENERATOR Olaf Schnabel Institute of Cartography, Swiss Federal Institute of Technology (ETH) CH-8093 Zurich, Switzerland schnabel@karto.baug.ethz.ch
GTECH 380/722 Analytical and Computer Cartography Hunter College, CUNY Department of Geography
 GTECH 380/722 Analytical and Computer Cartography Hunter College, CUNY Department of Geography Fall 2014 Mondays 5:35PM to 9:15PM Instructor: Doug Williamson, PhD Email: Douglas.Williamson@hunter.cuny.edu
Calculus at Rutgers. Course descriptions
 Calculus at Rutgers This edition of Jon Rogawski s text, Calculus Early Transcendentals, is intended for students to use in the three-semester calculus sequence Math 151/152/251 beginning with Math 151
Structure of Materials Prof. Anandh Subramaniam Department of Material Science and Engineering Indian Institute of Technology, Kanpur
 Structure of Materials Prof. Anandh Subramaniam Department of Material Science and Engineering Indian Institute of Technology, Kanpur Lecture - 5 Geometry of Crystals: Symmetry, Lattices The next question
Interactive Cumulative Curves for Exploratory Classification Maps
 Interactive Cumulative Curves for Exploratory Classification Maps Gennady Andrienko and Natalia Andrienko Fraunhofer Institute AIS Schloss Birlinghoven, 53754 Sankt Augustin, Germany Tel +49-2241-142486,
Cartography the art of making maps
 Cartography the art of making maps A map is a drawing or a picture of the earths surface, showing how things are related to each other by distance, direction and size. Maps are used for: Navigation Distance
Outline. Geographic Information Analysis & Spatial Data. Spatial Analysis is a Key Term. Lecture #1
 Geographic Information Analysis & Spatial Data Lecture #1 Outline Introduction Spatial Data Types: Objects vs. Fields Scale of Attribute Measures GIS and Spatial Analysis Spatial Analysis is a Key Term
Workbook Exercises for Statistical Problem Solving in Geography
 Workbook Exercises for Statistical Problem Solving in Geography Arthur J. Lembo, Jr. This workbook is for use with the popular textbook Introduction to Statistical Problem Solving in Geography, and includes
Using ArcGIS for Hydrology and Watershed Analysis:
 Using ArcGIS 10.2.2 for Hydrology and Watershed Analysis: A guide for running hydrologic analysis using elevation and a suite of ArcGIS tools Anna Nakae Feb. 10, 2015 Introduction Hydrology and watershed
3. Give two examples of early mapmaking and its (unusual?) materials for the maps. (a)
 materials for the maps. (a)") Thinking Geographically: Key Issue 1 How Do Geographers Describe Where Things Are? Rubenstein Ch. 1 pp. 4 12 1. Define map: 2. Define cartography: MAPS 3. Give two examples of early mapmaking and its (unusual?)
Thinking Geographically: Key Issue 1 How Do Geographers Describe Where Things Are? Rubenstein Ch. 1 pp. 4 12 1. Define map: 2. Define cartography: MAPS 3. Give two examples of early mapmaking and its (unusual?)
A CARTOGRAPHIC DATA MODEL FOR BETTER GEOGRAPHICAL VISUALIZATION BASED ON KNOWLEDGE
 A CARTOGRAPHIC DATA MODEL FOR BETTER GEOGRAPHICAL VISUALIZATION BASED ON KNOWLEDGE Yang MEI a, *, Lin LI a a School Of Resource And Environmental Science, Wuhan University,129 Luoyu Road, Wuhan 430079,
from
 8Map Generalization and Classification Our human and natural environments are complex and full of detail. Maps work by strategically reducing detail and grouping phenomena together. Driven by your intent,
Georeferencing, Map Projections, Cartographic Concepts. -Coordinate Systems -Datum
 Georeferencing, Map Projections, Cartographic Concepts -Map Projections -Coordinate Systems -Datum Map projection is "the process of systematically transforming positions on the Earth's spherical surface
6. Provide an example of developments in geography for each of the following:
 Thinking Geographically: Key Issue 1 How Do Geographers Describe Where Things Are? Rubenstein, p. 5-13 1. Define map: 2. Define cartography: MAPS 3. Give two examples of developments in early mapmaking.
Name Class Date. For each pair of terms, explain how the meanings of the terms differ.
 Skills Worksheet Chapter Review USING KEY TERMS For each pair of terms, explain how the meanings of the terms differ. 1. true north and magnetic north 2. latitude and longitude 3. equator and prime meridian
GEOGRAPHIC INFORMATION SYSTEM (GES203)
") GEOGRAPHIC INFORMATION SYSTEM (GES203) GIS Components Level 2:1 By: Mrs Mupfiga Presentation Layout Recap Learning Objectives Components of GIS GIS Data References Lecture Evaluation Learning Objectives
GEOGRAPHIC INFORMATION SYSTEM (GES203) GIS Components Level 2:1 By: Mrs Mupfiga Presentation Layout Recap Learning Objectives Components of GIS GIS Data References Lecture Evaluation Learning Objectives
The details represented in the map depends mostly on the scale at which the map is designed.
 Measurement IN GIS A map is a visual representation of an area a symbolic depiction highlighting relationships between elements of that space such as objects, region, themes. The details represented in
Spatial analysis. 0 move the objects and the results change
 0 Outline: Roadmap 0 What is spatial analysis? 0 Transformations 0 Introduction to spatial interpolation 0 Classification of spatial interpolation methods 0 Interpolation methods 0 Areal interpolation
GIS Test Drive What a Geographic Information System Is and What it Can Do. Alison Davis-Holland
 GIS Test Drive What a Geographic Information System Is and What it Can Do Alison Davis-Holland adavisholland@gmail.com WHO AM I? Geospatial Analyst M.S. in Geographic and Cartographic Sciences Use GIS
Susan Cutter et al. Aug, 2002, The Professional Geographer, 54(3): David Tenenbaum GEOG 070 UNC-CH Spring 2005
: David Tenenbaum GEOG 070 UNC-CH Spring 2005") What is Geography? Geography is not just about city and country names Geography is not just about population and growth Geography is not just about rivers and mountains Geography is a broad field that
What is Geography? Geography is not just about city and country names Geography is not just about population and growth Geography is not just about rivers and mountains Geography is a broad field that
Geographic Systems and Analysis
 Geographic Systems and Analysis New York University Robert F. Wagner Graduate School of Public Service Instructor Stephanie Rosoff Contact: stephanie.rosoff@nyu.edu Office hours: Mondays by appointment
Taxonomies of Building Objects towards Topographic and Thematic Geo-Ontologies
 Taxonomies of Building Objects towards Topographic and Thematic Geo-Ontologies Melih Basaraner Division of Cartography, Department of Geomatic Engineering, Yildiz Technical University (YTU), Istanbul Turkey
GIS CONCEPTS ARCGIS METHODS AND. 3 rd Edition, July David M. Theobald, Ph.D. Warner College of Natural Resources Colorado State University
 GIS CONCEPTS AND ARCGIS METHODS 3 rd Edition, July 2007 David M. Theobald, Ph.D. Warner College of Natural Resources Colorado State University Copyright Copyright 2007 by David M. Theobald. All rights
Massachusetts Institute of Technology Department of Urban Studies and Planning
 Massachusetts Institute of Technology Department of Urban Studies and Planning 11.520: A Workshop on Geographic Information Systems 11.188: Urban Planning and Social Science Laboratory GIS Principles &
Notation, Matrices, and Matrix Mathematics
 Geographic Information Analysis, Second Edition. David O Sullivan and David J. Unwin. 010 John Wiley & Sons, Inc. Published 010 by John Wiley & Sons, Inc. Appendix A Notation, Matrices, and Matrix Mathematics
Maps as Tools for Visual Analysis of Geospatial Data. Dr. Claus Rinner Department of Geography and Environmental Studies Ryerson University
 Maps as Tools for Visual Analysis of Geospatial Data Dr. Claus Rinner Department of Geography and Environmental Studies Ryerson University 1 Geography and data analytics 80% of all datasets are said to
State and National Standard Correlations NGS, NCGIA, ESRI, MCHE
 GEOGRAPHIC INFORMATION SYSTEMS (GIS) COURSE DESCRIPTION SS000044 (1 st or 2 nd Sem.) GEOGRAPHIC INFORMATION SYSTEMS (11, 12) ½ Unit Prerequisite: None This course is an introduction to Geographic Information
SRJC Applied Technology 54A Introduction to GIS
 SRJC Applied Technology 54A Introduction to GIS Overview Lecture of Geographic Information Systems Fall 2004 Santa Rosa Junior College Presented By: Tim Pudoff, GIS Coordinator, County of Sonoma, Information