Designing Better Maps
|
|
|
- Shanna Thompson
- 6 years ago
- Views:
Transcription


1 Designing Better Maps presented by: Tim Haithcoat University of Missouri Columbia with materials of: Dennis Fizsimons, SW Texas State University George McCleary, Jr., University of Kansas
2 Design is a Choice The theory of the visual display of quantitative information consists of principles that generate design options and that guide choices among options. The principles should not be applied rigidly or in a peevish spirit; they are not logically or mathematically certain; and it is better to violate any principle than to place graceless or inelegant marks on paper. 2
3 Design is a Choice Most principles of design should be greeted with some skepticism, for work authority can dominate our vision, and we may come to see only through the lens of word authority rather than with our own eyes. 3
4 Design is a Choice What is to be sought in designs for the display of information is the clear portrayal of complexity. Not the complication of the simple, rather the task of the designer is to give visual access to the subtle and the difficult -- that is, the revelation of the complex. 4
5 Generalization Selection Classification Simplification Exaggeration Symbolization Induction 5
6 Classification Unclassed Classed
7 Simplification less more
8 Exaggeration less more
9 Symbolization Abstract Representational


10 Induction Positive Negative
11 Shape Texture or Pattern Visual Variables Direction Color or Hue Size Value Point 0-D R Y G Spatial Dimension Line 1-D Area 2-D or more R Y G Y R Y G Qualitative Quantitative after: Jacques Bertin. Graphics and Graphic Information Processing. New York: Walter de Gruyter, 1981.


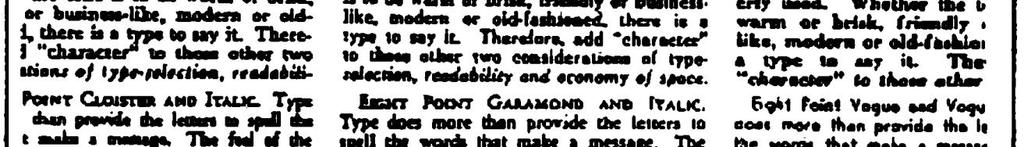
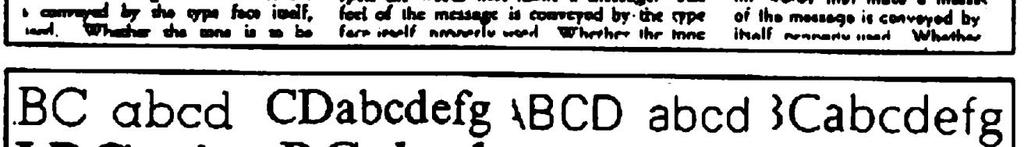
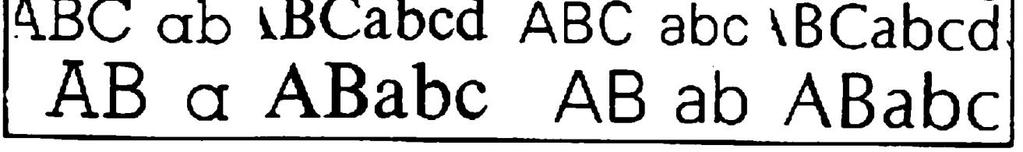
12 Visual Variables Typography Size Value Direction Texture Form Color
13 Foreground Increasing Visual Hierarchy Background Modified from: Borden Dent, Cartography - Thematic Map Design, 3rd ed. p. 264.
14 Scale/ Resolution 200% 150% 100% 75% 50%
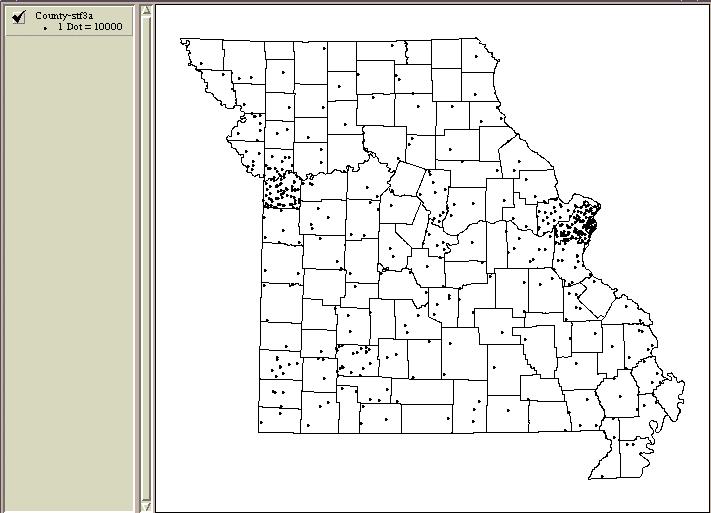
15 Map Type & Symbolization (1 of 3) Symbol Map Type Characteristics Point Dot Map flow of distribution & relative spatial density (high/medium/ low relative density) interval construction - ordinal reading Related & limiting variables used in construction Point Graduated Symbols Specific point or areal unit -- actual location, centroid or weighted center Good for: high/low values in close proximity Symbolizing totals Aggregate data for several locations or areas 15
16
17
18
19 Map Type & Symbolization (2 of 3) Symbol Map Type Characteristics Line Flow/ Network Width of line represents data along route Segmented or uniform Line/ Surface Volume Isarithmic Isometric - points/isoplethic - areas Form of distribution & gradients most important Distribution treated as surface of a volume Surface contours - ridges, troughs, peaks, etc. - arrangement or direction of magnitudes Commensurable - data values can be derived Planimetric - correct horizontal position (within accuracy limits of map) For continuous data only 19
20 Map Type & Symbolization (3 of 3) Symbol Map Type Characteristics Area Choropleth Data by areal units - enumeration units Relative location most important Totals seldom mapped; usually derived values or averages (mean, median, mode) Ratios/densities - account for area Ratios, percentages, proportions - eliminate area For discontinuous data only (or data treated as such) Area Cartogram Data by areal units Continuous (connected) or discontinuous (separated) Data scaled proportionately as unit s area 20

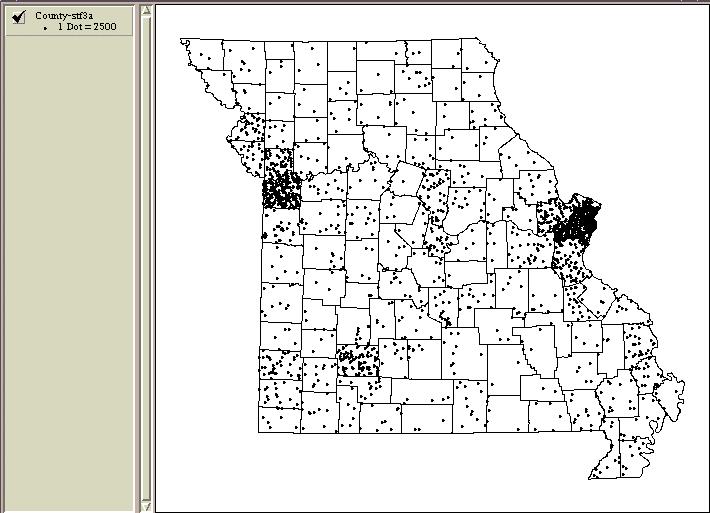
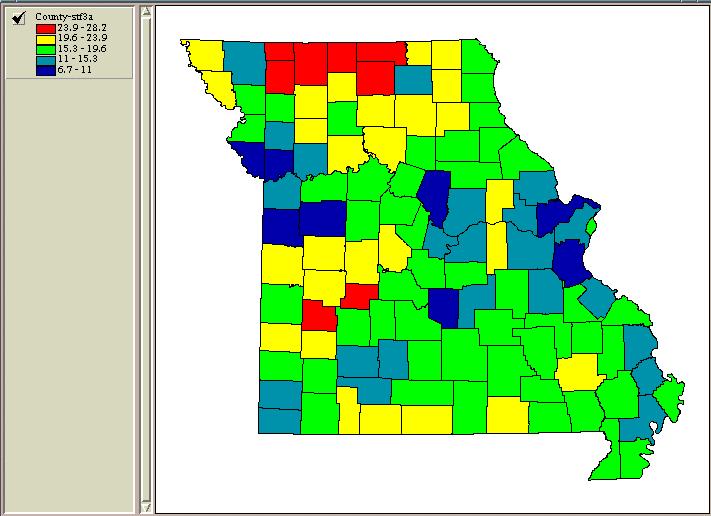
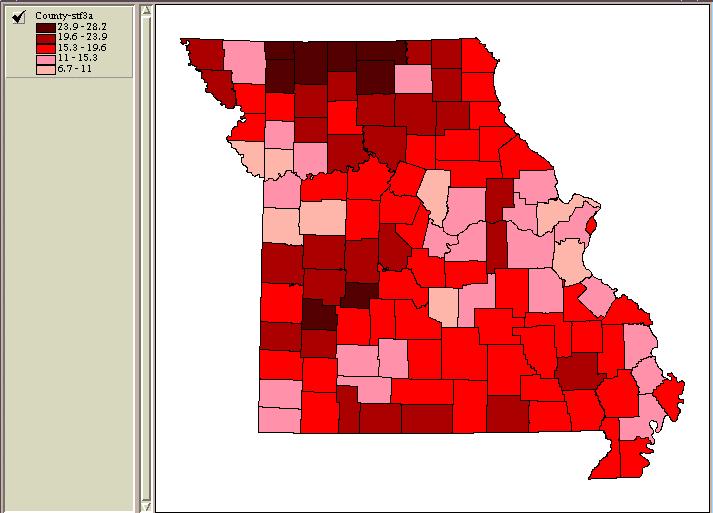
21 Dot Map Graduated Symbol Common Quantitative Map Types Choropleth Isoline
22 Measurement Level Nominal Ordinal Interval Ratio Point 0-Dimension Post Office Church Airport City Town Village Population % Unemployed Spatial Dimension Line 1-Dimension Continental Divide Railroad Highway Trail Highway Interstate 2 Lanes 4 Lanes 6 Lanes Vehicles (per hour) Area 2-Dimensions or more Ownership Crop Yield Date of Annexation Population Density Brown Jones Smith Wilson High Medium Low Very Low Persons per Square mile > <50
23 The Map Design Process: Planning What information do you need to convey? Is a map the best way to communicate this information? What problem or question needs to be addressed? What information needs to be included? Is data readily available? Who is the audience? Is there a given style for this type of map? Will the map be part of a series? Sketch out several layout designs Reality: money, materials, equipment, labor, & time How will I proceed? 23
24 The Map Decision Triangle Quality Time Cost 24
25 The Map Design Process: Composing What map elements need to be visually dominant? What will be the final size of the map? How will the map be reproduced? Does the title or caption clearly identify the map purpose? Does each map element directly contribute to your purpose? Are sufficient base data present to support the spatial distribution? Do I need to define any map elements in a legend? Does the map communicate pattern(s)? Is the map too complex? Too Simple? 25
26 The Map Design Process: Editing & Proofreading (1 of 2) Has the quality of the data been overstated? Have sources of statistical or borrowed data been cited? Are there any typographic, grammar, or spelling errors? Are there any geographical errors? Is the map legible and readable? Has anything been omitted? Have I communicated the information? How do I know? 26
27 The Map Design Process: Editing & Proofreading (2 of 2) Does the visual hierarchy reflect levels of importance? Do all of the map elements work as a whole? Can anything be omitted? Am I willing to let this map stand as a measure of my ability and accomplishment? 27
28 Map Critique Checklist (1 of 2) The overall look of the map Subjective, or emotional, reactions to the map (authoritativeness, pleasingness, ) Content of the map Potential uses Appropriateness of a map for the purpose Projection Accuracy, precision General mapping method Point symbols Line symbols Color - aesthetics, suitability for representing content Other area symbols Type style, size, placement Details 28
29 Map Critique Checklist (2 of 2) Suitability for the audience Execution & printing quality Layout Scale of map Clarity of scale indicators - literal & graphic Legend clarity Title clarity & adequacy Quality of the paper Map size, format, folding Context of the map (series, individual; accompanied or not by text, ) Use of the map in practice (e.g. road map/street map cannot be tested strictly in an armchair) Overall effectiveness 29
30 Factors Affecting Choropleth Maps Data quality Appropriate size, shape & number of enumeration units Scale of resolution Availability -- alternatives (surrogate variables) Data preprocessing -- rate, ratio, or percentage (derived values) Number of classes Classed or unclassed 2,3,4,5,6,7,8,9 or n classes 30
31 Factors Affecting Choropleth Maps (continued) Method of Classification Subjective/natural breaks Optimization, standard deviation, equal intervals, quantiles, etc.. Legend Design Actual values, rounded values, continuous range values 31
32 Factors Affecting Choropleth Maps (continued) Symbolization Value shadings: Graded sequence - percentage (100% black - 0% white) Graded sequence (no 100% or 0%) Graded sequence which reflects actual data values (class means) Color/hue: natural versus arbitrary Value shading of a hue or multiple hues Texture of value shadings: Resolution - fine to course Dots versus lines 32
33
34
35
36
37
38
What is a map? A simple representation of the real world Two types of maps
 Mapping with GIS What is a map? A simple representation of the real world Two types of maps Reference maps showing reference features such as roads, locations, political boundaries, cities etc. Thematic
CHAPTER 9 DATA DISPLAY AND CARTOGRAPHY
 CHAPTER 9 DATA DISPLAY AND CARTOGRAPHY 9.1 Cartographic Representation 9.1.1 Spatial Features and Map Symbols 9.1.2 Use of Color 9.1.3 Data Classification 9.1.4 Generalization Box 9.1 Representations 9.2
Chapter 7: Making Maps with GIS. 7.1 The Parts of a Map 7.2 Choosing a Map Type 7.3 Designing the Map
 Chapter 7: Making Maps with GIS 7.1 The Parts of a Map 7.2 Choosing a Map Type 7.3 Designing the Map What is a map? A graphic depiction of all or part of a geographic realm in which the real-world features
APC Part I Workshop. Mapping and Cartography. 14 November 2014
 APC Part I Workshop Mapping and Cartography 14 November 2014 Cartography Cartography is the discipline dealing with the conception, production, dissemination and study of maps in all forms (ICA) A holistic
Geog183: Cartographic Design and Geovisualization Winter Quarter 2017 Lecture 6: Map types and Data types
 Geog183: Cartographic Design and Geovisualization Winter Quarter 2017 Lecture 6: Map types and Data types Data types Data dimension: Point, Line, Area, Volume (Text) Data continuity: Discrete, Point, Polygon:
Intro to GIS Summer 2012 Data Visualization
 Intro to GIS Summer 2012 Data Visualization UNDERSTANDING YOUR MAP DATA Qualitative vs. Quantitative Data Qualitative Data classified by category e.g. Soil types, Animal Species Quantitative Data grouped
The Choropleth Map Slide #2: Choropleth mapping enumeration units
 The Choropleth Map Slide #2: Choropleth mapping is a common technique for representing enumeration data These are maps where enumeration units, such as states or countries, are shaded a particular color
ENV208/ENV508 Applied GIS. Week 2: Making maps, data visualisation, and GIS output
 ENV208/ENV508 Applied GIS Week 2: Making maps, data visualisation, and GIS output Overview GIS Output Map Making Types of Maps Key Elements GIS Output Formats Table Graph Statistics Maps Map Making Maps
Overview. GIS Data Output Methods
 Overview GIS Output Formats ENV208/ENV508 Applied GIS Week 2: Making maps, data visualisation, and GIS output GIS Output Map Making Types of Maps Key Elements Table Graph Statistics Maps Map Making Maps
An Information Model for Maps: Towards Cartographic Production from GIS Databases
 An Information Model for s: Towards Cartographic Production from GIS Databases Aileen Buckley, Ph.D. and Charlie Frye Senior Cartographic Researchers, ESRI Barbara Buttenfield, Ph.D. Professor, University
Basic principles of cartographic design. Makram Murad-al-shaikh M.S. Cartography Esri education delivery team
 Basic principles of cartographic design Makram Murad-al-shaikh M.S. Cartography Esri education delivery team Cartographic concepts Cartography defined The communication channel - Why maps fail Objectives
Making Maps With GIS. Making Maps With GIS
 Making Maps With GIS Getting Started with GIS Chapter 7 Making Maps With GIS 7.1 The Parts of a Map 7.2 Choosing a Map Type 7.3 Designing the Map 1 What is a map? Map is the communication tool for the
Geography 360 Principles of Cartography. April 17, 2006
 Geography 360 Principles of Cartography April 17, 2006 Outlines Cartographic design principles Enhancing visual hierarchies on maps Kinds of numerical data and color scheme What is proportional symbol
APC PART I WORKSHOP MAPPING AND CARTOGRAPHY
 APC PART I WORKSHOP MAPPING AND CARTOGRAPHY 5 June 2015 MAPPING The act or process of making a map. A matching process where the points of one set are matched against the points of another set. Graphical
Lecture 5. Symbolization and Classification MAP DESIGN: PART I. A picture is worth a thousand words
 Lecture 5 MAP DESIGN: PART I Symbolization and Classification A picture is worth a thousand words Outline Symbolization Types of Maps Classifying Features Visualization Considerations Symbolization Symbolization
Cartography and Geovisualization. Chapters 12 and 13 of your textbook
 Cartography and Geovisualization Chapters 12 and 13 of your textbook Why cartography? Maps are the principle means of displaying spatial data Exploration: visualization, leading to conceptualization of
GTECH 380/722 Analytical and Computer Cartography Hunter College, CUNY Department of Geography
 GTECH 380/722 Analytical and Computer Cartography Hunter College, CUNY Department of Geography Fall 2014 Mondays 5:35PM to 9:15PM Instructor: Doug Williamson, PhD Email: Douglas.Williamson@hunter.cuny.edu
GED 554 IT & GIS. Lecture 6 Exercise 5. May 10, 2013
 GED 554 IT & GIS Lecture 6 Exercise 5 May 10, 2013 Free GIS data sources ******************* Mapping numerical data & Symbolization ******************* Exercise: Making maps for presentation GIS DATA SOFTWARE
What should you consider concerning colors in maps in order to illustrate qualitative data, and quantitative data, respectively? Exemplify.
 1, Cartography, 10 p (HA) _ When doing a map based on quantitative data you have for example to decide upon the classification. Three common classifications are Equal interval, Quantiles (percentiles)
Topic 9: Proportional Symbol Mapping Chapter 9: Chang Chapter 8: Dent
 Geography 38/42:286 GIS 1 Topic 9: Proportional Symbol Mapping Chapter 9: Chang Chapter 8: Dent 1 What is a Proportional Symbol Map? Depicts spatial variations in value or magnitude Using proportionally
MAP SCALE, ELEMENTS & USE
 MAP SCALE, ELEMENTS & USE Maps & Geospatial Concepts Fall 2015 What cartographic elements affect a map? Scale Elements Layout Data Representation Data Accuracy & Misuse Scale Scale http://micro.magnet.fsu.edu/primer/java/scienceop
A Review: Geographic Information Systems & ArcGIS Basics
 A Review: Geographic Information Systems & ArcGIS Basics Geographic Information Systems Geographic Information Science Why is GIS important and what drives it? Applications of GIS ESRI s ArcGIS: A Review
WHO IS WHO ON THE MAP?
 WHO IS WHO ON THE MAP? Eng. Stanislav Vasilev, PhD Assoc. Professor in Department of Photogrammetry and Cartography 1, Christo Smirnenski blvd. 1046 Sofia, Bulgaria e-mail: vasilevs_fgs@uacg.bg Abstract
Theory, Concepts and Terminology
 GIS Workshop: Theory, Concepts and Terminology 1 Theory, Concepts and Terminology Suggestion: Have Maptitude with a map open on computer so that we can refer to it for specific menu and interface items.
Geographic Systems and Analysis
 Geographic Systems and Analysis New York University Robert F. Wagner Graduate School of Public Service Instructor Stephanie Rosoff Contact: stephanie.rosoff@nyu.edu Office hours: Mondays by appointment
Summary thematic point techniques
 Summary thematic point techniques Dot maps Graduated symbols Bar linear (1D) proportional symbol Circle 2D proportional symbol (and other shapes) Range graded symbols classed by size Segmented symbols
0 Maps are the principle means of displaying spatial data
 Why cartography? 0 Maps are the principle means of displaying spatial data 0 Exploration: visualization, leading to conceptualization of patterns and processes. (Chap 13) 0 Communication: convey information
Overview key concepts and terms (based on the textbook Chang 2006 and the practical manual)
") Introduction Geo-information Science (GRS-10306) Overview key concepts and terms (based on the textbook 2006 and the practical manual) Introduction Chapter 1 Geographic information system (GIS) Geographically
Introduction Geo-information Science (GRS-10306) Overview key concepts and terms (based on the textbook 2006 and the practical manual) Introduction Chapter 1 Geographic information system (GIS) Geographically
GIS Generalization Dr. Zakaria Yehia Ahmed GIS Consultant Ain Shams University Tel: Mobile:
 GIS Generalization Dr. Zakaria Yehia Ahmed GIS Consultant Ain Shams University Tel: 24534976 Mobile: 01223384254 zyehia2005@yahoo.com Abstract GIS Generalization makes data less-detailed and less-complex
Geo-Visualization. GRS1011 Ron van Lammeren
 Geo-Visualization GRS1011 Ron van Lammeren Theory Semiologie Graphique http://www.flickr.com/photos/kbean/491051226/ 2/30 How to present my geo data? Visualization definitions Map making Cartographic process
Geo-Visualization. GRS09/10 Ron van Lammeren
 Geo-Visualization GRS09/10 Ron van Lammeren 2/30 Theory Semiologie Graphique http://www.flickr.com/photos/kbean/491051226/ 3/30 How to present my geo data? Visualization definitions Map making Cartographic
Geography 281 Map Making with GIS Project Four: Comparing Classification Methods
 Geography 281 Map Making with GIS Project Four: Comparing Classification Methods Thematic maps commonly deal with either of two kinds of data: Qualitative Data showing differences in kind or type (e.g.,
Standard Highway Sign Border Specifications
 Standard Highway Sign Border Specifications A Radius Radius B C SIGN SIZE SIGN SIZE Variable Radius B C SIGN SIZE BORDER WIDTHS A B C CORNER RADIUS 18 4 30 36 48 60.375.375.375 1.375.375.438 1.5.5.375.65
Classification Exercise UCSB July 2006
 Classification Exercise UCSB July 2006 Purpose This exercise will examine how spatial data is catergorized and the advantages and disadvantages of different classification methods. Terms to know Population,
Spatial Representation
 Spatial Representation Visual Culture LCC6311 Tony F. Lockhart 12/9/2009 Page 2 of 5 Table of Contents Introduction... 3 Grid Layout... 3 Public School Funding Visualization... 3 Inspiration... 4 Works
MAPS AND THEIR CLASSIFICATION
 MAPPING MAPS AND THEIR CLASSIFICATION WHAT IS A MAP? A map is representation of the Earth's surface, showing how things are related to each other by distance, direction, and size. Maps are a way of showing
Physical Geography Lab Activity #15
 Physical Geography Lab Activity #15 Due date Name Choropleth Maps COR Objective 1 & 7, SLOs 1 & 3 15.1. Introduction Up until this point we have used maps to find locations on the Earth. While they are
Sampling The World. presented by: Tim Haithcoat University of Missouri Columbia
 Sampling The World presented by: Tim Haithcoat University of Missouri Columbia Compiled with materials from: Charles Parson, Bemidji State University and Timothy Nyerges, University of Washington Introduction
LESSON 2: INTRODUCTION TO TOPOGRAPHICAL MAPS
 LESSON 2: INTRODUCTION TO TOPOGRAPHICAL MAPS Finding your way if you become separated from a group. PURPOSE This lesson presents an overview of topographic maps. It describes their characteristics and
Snowden Cartography 1 GEOG 315:001 Cartography Thursdays 4:00 6:30PM F375 Fall 2010 Dr. Snowden Course Description
 Snowden Cartography 1 www.drksnowden.com GEOG 315:001 Cartography Thursdays 4:00 6:30PM F375 Fall 2010 Dr. Snowden Course Description Principles and theory of basic map design, layout, and communication.
GTECH 380/722 Analytical and Computer Cartography Hunter College, CUNY Department of Geography
 GTECH 380/722 Analytical and Computer Cartography Hunter College, CUNY Department of Geography Fall 2011 Mondays 5:35PM to 9:15PM Instructor: Doug Williamson, PhD Email: Douglas.Williamson@hunter.cuny.edu
Appropriate Selection of Cartographic Symbols in a GIS Environment
 Appropriate Selection of Cartographic Symbols in a GIS Environment Steve Ramroop Department of Information Science, University of Otago, Dunedin, New Zealand. Tel: +64 3 479 5608 Fax: +64 3 479 8311, sramroop@infoscience.otago.ac.nz
GEOREFERENCING, PROJECTIONS Part I. PRESENTING DATA Part II
 Week 7 GEOREFERENCING, PROJECTIONS Part I PRESENTING DATA Part II topics of the week Georeferencing Coordinate systems Map Projections ArcMap and Projections Geo-referencing Geo-referencing is the process
MAPPING GUIDE CARTOGRAPHY IN ESPON 2013 CONTENT 24 PAGES
 MAPPING GUIDE CARTOGRAPHY IN ESPON 2013 CONTENT Enhancing information. This part explain how symbolize ESPON 2013 data with the good rules of graphic semiology. Maps are tool for communication. This part
Lecture 2. A Review: Geographic Information Systems & ArcGIS Basics
 Lecture 2 A Review: Geographic Information Systems & ArcGIS Basics GIS Overview Types of Maps Symbolization & Classification Map Elements GIS Data Models Coordinate Systems and Projections Scale Geodatabases
How to use this book. The purpose and structure of the book.
 How to use this book The purpose and structure of the book. This book is structured to mirror the mapmaking process itself it s non-linear! Rarely would you make a map in an order that goes from projections,
Introduction to Cartography Part I
 Introduction to Cartography Part I Introduction to Cartography Maps vs. Globes General Types of Maps Standard Map Features Maps versus Globes Map: a representation of the world, or part of it, in two dimensions
Geographers Perspectives on the World
 What is Geography? Geography is not just about city and country names Geography is not just about population and growth Geography is not just about rivers and mountains Geography is a broad field that
EXTRA CREDIT Extra Credit Atlas Exercise for Exam I is available on the course home page
 EXTRA CREDIT Extra Credit Atlas Exercise for Exam I is available on the course home page. Submit answers to me using the blue Scantron sheet by Feb. 19, 2019. Once you have completed the exercise, transfer
Maps Page Level of Difficulty:
 Chapter 11 Maps Page Level of Difficulty: 11.1 Introduction As scaled depictions of the world, maps are by necessity abstractions of reality. The abstraction takes many forms. Some features are left out
WORKING OUT OF METODS OF REALIZATION OF ELEMENTS OF THE MATHEMATICAL BASIS OF MAPS
 CO-278 WORKING OUT OF METODS OF REALIZATION OF ELEMENTS OF THE MATHEMATICAL BASIS OF MAPS IVANOV A.G., ZAGREBIN G.I. Moscow State University of Geodesy and Cartography, MOSCOW, RUSSIAN FEDERATION INTRODUCTION
Desktop GIS for Geotechnical Engineering
 Desktop GIS for Geotechnical Engineering Satya Priya Deputy General Manager (Software) RMSI, A-7, Sector 16 NOIDA 201 301, UP, INDIA Tel: +91-120-2511102 Fax: +91-120-2510963 Email: Satya.Priya@rmsi.com
Revive, Contemplate, and Integrate Lesson Plan. Your Name: Amanda Pellerin, Amanda Kodeck, and Pat Cruz Grade: 7
 Revive, Contemplate, and Integrate Lesson Plan Your Name: Amanda Pellerin, Amanda Kodeck, and Pat Cruz Grade: 7 Unit of Study: Social Studies/ Visual Arts Lesson Title: Modern Day Maps Goal/Purpose: Students
Lecture 5. Representing Spatial Phenomena. GIS Coordinates Multiple Map Layers. Maps and GIS. Why Use Maps? Putting Maps in GIS
 Lecture 5 Putting Maps in GIS GIS responds to three fundamental questions by automating spatial data: What is where? Why is it there? GIS reveals linkages unevenly distributed social, economic and environmental
LABORATORY V CONSERVATION OF MOMENTUM
 LABORATORY V CONSERVATION OF MOMENTUM In this lab you will use conservation of momentum to predict the motion of objects resulting from interactions that are difficult to analyze with force concepts or
Periodic Table Project Element Card Sketches
 Kensington Woods High School Name: Chemistry/Art Periodic Table Project Element Card Sketches In this project, we will use graphic design skills to redesign the periodic table. You are challenged with
Chapter 1 Overview of Maps
 Chapter 1 Overview of Maps In this chapter you will learn about: Key points when working with maps General types of maps Incident specific maps Map legend and symbols Map sources A map is a navigational
Maps and Data Types in GIS
 Lecture 3 Maps and Data Types in GIS Tomislav Sapic GIS Technologist Faculty of Natural Resources Management Lakehead University Data Types In GIS, data types and data models are forms of attribute representation
Diamonds on the soles of scholarship?
 Educational Performance and Family Income Diamonds on the soles of scholarship? by Introduction Problem Two young girls entering elementary school in Boston aspire to be doctors. Both come from twoparent,
Version 1.1 GIS Syllabus
 GEOGRAPHIC INFORMATION SYSTEMS CERTIFICATION Version 1.1 GIS Syllabus Endorsed 1 Version 1 January 2007 GIS Certification Programme 1. Target The GIS certification is aimed at: Those who wish to demonstrate
Geovisualization of Attribute Uncertainty
 Geovisualization of Attribute Uncertainty Hyeongmo Koo 1, Yongwan Chun 2, Daniel A. Griffith 3 University of Texas at Dallas, 800 W. Campbell Road, Richardson, Texas 75080, 1 Email: hxk134230@utdallas.edu
Slide #1: Slide #2: Slide #3: Slide #4: Slide #5: Cartographic Basics Slide #6: Cartographic Basics Slide #13: Scale & Generalization
 Slide #1: Introduction to Cartography Slide #2: Overview Slide #3: What is a map? (Clarke, 2001) Slide #4: What is a map? (ICA, 1995) o In short, a map is a tool used for sharing and presenting spatial
Map Makeovers: How to Make Your Map Great!
 Esri International User Conference San Diego, CA Technical Workshops Map Makeovers: How to Make Your Map Great! Charlie Frye, Esri, Redlands, Jim Herries, Esri, Redlands Session Goals Demonstrate cartographic
EXTRA CREDIT. 6 Geographers Tools. Maps and their Parts MAP MAKING QUANDRY MAP MAKING
 EXTRA CREDIT Extra Credit Atlas Exercise for Exam I is available on the course home page. Submit answers to me using the blue Scantron sheet by Feb. 19, 2019. Once you have completed the exercise, transfer
EXTRA CREDIT. 6 Geographers Tools. Maps and their Parts MAP MAKING QUANDRY MAP MAKING 2/15/19 MAP PROJECTIONS MAP PROJECTIONS
 EXTRA CREDIT Extra Credit Atlas Exercise for Exam I is available on the course home page. Submit answers to me using the blue Scantron sheet by Feb. 19, 2019. Once you have completed the exercise, transfer
Statistics for Thematic Cartography
 Geographic Information Technology Training Alliance (GITTA) presents: Statistics for Thematic Cartography Boris STERN Yvonne YSAKOWSKI Lorenz Hurni http://www.gitta.info - Modified: 10.5.2006 1 Content
FROM DATA TO CARTOGRAPHIC PRESENTATION METHODS
 FROM DATA TO CARTOGRAPHIC PRESENTATION METHODS Jolanta Korycka-Skorupa Adress: Chair of Cartography, Warsaw University ul. Krakowskie Przedmiescie 30 00-927 Warsaw, POLAND tel: (4822) 55-20-632 fax: (4822)
AP Human Geography Chapter 1: Thinking Geographically Key Issue 1: How do Geographers describe where things are?
 AP Human Geography Chapter 1: Thinking Geographically Key Issue 1: How do Geographers describe where things are? Studying Human Geography Physical Geography Physical geography deals with Earth s natural
Agenda. Introduction Exercise 1 Map Types. Part 1 ArcGIS Information and Organization Part 2 Purpose, Audience & Constraints.
 Agenda Introduction Exercise 1 Map Types Part 1 ArcGIS Information and Organization Part 2 Purpose, Audience & Constraints Exercise 2 Map Critique Break Part 3 Basic Cartographic Design Principles Part
Graphic Attachment 2 Photo-simulations PROPOSED DAIRY PLANT EXPANSION - STUDHOLME
 Graphic Attachment 2 Photo-simulations PROPOSED DAIRY PLANT EXPANSION - STUDHOLME 1 Methodology for Preparation of Photo Simulations 1 The main objective of a photo simulation is to provide an image that,
A cartographic approach of the process of map symbolization on gvsig software
 A cartographic approach of the process of map symbolization on gvsig software Vassilios Krassanakis Dipl. Eng., PhD Cand. NTUA krasvas@mail.ntua.gr http://users.ntua.gr/krasvas Vasilis Mitropoulos Dipl.
Children s Understanding of Generalisation Transformations
 Children s Understanding of Generalisation Transformations V. Filippakopoulou, B. Nakos, E. Michaelidou Cartography Laboratory, Faculty of Rural and Surveying Engineering National Technical University
Visual Language Basics & Spatial Order George Legrady
 AT 259 Visualizing Information Visual Language Basics & Spatial Order George Legrady AT 259 Visualizing Information Language & Syntax JGXT YQAL ANAGRA DOG HOUND CANINE WHAT S UP DOC? Graduate ARE Program!
56H. This system allows definition of points on the Earth s surface to within 100 meters. Page 20. Navigation Systems Basics of Maps
 Grid References Many maps are provided with the standard grid overlaying them. This provides a simple and accurate method for finding features on the map. It is a network of intersecting parallel lines
Maps: Two-dimensional, scaled representations of Earth surface - show spatial data (data with locational component)
") Maps: Two-dimensional, scaled representations of Earth surface - show spatial data (data with locational component) Cartography (map-making) involves 5 design decisions based on purpose of map Projection
Maps: Two-dimensional, scaled representations of Earth surface - show spatial data (data with locational component) Cartography (map-making) involves 5 design decisions based on purpose of map Projection
Map image from the Atlas of Oregon (2nd. Ed.), Copyright 2001 University of Oregon Press
, Copyright 2001 University of Oregon Press") Map Layout and Cartographic Design with ArcGIS Desktop Matthew Baker ESRI Educational Services Redlands, CA Education UC 2008 1 Seminar overview General map design principles Working with map elements
Map Layout and Cartographic Design with ArcGIS Desktop Matthew Baker ESRI Educational Services Redlands, CA Education UC 2008 1 Seminar overview General map design principles Working with map elements
The Design and Mapmaking of Shenzhen and Hong Kong Atlas
 ABSTRACT The Design and Mapmaking of Shenzhen and Hong Kong Atlas Zongyi He 1, Jing Miao 2, Yajing Yin 2 1 School of Resource and Environmental Science, Wuhan University 129 Luoyu Road, Wuhan 430039 P.R.CHINA
Map Reading: Grades 4 & 5
 Map Reading: Grades 4 & 5 Grades: 4,5 Team Size: 1-2 competitors Duration: 25 minutes Supervisors: Sriram Garapati, Rebecca Neill-Totsuka Summary Description Students will solve a mystery using different
Pool Canvas. Add. Creation Settings. Chapter 1--Objectives and Tools of World Regional Geography. Description Instructions.
 1 of 6 TEST BANK > CONTROL PANEL > POOL MANAGER > POOL CANVAS Pool Canvas Add, modify, and remove questions. Select a question type from the Add Question drop-down list and click Go to add questions. Use
Lecture 10 Mapping Quantities: Dot Density Maps
 Lecture 10 Mapping Quantities: Dot Density Maps Introduction Creating maps of features based on quantity are some of the most common and important types of maps. In order to create maps that show quantity
Cartography = Science of Mapmaking
 Mapping Cartography = Cartography = Science of Mapmaking Eratosthenes (Era TOS the neez) Ancient Greek Librarian at Alexandria in Egypt (3rd c. BCE). First accurate measurement of circumference of the
How do I do that in Quantum GIS: illustrating classic GIS tasks Edited by: Arthur J. Lembo, Jr.; Salisbury University
 How do I do that in Quantum GIS: illustrating classic GIS tasks Edited by: Arthur J. Lembo, Jr.; Salisbury University How do I do that in Quantum GIS Page 1 Introduction from the editor:... 4 Database
from
 8Map Generalization and Classification Our human and natural environments are complex and full of detail. Maps work by strategically reducing detail and grouping phenomena together. Driven by your intent,
USING THE MILITARY LENSATIC COMPASS
 USING THE MILITARY LENSATIC COMPASS WARNING This presentation is intended as a quick summary, and not a comprehensive resource. If you want to learn Land Navigation in detail, either buy a book; or get
Chapter 02 Maps. Multiple Choice Questions
 Chapter 02 Maps Multiple Choice Questions 1. Every projection has some degree of distortion because A. a curved surface cannot be represented on a flat surface without distortion. B. parallels and meridians
Chapter 9 Ingredients of Multivariable Change: Models, Graphs, Rates
 Chapter 9 Ingredients of Multivariable Change: Models, Graphs, Rates 9.1 Multivariable Functions and Contour Graphs Although Excel can easily draw 3-dimensional surfaces, they are often difficult to mathematically
Chapter 5. Presenting Data
 Chapter 5. Presenting Data Copyright McGraw-Hill Education. Permission required for reproduction or display. 5-1 Basic principles of map design 5-2 1 Map Design Process 5-3 The map objective The first
Mapping Social Vulnerability and Lyme Disease in Vermont
 Mapping Social Vulnerability and Lyme Disease in Vermont March 30, 2017, Dr. Joseph Holler Contact email: joseph@josephholler.com Website: www.josephholler.com This work is licensed under a Creative Commons
Quiz 1. Quiz Instruc ons. Question 1. Question 2. 2 pts. 3 pts. This is a preview of the published version of the quiz. Started: Jul 3 at 4:29pm
 Quiz 1 This is a preview of the published version of the quiz Started: Jul 3 at 4:29pm Quiz Instruc ons Quiz 1 Question 1 Which of the following is not a basic element of map design that should be considered
PHYS XXXX-L. Title (of Lab) Name (your name) Date of the lab (date performed) Dr. Thomas Eaves
 Name (your name) Date of the lab (date performed) Dr. Thomas Eaves") PHYS XXXX-L Title (of Lab) Name (your name) Date of the lab (date performed) Dr. Thomas Eaves The laboratory report is designed to answer the following questions: a. What did you try to find out? b. How
PHYS XXXX-L Title (of Lab) Name (your name) Date of the lab (date performed) Dr. Thomas Eaves The laboratory report is designed to answer the following questions: a. What did you try to find out? b. How
Visualizing Census Data in GIS. Andrew Rowan, Ph.D. Director, NJ Office of GIS
 Visualizing Census Data in GIS Andrew Rowan, Ph.D. Director, NJ Office of GIS Outline VERY accelerated cartography primer Software choices Demos/how-to ArcGIS Desktop (formerly ArcView) ArcGIS Online Notes
Geographic Data Science - Lecture IV
 Geographic Data Science - Lecture IV Mapping Data Dani Arribas-Bel Today Mapping data MAUP Choropleths Definition Classes Cartograms Conditional maps Space-Time mapping Data maps Abstraction from the purely
Eurostat regional yearbook using statistical maps and graphs to tell a story. Teodóra Brandmüller and Åsa Önnerfors, Eurostat
 Eurostat regional yearbook 2015 - using statistical maps and graphs to tell a story Teodóra Brandmüller and Åsa Önnerfors, Eurostat Gross domestic product (GDP) at current market prices per inhabitant
EnOcean Alliance Brand Guidelines
 EnOcean Alliance Brand Guidelines V 2.0, Jan 2017 2017 EnOcean Alliance www.enocean-alliance.org 1/21 EnOcean Alliance The EnOcean Alliance is a is a consortium of companies working to further develop
Different Displays of Thematic Maps:
 Different Displays of Thematic Maps: There are a number of different ways to display or classify thematic maps, including: Natural Breaks Equal Interval Quantile Standard Deviation What s important to
USING THE MILITARY LENSATIC COMPASS
 USING THE MILITARY LENSATIC COMPASS WARNING This presentation is intended as a quick summary, and not a comprehensive resource. If you want to learn Land Navigation in detail, either buy a book; or get
ArcGIS ArcMap: Making Professional Quality Thematic Maps Charlie Frye, ESRI Redlands Aileen Buckley, ESRI Redlands
 ArcGIS ArcMap: Making Professional Quality Thematic Maps Charlie Frye, ESRI Redlands Aileen Buckley, ESRI Redlands 1 ArcGIS ArcMap: Making Professional Quality Thematic Maps Charlie Frye, ESRI Redlands
Hydric Rating by Map Unit Harrison County, Mississippi
 89 6' 12'' W 89 5' 54'' W 30 28' 47'' N 30 28' 26'' N 3373210 3373290 3373370 3373450 3373530 3373610 3373690 3373770 3373850 298080 298160 298240 298320 298400 298480 298560 30 28' 47'' N Soil Map may
Designing GIS Databases to Support Mapping and Map Production Charlie Frye, ESRI Redlands Aileen Buckley, ESRI Redlands
 Designing GIS Databases to Support Mapping and Map Production Charlie Frye, ESRI Redlands Aileen Buckley, ESRI Redlands 1 Designing GIS Databases to Support Mapping and Map Production Charlie Frye, ESRI
Name Lab Instructor Miles
 EXERCISE EUROPEAN WORLD REGION Name Lab Instructor Time of Class Lab Due Date N W E S 0 300 600 Miles Figure 2.1 Europe Directions Part I and Part II are homework. Do Not Turn Part I and Part II me. I