Making Maps With GIS. Making Maps With GIS
|
|
|
- Claud Barker
- 5 years ago
- Views:
Transcription
1 Making Maps With GIS Getting Started with GIS Chapter 7 Making Maps With GIS 7.1 The Parts of a Map 7.2 Choosing a Map Type 7.3 Designing the Map 1
2 What is a map? Map is the communication tool for the organisation, presentation, communication and utilisation of geo-information in graphic, digital or tactile form (ICA-1991). a representation or abstaction of geographic reality. What is a map? A graphic depiction of all or part of a geographic realm in which the real-world features have been replaced by symbols in their correct spatial location at a reduced scale. power line 2
3 Maps as sources of data the final stage for GIS a map has to follow its own visual grammar Map function in GIS Storage Temporary communication Intermediate check of data Final report To be effective, must be correctly designed and constructed. 3
4 The Parts of a Map: Map Elements Neat line Border Title Figure The United States of America Legend Ground Alaska Hawaii Washington,D.C. National Capital hundreds of kilometers Scale Lambert Conformal Conic Projection Source: U.S. Dept. of State Inset Place name North Arrow Credits Cartographic Elements Medium Paper,window,computer screen Figure is the body of the map data itself and is the part of the map referenced in ground coordinates. Ground Reference information on the map information defining locations 4
5 Cartographic Elements (2) Border is the part of the display medium Neatline is the visual frame for the map Insets is either an enlarged or a reduced map designed to place the map into geographic context or to enlarge an area of interest whose level of detail is too specific for the main map scale (the inset should be clearly distinguishable from the figure and ground). Metadata e.g. index Cartographic Elements (3) Page coordinates defining locations on the map itself Graticule/Grid North arrow the reference link between the two coordinate systems on the final map 5
6 Cartographic Elements (4) Point/Line/Area symbols with visual variables Text information is an integral part of a map, and no map is complete without it Place Names and Labelling Text placement Santa Barbara Santa Barbara L a g o o n Santa Barbara Santa Barbara Path right P a t h D o w n 6
7 Text: Selection and Placement New York BM 232 US Route CA NV e L a k M u d POINT LINE AREA Figure 7.2 Some cartographic label placement conventions. Points: right and above preferred with no overlap. Lines: Following the direction of the line, curved if a river. Text should read up on the left of the map and down on the right. Areas: On a gently curved line following the shape of the figure and upright. Cartographic Elements (5) Title located in visually prominent position with largest/boldest text. Title Scale is a visual expression of the relationship between the ground coordinate space and that of the map page space (a graphic scale is preferred) Projection(s) ) and datum Sources obtained the data used to compile map:atlas,private or governmental agency, web site,etc. Sources 7
8 Cartographic Elements (6) Credits Legend translates the symbols into words by locating text and the symbols close to each other in the map coordinate space Reliability Map types General purpose maps: many maps show some or all of the types of features at the same time. Thematic maps show just one or two themes or layers of information, often coded, coloured, or grouped for convenience. 8

9 Map types Reference map or a basic outline shows the simplest properties of the map data (world outline map, with named continents and oceans). A general reference map, usually showing a suite of features including terrain, streams, boundaries, roads, and towns, is called a topographic map, is often used as reference information behind GIS map layers. Map types A dot map uses dots to show the location of features and may show a distribution such as population against a base map. A picture symbol map uses a symbol, to locate point features such as ski resorts. The graduated symbol map is the same, except that the symbol size is varied with the value of the feature. Typically, geometric symbols such as circles, squares, triangles, or shaded "spheres" are used. 9


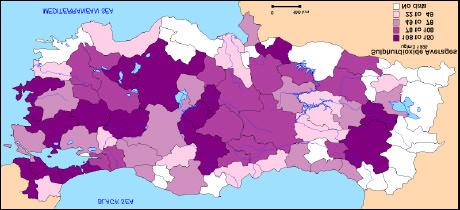
10 BLACK SEA T - E. Atlas Project MEDITERRANEAN SEA km 1 dot = 20 Physicians Map types The network map shows connected lines with similar attributes. A subway map, an airline route map, and a map of streams and rivers are examples. The flow map is the same, but it uses the width of the line to show value, for example, to show the air traffic volume or the amount of water flow in a stream system. 10
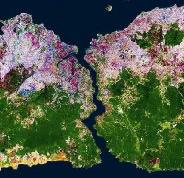
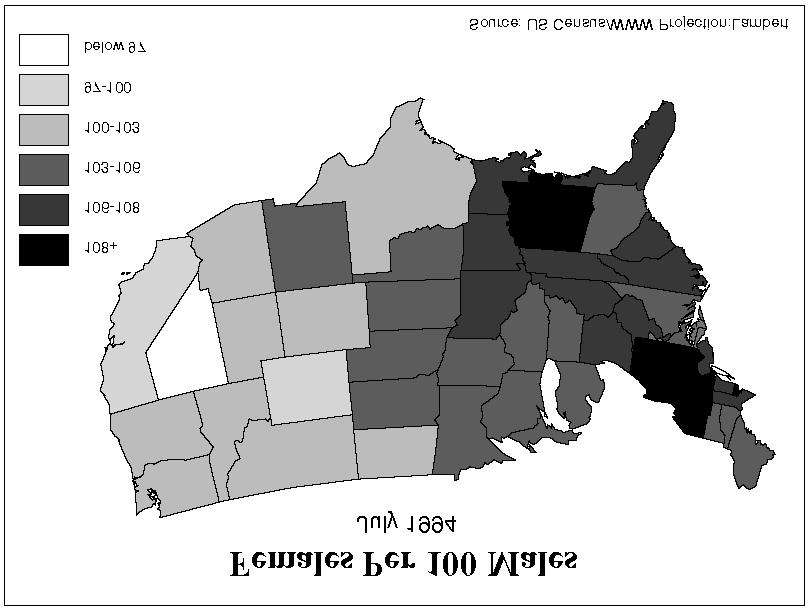
11 Map types A choropleth map is the familiar shaded map where data are classed and areas such as states or countries are shaded or coloured more or less densely according to their value. A variation on this, the unclassed choropleth, uses a continuous variation in tone or colour rather than the steps that result from classes. An area qualitative map simply gives a colour or pattern to an area, for example the colours of rocks on a geological map, or the land-use classes derived from image classification in remote sensing. BLACK SEA MEDITERRANEAN SEA km City & Village Population Population Density to to to to to 40 Cities Villages T - Cartography Division Electronic Atlas Project
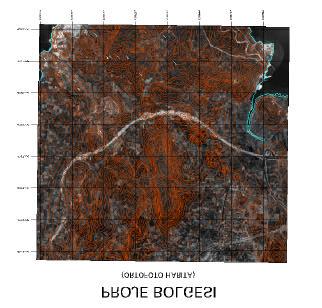
12 Map types Volumetric data can be shown in several ways. Discontinuous data are often shown as a stepped statistical surface, a block-type diagram viewed in perspective. The standard isoline map is a map with lines joining points of equal value. Surface continuity is assumed, meaning that sharp breaks are usually smoothed. The terrain equivalent is the contour map, with its characteristic datum and contour interval. A variant is the hypsometric map in which the space between contour lines is filled with colour using a sequence designed to illustrate variation. Image maps and schoolroom topographic maps use this type. Map types Three-dimensional views of surfaces rendered in perspective can be either a gridded fishnet, where a grid is distorted to give the impression of three dimensions, or a realistic perspective, when an image or shaded map is draped over the surface rather than a grid. simulated hill shading where illumination of shadowing is simulated by the computer and a gray scale or a colored map is used to show the surface. 12

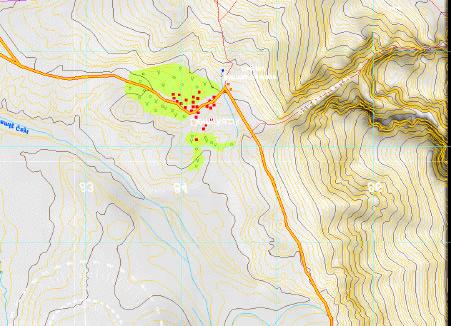
13 Undergraduate Final Project by Evren Hakg ren Undergraduate Final Project by Evren Hakg ren 13


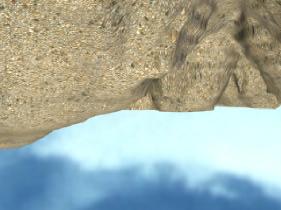
14 Undergraduate Final Project by. Fatih G k en and Evren Hakg ren Undergraduate Final Project by. Fatih G k en and Evren Hakg ren 14
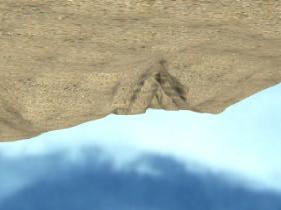
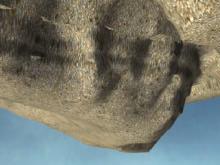
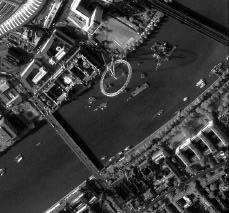
15 Undergraduate Final Project by. Fatih G k en and Evren Hakg ren Map types image map or ortophoto map (!) (!) Ikonos 15

16 ITU Cartography & Remote Sensing Division 16
17 Map Types: Point Data Reference Topographic Dot Picture Symbol Graduated Symbol Map Types: Line Data Network Flow Isopleth Reference 17
18 Map Types: Area Data Choropleth Area qualitative Stepped surface Hypsometric Dasymetric Reference Map Types: Volume Data Isopleth,, Stepped Surface, Hypsometric Gridded fishnet Realistic perspective Hill-shaded Image map 18
19 Map Types: Time Multiple views Animation Moving map Fly through Fly by Design Errors selection of map type symbolisation 19
20 Choosing the Wrong Type Fairly common GIS error. Due to lack of knowledge about cartographic options. Can still have perfect symbolization. Possibility of misinformation Definite reduction in communication effectiveness. Choosing a Map Type Cartographers have designed hundreds of map types: methods of cartographic representation. Not all GISs allow all types. Most have a set of basic types. Depends heavily on the dimension of the data to be shown in the map figure. 20
21 Factors of Choosing Map Types Check the data Continuous Discrete Accuracy & Precision Reliability Dimension (Point, Line, Area, Volume) Scale of Measurment (Nominal etc.) GIS capability May need to supplement GIS software Data Scaling or Measurement of Data Nominal (Name of a place) Ordinal (Small, med., large town) Interval (Arbitrary zero e.g. Sea Level) Ratio (Absolute zero e.g. dollars, densities) 21
22 Classification Equal Interval Natural groups Arithmetic or geometric increase Equal or unequal? Logarithmic? Linear? Discontinuous? How many classes? Non-overlapping, distinctive groups. Example: Choropleth Mapping Data should be AREA (e.g. States) Data should not suffer from area effect. Population? Per capita Income? Elevation? Temperature? Boundaries unambiguous. Areas non-overlapping. 22
23 Electronic Atlas Project T
24 The Need for Design To appear professional and avoid errors, GIS maps should reflect cartographic knowledge about map design. A map has a visual grammar or structure that must be understood and used if the best map design is desired. Cartographic convention (e.g. forests should be green). Map Design A GIS map is designed in a process called the design loop. Create map layout as macro Draw on screen (proof plot) Look Edit macro Repeat until happy Make final plot Good map design requires that map elements be placed in a balanced arrangement within the neat line. 24
25 Map Design (2) Visual balance is affected by: the "weight" of the symbols the visual hierarchy of the symbols and elements the location of the elements with respect to each other and the visual center of the map. It placed 5% of the map above geometric center. Visual center 5% of height 5% of height Landscape Portrait 25
26 Title Here Visual Layout Title Here Eye expects (1) balance and (2) allignment Symbol weight Line weight Pattern Shading Hue 26
27 Color and Map Design Color is a complex visual variable and in a GIS is specified by RGB or HSI values. Red, Green, Blue are additive primaries. Magenta, Cyan and Yellow are subtractive primaries. Saturation and Intensity map better onto values than hue. Dimensions of Color HUE INTENSITY SATURATION 27
28 Simultaneous Contrast When several hues appear in juxtaposition on a map, the colours are perceptually altered by the eye, a phenomenon known as simultaneous contrast. Color Primaries Additive color Subtractive color 28
29 Graphic Editor Software Vector Adobe Illustrator CorelDraw Freehand Raster Photoshop CorelPaint Fractal Paint Scale and Generalization Smaller scale means fewer features. Smaller scale means smoother features. Smaller scale means combining features. Smaller scale means displacing features. Often scales are mixed or overgeneralized. 29
30 Map Design and GIS When a GIS map is the result of a complex analytical or modeling process, good design is essential for understanding. The map is what distinguishes GIS as a different approach to the management of information, so extra care should be taken to improve the final maps that a GIS generates in a GIS task. as conclusion The last stage in the mapping process is the conversion of the GIS data into a map design. almost infinite number of choices or symbols, fonts, colours, line thicknesses, and so on. Selecting the "best" design can make an enormous difference in the effectiveness of the map. If a map has taken a large amount of work to generate, it is well worth the GIS user s effort to make doubly sure that the design is good. 30
31 good designed map as like... Coming next How to Pick a GIS. 31
Chapter 7: Making Maps with GIS. 7.1 The Parts of a Map 7.2 Choosing a Map Type 7.3 Designing the Map
 Chapter 7: Making Maps with GIS 7.1 The Parts of a Map 7.2 Choosing a Map Type 7.3 Designing the Map What is a map? A graphic depiction of all or part of a geographic realm in which the real-world features
CHAPTER 9 DATA DISPLAY AND CARTOGRAPHY
 CHAPTER 9 DATA DISPLAY AND CARTOGRAPHY 9.1 Cartographic Representation 9.1.1 Spatial Features and Map Symbols 9.1.2 Use of Color 9.1.3 Data Classification 9.1.4 Generalization Box 9.1 Representations 9.2
Lecture 5. Symbolization and Classification MAP DESIGN: PART I. A picture is worth a thousand words
 Lecture 5 MAP DESIGN: PART I Symbolization and Classification A picture is worth a thousand words Outline Symbolization Types of Maps Classifying Features Visualization Considerations Symbolization Symbolization
What is a map? A simple representation of the real world Two types of maps
 Mapping with GIS What is a map? A simple representation of the real world Two types of maps Reference maps showing reference features such as roads, locations, political boundaries, cities etc. Thematic
GEOREFERENCING, PROJECTIONS Part I. PRESENTING DATA Part II
 Week 7 GEOREFERENCING, PROJECTIONS Part I PRESENTING DATA Part II topics of the week Georeferencing Coordinate systems Map Projections ArcMap and Projections Geo-referencing Geo-referencing is the process
Version 1.1 GIS Syllabus
 GEOGRAPHIC INFORMATION SYSTEMS CERTIFICATION Version 1.1 GIS Syllabus Endorsed 1 Version 1 January 2007 GIS Certification Programme 1. Target The GIS certification is aimed at: Those who wish to demonstrate
Geographers Perspectives on the World
 What is Geography? Geography is not just about city and country names Geography is not just about population and growth Geography is not just about rivers and mountains Geography is a broad field that
Designing the Map 14.1 SYMBOLIZATION IN CONTEXT
 14 Designing the Map 14.1 SYMBOLIZATION IN CONTEXT A map can be defined as a graphic depiction of all or part of a geographic realm in which the real-world features have been replaced with symbols in their
APC PART I WORKSHOP MAPPING AND CARTOGRAPHY
 APC PART I WORKSHOP MAPPING AND CARTOGRAPHY 5 June 2015 MAPPING The act or process of making a map. A matching process where the points of one set are matched against the points of another set. Graphical
APC Part I Workshop. Mapping and Cartography. 14 November 2014
 APC Part I Workshop Mapping and Cartography 14 November 2014 Cartography Cartography is the discipline dealing with the conception, production, dissemination and study of maps in all forms (ICA) A holistic
An Information Model for Maps: Towards Cartographic Production from GIS Databases
 An Information Model for s: Towards Cartographic Production from GIS Databases Aileen Buckley, Ph.D. and Charlie Frye Senior Cartographic Researchers, ESRI Barbara Buttenfield, Ph.D. Professor, University
Map image from the Atlas of Oregon (2nd. Ed.), Copyright 2001 University of Oregon Press
, Copyright 2001 University of Oregon Press") Map Layout and Cartographic Design with ArcGIS Desktop Matthew Baker ESRI Educational Services Redlands, CA Education UC 2008 1 Seminar overview General map design principles Working with map elements
Map Layout and Cartographic Design with ArcGIS Desktop Matthew Baker ESRI Educational Services Redlands, CA Education UC 2008 1 Seminar overview General map design principles Working with map elements
Designing Better Maps
 Designing Better Maps presented by: Tim Haithcoat University of Missouri Columbia with materials of: Dennis Fizsimons, SW Texas State University George McCleary, Jr., University of Kansas Design is a Choice
Geography 360 Principles of Cartography. April 17, 2006
 Geography 360 Principles of Cartography April 17, 2006 Outlines Cartographic design principles Enhancing visual hierarchies on maps Kinds of numerical data and color scheme What is proportional symbol
Introduction to Cartography Part I
 Introduction to Cartography Part I Introduction to Cartography Maps vs. Globes General Types of Maps Standard Map Features Maps versus Globes Map: a representation of the world, or part of it, in two dimensions
Chapter 02 Maps. Multiple Choice Questions
 Chapter 02 Maps Multiple Choice Questions 1. Every projection has some degree of distortion because A. a curved surface cannot be represented on a flat surface without distortion. B. parallels and meridians
Intro to GIS Summer 2012 Data Visualization
 Intro to GIS Summer 2012 Data Visualization UNDERSTANDING YOUR MAP DATA Qualitative vs. Quantitative Data Qualitative Data classified by category e.g. Soil types, Animal Species Quantitative Data grouped
Geo-Visualization. GRS09/10 Ron van Lammeren
 Geo-Visualization GRS09/10 Ron van Lammeren 2/30 Theory Semiologie Graphique http://www.flickr.com/photos/kbean/491051226/ 3/30 How to present my geo data? Visualization definitions Map making Cartographic
Chapter 3 Models of the Earth. 3.1 Finding Locations on the Earth. 3.1 Objectives
 Chapter 3 Models of the Earth 3.1 Finding Locations on the Earth 3.1 Objectives Explain latitude and longitude. How can latitude and longitude be used to find locations on Earth? How can a magnetic compass
Geo-Visualization. GRS1011 Ron van Lammeren
 Geo-Visualization GRS1011 Ron van Lammeren Theory Semiologie Graphique http://www.flickr.com/photos/kbean/491051226/ 2/30 How to present my geo data? Visualization definitions Map making Cartographic process
Popular Mechanics, 1954
 Introduction to GIS Popular Mechanics, 1954 1986 $2,599 1 MB of RAM 2017, $750, 128 GB memory, 2 GB of RAM Computing power has increased exponentially over the past 30 years, Allowing the existence of
Overview key concepts and terms (based on the textbook Chang 2006 and the practical manual)
") Introduction Geo-information Science (GRS-10306) Overview key concepts and terms (based on the textbook 2006 and the practical manual) Introduction Chapter 1 Geographic information system (GIS) Geographically
Introduction Geo-information Science (GRS-10306) Overview key concepts and terms (based on the textbook 2006 and the practical manual) Introduction Chapter 1 Geographic information system (GIS) Geographically
ENV208/ENV508 Applied GIS. Week 2: Making maps, data visualisation, and GIS output
 ENV208/ENV508 Applied GIS Week 2: Making maps, data visualisation, and GIS output Overview GIS Output Map Making Types of Maps Key Elements GIS Output Formats Table Graph Statistics Maps Map Making Maps
Overview. GIS Data Output Methods
 Overview GIS Output Formats ENV208/ENV508 Applied GIS Week 2: Making maps, data visualisation, and GIS output GIS Output Map Making Types of Maps Key Elements Table Graph Statistics Maps Map Making Maps
Introduction to GIS I
 Introduction to GIS Introduction How to answer geographical questions such as follows: What is the population of a particular city? What are the characteristics of the soils in a particular land parcel?
physical universe at any scale. A map also contains
 Making Maps With GIS 1 Making Maps: Maps: A representation of the spatial organization of the physical universe at any scale. A map also contains a wide variety of information, both static and dynamic.
Basic principles of cartographic design. Makram Murad-al-shaikh M.S. Cartography Esri education delivery team
 Basic principles of cartographic design Makram Murad-al-shaikh M.S. Cartography Esri education delivery team Cartographic concepts Cartography defined The communication channel - Why maps fail Objectives
GTECH 380/722 Analytical and Computer Cartography Hunter College, CUNY Department of Geography
 GTECH 380/722 Analytical and Computer Cartography Hunter College, CUNY Department of Geography Fall 2014 Mondays 5:35PM to 9:15PM Instructor: Doug Williamson, PhD Email: Douglas.Williamson@hunter.cuny.edu
Conceptual Aspects of 3D Map Integration in Interactive School Atlases
 Conceptual Aspects of 3D Map Integration in Interactive School Atlases Christian Haeberling Hans Rudolf Baer Institute of Cartography ETH Zurich 8093 Zurich, Switzerland E-Mail: haeberling@karto.baug.ethz.ch
The Choropleth Map Slide #2: Choropleth mapping enumeration units
 The Choropleth Map Slide #2: Choropleth mapping is a common technique for representing enumeration data These are maps where enumeration units, such as states or countries, are shaded a particular color
Theory, Concepts and Terminology
 GIS Workshop: Theory, Concepts and Terminology 1 Theory, Concepts and Terminology Suggestion: Have Maptitude with a map open on computer so that we can refer to it for specific menu and interface items.
Maps and Data Types in GIS
 Lecture 3 Maps and Data Types in GIS Tomislav Sapic GIS Technologist Faculty of Natural Resources Management Lakehead University Data Types In GIS, data types and data models are forms of attribute representation
NAME HERE PERM # HERE
 NAME HERE PERM # HERE Geography 176A Final Examination 12/15/99 Answer all of the questions on the scanner sheet on the right of this first page by bubbling out your selection with a No. 2 pencil. Please
Mapping Earth. How are Earth s surface features measured and modeled?
 Name Mapping Earth How are Earth s surface features measured and modeled? Before You Read Before you read the chapter, think about what you know about maps Record your thoughts in the first column Pair
TECHNICAL DOCUMENT R 2 OF THE SPANISH BRAILLE COMMISSION GENERAL CRITERIA FOR PREPARING ADAPTED MAPS FOR VISUALLY IMPAIRED PERSONS
 TECHNICAL DOCUMENT R 2 OF THE SPANISH BRAILLE COMMISSION GENERAL CRITERIA FOR PREPARING ADAPTED MAPS FOR VISUALLY IMPAIRED PERSONS Updated on December 2013 (Version 1) First edition in English, March 2015
Cartographic Skills. L.O. To be aware of the various cartographic skills and when to use them
 Cartographic Skills L.O. To be aware of the various cartographic skills and when to use them Cartographic Skills The term cartography is derived from two words: Carto = map graphy = write/draw Cartography
Maps: Geography s Basic Tools
 Maps: Geography s Basic Tools What is a map? - A map is a representation of the earth s features drawn on a flat surface. - Maps use points, lines, colours, and symbols to represent the features of an
The Elements of GIS. Organizing Data and Information. The GIS Database. MAP and ATRIBUTE INFORMATION
 GIS s Roots in Cartography Getting Started With GIS Chapter 2 Dursun Z. Seker MAP and ATRIBUTE INFORMATION Data (numbers and text) store as files refer to them collectively as a database gather inform.
Map Reading: Grades 4 & 5
 Map Reading: Grades 4 & 5 Grades: 4,5 Team Size: 1-2 competitors Duration: 25 minutes Supervisors: Sriram Garapati, Rebecca Neill-Totsuka Summary Description Students will solve a mystery using different
Geog183: Cartographic Design and Geovisualization Winter Quarter 2017 Lecture 6: Map types and Data types
 Geog183: Cartographic Design and Geovisualization Winter Quarter 2017 Lecture 6: Map types and Data types Data types Data dimension: Point, Line, Area, Volume (Text) Data continuity: Discrete, Point, Polygon:
Different types of maps and how to read them.
 Different types of maps and how to read them. A map is a picture or representation of the Earth's surface, showing how things are related to each other by distance, direction, and size. Maps have been
A Review: Geographic Information Systems & ArcGIS Basics
 A Review: Geographic Information Systems & ArcGIS Basics Geographic Information Systems Geographic Information Science Why is GIS important and what drives it? Applications of GIS ESRI s ArcGIS: A Review
 estrandh@uoregon.edu Introduction The general topic of this paper describes a unique cartographic project depicting a mountain landscape for the Friends of Opal Creek (F.O.C.), a non-profit organization.
MAP STUDY: INTERPRETATION OF SURVEY MAPS
 MAP STUDY: INTERPRETATION OF SURVEY MAPS Types and Elements of Maps Maps are drawn to represent the Earth on a piece of paper. Maps are used widely to represent the Earth. Maps use signs and symbols in
Problems and Challenges
 2018 Esri Petroleum GIS Conference Problems and Challenges May 9 10, 2018 Houston, Texas George R. Brown Convention Center Disunity of drawing standards and format Large amount of work in Cartography,
Different Displays of Thematic Maps:
 Different Displays of Thematic Maps: There are a number of different ways to display or classify thematic maps, including: Natural Breaks Equal Interval Quantile Standard Deviation What s important to
Aileen Buckley, Ph.D. and Charlie Frye
 An Information Model for Maps: Towards Production from GIS Databases Aileen Buckley, Ph.D. and Charlie Frye Researchers, ESRI GIS vs. cart GIS Outline of the presentation Introduction Differences between
data becomes available to us. We already have crude maps of the Mars and the Moon. A map gives a picture of one or several of the elements of the
 FUNDAMENTALS OF MAPS THE SPHERICAL earth is best represented bya three-dimensional model of the earth, called a globe. All parts of the earth can be shown on it in their true shape, area and location along
An Introduction to Geographic Information System
 An Introduction to Geographic Information System PROF. Dr. Yuji MURAYAMA Khun Kyaw Aung Hein 1 July 21,2010 GIS: A Formal Definition A system for capturing, storing, checking, Integrating, manipulating,
Lecture 5. Representing Spatial Phenomena. GIS Coordinates Multiple Map Layers. Maps and GIS. Why Use Maps? Putting Maps in GIS
 Lecture 5 Putting Maps in GIS GIS responds to three fundamental questions by automating spatial data: What is where? Why is it there? GIS reveals linkages unevenly distributed social, economic and environmental
Cartography and Geovisualization. Chapters 12 and 13 of your textbook
 Cartography and Geovisualization Chapters 12 and 13 of your textbook Why cartography? Maps are the principle means of displaying spatial data Exploration: visualization, leading to conceptualization of
Keith C. Clarke Department of Geologyand Geography Hunter College-CUNY 695 Park Avenue New York, NY 10021,USA
 DISTORTION ON THE INTERRUPTED MODIFIED COLLIGNON PROJECTION Keith C. Clarke Department of Geologyand Geography Hunter College-CUNY 695 Park Avenue New York, NY 10021,USA and Karen A. Mulcahy Earth and
Chapter 1 Overview of Maps
 Chapter 1 Overview of Maps In this chapter you will learn about: Key points when working with maps General types of maps Incident specific maps Map legend and symbols Map sources A map is a navigational
History of Cartography,
 Maps History of Cartography, the art and science of making maps ~2300 BC ~600 BC Early oldest known maps: Babylonian clay tablets. Greek and Roman Ptolemy s (about AD 85-165) "world map" depicted the Old
EXTRA CREDIT Extra Credit Atlas Exercise for Exam I is available on the course home page
 EXTRA CREDIT Extra Credit Atlas Exercise for Exam I is available on the course home page. Submit answers to me using the blue Scantron sheet by Feb. 19, 2019. Once you have completed the exercise, transfer
GED 554 IT & GIS. Lecture 6 Exercise 5. May 10, 2013
 GED 554 IT & GIS Lecture 6 Exercise 5 May 10, 2013 Free GIS data sources ******************* Mapping numerical data & Symbolization ******************* Exercise: Making maps for presentation GIS DATA SOFTWARE
WORKING OUT OF METODS OF REALIZATION OF ELEMENTS OF THE MATHEMATICAL BASIS OF MAPS
 CO-278 WORKING OUT OF METODS OF REALIZATION OF ELEMENTS OF THE MATHEMATICAL BASIS OF MAPS IVANOV A.G., ZAGREBIN G.I. Moscow State University of Geodesy and Cartography, MOSCOW, RUSSIAN FEDERATION INTRODUCTION
Give 4 advantages of using ICT in the collection of data. Give. Give 4 disadvantages in the use of ICT in the collection of data
 Give 4 advantages of using ICT in the collection of data can use a handheld GPS to get accurate location information which can be used to show data linked to specific locations within a GIS can collect
Lecture 2. A Review: Geographic Information Systems & ArcGIS Basics
 Lecture 2 A Review: Geographic Information Systems & ArcGIS Basics GIS Overview Types of Maps Symbolization & Classification Map Elements GIS Data Models Coordinate Systems and Projections Scale Geodatabases
Topographic Maps. Take Notes as you view the slides
 Topographic Maps Take Notes as you view the slides Lesson Objectives Define a topographic map and state its uses. Describe how contour lines show the elevations, shape, and slope of the land. Identify
Appropriate Selection of Cartographic Symbols in a GIS Environment
 Appropriate Selection of Cartographic Symbols in a GIS Environment Steve Ramroop Department of Information Science, University of Otago, Dunedin, New Zealand. Tel: +64 3 479 5608 Fax: +64 3 479 8311, sramroop@infoscience.otago.ac.nz
Topographic Maps and Landforms Geology Lab
 Topographic Maps and Landforms Geology Lab Ray Rector: Instructor Today s Lab Activities 1) Discussion of Last Week s Lab 2) Lecture on Topo Maps and Elevation Contours 3) Construct Topographic Maps and
WHO IS WHO ON THE MAP?
 WHO IS WHO ON THE MAP? Eng. Stanislav Vasilev, PhD Assoc. Professor in Department of Photogrammetry and Cartography 1, Christo Smirnenski blvd. 1046 Sofia, Bulgaria e-mail: vasilevs_fgs@uacg.bg Abstract
The details represented in the map depends mostly on the scale at which the map is designed.
 Measurement IN GIS A map is a visual representation of an area a symbolic depiction highlighting relationships between elements of that space such as objects, region, themes. The details represented in
AP Human Geography Chapter 1: Thinking Geographically Key Issue 1: How do Geographers describe where things are?
 AP Human Geography Chapter 1: Thinking Geographically Key Issue 1: How do Geographers describe where things are? Studying Human Geography Physical Geography Physical geography deals with Earth s natural
The Geodatabase Working with Spatial Analyst. Calculating Elevation and Slope Values for Forested Roads, Streams, and Stands.
 GIS LAB 7 The Geodatabase Working with Spatial Analyst. Calculating Elevation and Slope Values for Forested Roads, Streams, and Stands. This lab will ask you to work with the Spatial Analyst extension.
Sampling The World. presented by: Tim Haithcoat University of Missouri Columbia
 Sampling The World presented by: Tim Haithcoat University of Missouri Columbia Compiled with materials from: Charles Parson, Bemidji State University and Timothy Nyerges, University of Washington Introduction
Summary thematic point techniques
 Summary thematic point techniques Dot maps Graduated symbols Bar linear (1D) proportional symbol Circle 2D proportional symbol (and other shapes) Range graded symbols classed by size Segmented symbols
EXTRA CREDIT. 6 Geographers Tools. Maps and their Parts MAP MAKING QUANDRY MAP MAKING
 EXTRA CREDIT Extra Credit Atlas Exercise for Exam I is available on the course home page. Submit answers to me using the blue Scantron sheet by Feb. 19, 2019. Once you have completed the exercise, transfer
EXTRA CREDIT. 6 Geographers Tools. Maps and their Parts MAP MAKING QUANDRY MAP MAKING 2/15/19 MAP PROJECTIONS MAP PROJECTIONS
 EXTRA CREDIT Extra Credit Atlas Exercise for Exam I is available on the course home page. Submit answers to me using the blue Scantron sheet by Feb. 19, 2019. Once you have completed the exercise, transfer
Overview. GIS Terminology
 Overview GIS Terminology MFworks Terminology Overview This is a glossary of geography and MFworks terminology and concepts that may not be familiar to novice MFworks users and non-geographers. The explanations
Introduction to GIS Sarah Watson University of Kentucky Libraries March 6, 2017
 Introduction to GIS Sarah Watson sarahwatson@uky.edu University of Kentucky Libraries March 6, 2017 Outline Overview of various terms Quick overview of ArcGIS and QGIS Geocoding Activity Considering Map
AP Human Geography Unit I: Intro to Geography
 Thinking Geographically: Key Issue 1 What Is Human Geography? De Blij pp. 1 9 1. According to the text, how many people are malnourished in the world? 2. World Hunger Use the map on page 2 3 in your textbook
0 Maps are the principle means of displaying spatial data
 Why cartography? 0 Maps are the principle means of displaying spatial data 0 Exploration: visualization, leading to conceptualization of patterns and processes. (Chap 13) 0 Communication: convey information
DATA APPLIANCE FOR ARCGIS
 DATA APPLIANCE FOR ARCGIS Data Appliance for ArcGIS Provides Access to Multi-Scale Basemaps Down to Medium Scale Levels Worldwide And Large Scale for Most of the World The Data Appliance includes Several
5. How has globalization hindered the nation of Kenya?
 Thinking Geographically: Key Issue 1 What Is Human Geography? De Blij pp. 1-9 1. According to the text, how many people are malnourished in the world? 2. World Hunger - Use the map on page 2-3 in your
STUDYING THE EFFECT OF DISTORTION IN BASIC MAP ELEMENTS FOR THE DEGREE OF SPATIAL ACCURACY OF GAZA STRIP MAPS
 STUDYING THE EFFECT OF DISTORTION IN BASIC MAP ELEMENTS FOR THE DEGREE OF SPATIAL ACCURACY OF GAZA STRIP MAPS Maher A. El-Hallaq Assistant professor, Civil Engineering Department, IUG,, mhallaq@iugaza.edu.ps
GTECH 380/722 Analytical and Computer Cartography Hunter College, CUNY Department of Geography
 GTECH 380/722 Analytical and Computer Cartography Hunter College, CUNY Department of Geography Fall 2011 Mondays 5:35PM to 9:15PM Instructor: Doug Williamson, PhD Email: Douglas.Williamson@hunter.cuny.edu
What is GIS? Introduction to data. Introduction to data modeling
 What is GIS? Introduction to data Introduction to data modeling 2 A GIS is similar, layering mapped information in a computer to help us view our world as a system A Geographic Information System is a
Task 1: Start ArcMap and add the county boundary data from your downloaded dataset to the data frame.
 Exercise 6 Coordinate Systems and Map Projections The following steps describe the general process that you will follow to complete the exercise. Specific steps will be provided later in the step-by-step
2.2 Geographic phenomena
 2.2. Geographic phenomena 66 2.2 Geographic phenomena 2.2. Geographic phenomena 67 2.2.1 Defining geographic phenomena A GIS operates under the assumption that the relevant spatial phenomena occur in a
Test Bank Chapter 2: Representations of Earth
 Multiple Choice Test Bank Chapter 2: Representations of Earth 1. A rhumb line on a Mercator projection is a line of. a. true size b. true shape c. true compass bearing d. true location 2. Maximum longitude
ArcGIS Tools for Professional Cartography
 ArcGIS Tools for Professional Cartography By Makram Murad-al-shaikh M.S. Cartography Senior instructor ESRI Educational Services ICC - A Coruña - Spain, 9-16 July, 2005 Overview Overview of the ArcGIS
Progression of skills in Geography
 New Curriculum Holy Trinity CE Primary Academy 2013-14 Subject: Geography Skills: Progression of skills in Geography Geographical enquiry Teacher led enquiries, to ask and respond to simple closed questions.
1. Origins of Geography
 II. ORIGINS AND BRANCHES OF GEOGRAPHY My Notes A. Origins of Geography Unit One 6 Before carefully examining the tools of the geographer, it would be useful to examine the origins and roots of this ancient
Combining Geospatial and Statistical Data for Analysis & Dissemination
 Combining Geospatial and Statistical Data for Analysis & Dissemination (with Special Reference to Qatar Census 2010) Presentation by Mansoor Al Malki, Director of IT Department Qatar Statistics Authority
Quality and Coverage of Data Sources
 Quality and Coverage of Data Sources Objectives Selecting an appropriate source for each item of information to be stored in the GIS database is very important for GIS Data Capture. Selection of quality
Lesson Plan 2 - Middle and High School Land Use and Land Cover Introduction. Understanding Land Use and Land Cover using Google Earth
 Understanding Land Use and Land Cover using Google Earth Image an image is a representation of reality. It can be a sketch, a painting, a photograph, or some other graphic representation such as satellite
Lecture 9: Reference Maps & Aerial Photography
 Lecture 9: Reference Maps & Aerial Photography I. Overview of Reference and Topographic Maps There are two basic types of maps? Reference Maps - General purpose maps & Thematic Maps - maps made for a specific
Physical Geography Lab Activity #15
 Physical Geography Lab Activity #15 Due date Name Choropleth Maps COR Objective 1 & 7, SLOs 1 & 3 15.1. Introduction Up until this point we have used maps to find locations on the Earth. While they are
Maps Page Level of Difficulty:
 Chapter 11 Maps Page Level of Difficulty: 11.1 Introduction As scaled depictions of the world, maps are by necessity abstractions of reality. The abstraction takes many forms. Some features are left out
Applied Cartography and Introduction to GIS GEOG 2017 EL. Lecture-1 Chapters 1 and 2
 Applied Cartography and Introduction to GIS GEOG 2017 EL Lecture-1 Chapters 1 and 2 What is GIS? A Geographic Information System (GIS) is a computer system for capturing, storing, querying, analyzing and
An interactive tool for teaching map projections
 An interactive tool for teaching map projections Map projections are one of the fundamental concepts of geographic information science and cartography. An understanding of the different variants and properties
Georeferencing. datum. projection. scale. The next few lectures will introduce you to these elements. on the Earth, you ll need to understand how
 Georeferencing GOAL: To assign a location to all the features represented in our geographic information data In order to do so, we need to make use of the following elements: ellipsoid/geoid To determine
ch02.pdf chap2.pdf chap02.pdf
 Introduction to Geographic Information Systems 8th Edition Karl Solutions Manual Full Download: http://testbanklive.com/download/introduction-to-geographic-information-systems-8th-edition-karl-solutions-manu
Learning Target : Describe the purposes and uses of different types of maps.
 Learning Target : Describe the purposes and uses of different types of maps. Directions: 1. Below, place a where you think you are located. 2. In which continent are you located? 3. In which country are
Intro to GIS In Review
 Intro to GIS In Review GIS Analysis Winter 2016 GIS A quarter in review Geographic data types Acquiring GIS data Projections / Coordinate systems Working with attribute tables Data classification Map design
Lab 1: Importing Data, Rectification, Datums, Projections, and Output (Mapping)
") Lab 1: Importing Data, Rectification, Datums, Projections, and Output (Mapping) Topics covered in this lab: i. Importing spatial data to TAS ii. Rectification iii. Conversion from latitude/longitude to
Lab 1: Importing Data, Rectification, Datums, Projections, and Output (Mapping) Topics covered in this lab: i. Importing spatial data to TAS ii. Rectification iii. Conversion from latitude/longitude to
Introduction to Geoinformatics I
 Introduction to Geoinformatics I MAP CONCEPT Definition: 1) A map is a visual representation of an area a symbolic depiction highlighting relationships between elements of that space such as objects, regions,
Geog183: Cartographic Design and Geovisualization Spring Quarter 2018 Lecture 11: Dasymetric and isarithmic mapping
 Geog183: Cartographic Design and Geovisualization Spring Quarter 2018 Lecture 11: Dasymetric and isarithmic mapping Discrete vs. continuous revisited Choropleth suited to discrete areal, but suffers from