Maps and Data Types in GIS
|
|
|
- Elwin Rodgers
- 6 years ago
- Views:
Transcription
1 Lecture 3 Maps and Data Types in GIS Tomislav Sapic GIS Technologist Faculty of Natural Resources Management Lakehead University
2 Data Types In GIS, data types and data models are forms of attribute representation of observed phenomena. Data types representations of values. Data Type Categories: Numeric Text (string, character) Date Boolean (binary) Representations: Integer Text Time and True/False (+/-) (whole number): 1, -1, 2, 102, ; (letters like a, b, c, but also characters 1, 2, 3, _, #) date Floating point, double (real number, decimal number): , ,
3 Levels of Measurement GIS is used to capture any spatially related information, which means almost any type of data. Different data types are suitable for different levels of measurement data type values are assigned to measured variables. Nominal Qualitative Abrupt Smooth Discrete Continuous Ordinal Interval Ratio Quantitative Nominal data: different kinds or categories (e.g., dominant tree species) could be text or integer values. Ordinal data: ranking relationship (e.g., stand site class) usually represented by integer values. Interval data: have known intervals between data, a zero doesn t mean zero units (e.g., temperature in C ) usually decimal values (float or double). Ratio data : similar to interval data but having an absolute zero (e.g., temperature in Kelvins, tree height, wood volume) usually decimal values (float or double).
4 Computer (Digital) Binary System The smallest unit of computer memory is byte. One byte contains 8 bits. Eight bits in the binary system when converted to the decimal system can be a range of numbers from 0 to = = = 249 The above approach is used to produce integers, a different approach is applied in storing decimal numbers. Decimal numbers are saved through binary representations of their components: sign, significand and exponent. Sign (one or zero) Significand (coefficient) (-1) s x c x b q Exponent Base (10 or 2) = -1-1 x x 10-6
5 Data Types in ArcGIS In a GIS software, such as ArcGIS, data types refer to the attributes in the vector data model and cell values in the raster data model. In the vector data model, attributes are stored in table fields. A field can accept only one data type e.g., there can t be a letter saved in an integer field. Data Type Text Integer Float Double Date Boolean Description Characters such as letters, numerical digits, common punctuation marks. In the computer memory, characters are coded and stored as numbers e.g. in the ASCII (American Standard Code for Information Exchange) scheme English alphabet characters are given code numbers stored in 1 byte size memory holders. Unicode is, on the other hand, an international encoding standard that codes for characters used in most of world s writing systems. Whole number no decimal places. In ArcGIS integers are signed can be positive and negative, as opposed to unsigned integers. Short signed integers take 2 bytes of space in the memory (storable range -32,768 to 32,768), and long signed integers take 4 bytes of space (storable range -2,147,483,648 to 2,147,483,647). Decimal number; single-precision floating point number; 4 bytes; storable range to Decimal number; double-precision floating point number; 8 bytes; storable range to Stores dates, times, or dates and times. Some databases also have an option of specifying the boolean data type, in which case only one binary number is stored (either 1 or 0) and is shown to the user as True or False, respectively.

6 Text Data Type Computer Storage Text is stored in the computer as a series of characters, each of which is coded in the binary system and occupies 1 byte of memory. Character coding specifies the correspondence between the binary pattern and symbols used in the written language. ASCII (American Standard Code for Information Interchange) Printable Characters

 values string are part of the decision. Ontario_major_cities.shp Fields are variables and attributes are values.")
7 Data Types in Vector Data Model In the vector data model, data types refer to designations of the fields in the table each field is assigned a certain data type and only values of that data type can be stored in that particular field. Data types are decided on during the process of the table design and are based on the data that are being stored or anticipated to be stored and the type of analysis one expects to carry out. Issues such as expected range of numerical values, length of a text (character) values string are part of the decision. Ontario_major_cities.shp Fields are variables and attributes are values. Fields created of a certain data type occupy the memory space relative to the number of records (rows) and irrespective of the values stored in them.
 can be specified for floats")

8 Data Types in Vector Data Model Precision (total number of digits) and Scale (number of decimal places) can be specified for floats and doubles. In ArcGIS, text data type can be distinguished from numerical data type by alignment. Text left-aligned Numbers right-aligned

9 Not All Zeros in Shapefile Table Were Created Equal Numeric fields (integer, float, double) in shapefile (dbase) tables get populated with zeroes by default, zero then meaning an empty space. However, many data representations use zeroes for specific values (e.g., a 0 site class in FRI represents the best site class), creating a situation where zeros in the same field can have two very different meanings. This is solved in geodatabase feature classes with the introduction of the Null attribute, which means no value. OSPCOMP Overstory Species Composition Productive stands OSC Overstory Site Class Not a stand (could be a lake, wetland, road, etc.)
 is a variable and cells have values")

 and")
10 Data Types in Raster Data Model Raster (band) is a variable and cells have values assigned to them. Rasters created of a certain data type occupy the memory space relative to the number of cells (columns x rows) and irrespective of the values stored in them.
11 Maps in GIS Several definitions from different sources on what a map is: 1. A map is a representation of spatial information. 2. A map is a spatial representation of the environment. 3. A map is a simplified depiction of a space, a navigational aid which highlights relations between objects within that space.
12 Maps in GIS Two points to keep in mind regarding maps: Maps are a form of communication, which means that what they show should be clear and understandable to a broad range of users. This then invokes symbology, selectiveness and narration. Being a simplified spatial representation and (almost exclusively) a scaleddown one, maps have to provide information in a way that will enable the users to understand orientation, spatial characteristics and spatial relations between the represented features (phenomena).
13 Maps in GIS Easiness with which maps can be made with GIS software and abundance of GIS datasets have opened room for an easy creation of maps that often end up being of poor quality in terms of their content and functionality. When creating maps, GIS users should try to at least include all map elements, make the content clear and understandable (proper names of legend items, clear labelling, etc.), and use conventional colours for basic features (blue for lakes and streams, black or red for roads, etc.).
 Data source (map author, date of creation, date of data, map")
14 Basic Map Elements Map body Title Legend Scale Projection Direction (North Arrow) Data source (map author, date of creation, date of data, map projection)


15 Map Design The purpose: to enhance map communication by creating a map that is balanced, coherent, ordered and interesting to look at (Antes et al. 1985). Poorly designed map The box around the legend attracts the viewer s attention to it. Source: Chang (2008).
16 Map Design Too many boxes distract the viewer. The state border in the display on the right is thicker, differentiating it from the county borders. Source: Chang (2008).

17 Are all Basic Map Elements Always Necessary? North Arrow? Scale?
18 Map Title Generally, the title should indicate the major theme being mapped, the geographic region, and the date of the data. It should be placed at the top of the map; if choosing between the left and the right side, preferably it should be on the left side. Map Legend Basic features should be explained if not obvious such as lakes, rivers. The legend should have a title if the legend topic is more specific that what the map title suggests. Avoid using Legend. Larger values in the legend should be above smaller values because of human perception up = larger.


19 Appropriate Not so Much Source: Slocum (1999).

20 Font Use sans serif. Use only one font for the entire display. Legibility is more important than decorative value. Use size to distinguish between major elements. A combination of uppercase and lowercase lettering is more readable than uppercase alone. Uppercase may be used for short titles. Avoid size smaller than 10 points ( 1 point = 1/72 of an inch (0.35 mm)) Use bold lettering for important elements only, such as titles. Many different fonts reduce clarity and cause distraction. Source: Chang (2008).
21 Fonts in ArcGIS To keep it on the safe side, if not sure how the map file will react to the displaying device, use common fonts, such as Aerial or Times New Roman. Special characters can be copied over from the operating system character dataset.


22 Labels In GIS, labels usually refer to the feature attributes displayed on their respective features. Maps primary function is to convey spatial information. Labels should be brought down to minimal and tables used instead. Sometimes, though, labels are a part of the requirement, e.g. regulations.
23 General Rules on Labels Incorrect Labels should be easily perceived and unambiguous. Avoidance of overlap. Conformance to shape and extent of area features. Avoidance of excessive clustering of names. Correct Conformance to the curvature of the parallels for horizontal placements. Conformance to applicable standards and conventions. Source: Chang (2008).
24 Printing and Displaying Maps Maps are created to be viewed on different media. Some examples of the map media are: o Paper sheets (e.g., standalone maps, poster and journal figures, etc.) o Digital files (e.g., pdf, jpg) o Powerpoint presentations The spatial size (e.g. map scale) and the amount of the information on a map should reflect the means of viewing by the map viewers (Can one zoom in onto the map, from how close will average viewers be looking at the map (posters behind a presentation booth!), for how long is the map displayed (powerpoint presentation!)?). Maps are a message, and the message should be clear and effective.
25 Printing and Displaying Maps The first thing when creating maps is to set the size of the map printout (display). Sizes can vastly vary. From a small figure in a report or a journal paper to a severalfeet-across standalone map poster. The set size will dictate the map scale. Letters two inches high are seen at a distance of fourteen feet at approximately the same size as a 10-point type seen at a reading distance of one foot. Test seeing the map in a display that is intended for (e.g., projector, black and white printout, etc.)


26 Source: com/canada/images&do wnloads/map_phys.pdf Source:
 the features. Care should be taken not to degrade original data.")
27 Simplifying Maps Other than controlling the labels and text, maps can be also made more simple by reducing the quantity of features shown or by simplifying (generalizing) the features. Care should be taken not to degrade original data. Generalizing the features Reducing the amount of features to only those above a certain size.


28 Colours: Additive and Subtractive Colour Theory Additive Subtractive Paint, print ink, filters Light, screen displays (computer, TV), projectors.

29 Computer RGB Colour Model (Additive) Red, green and blue are primary colours. Source: Jensen (2007). Yellow, magenta and cyan are also called complementary colours in pairs with their primary colour counterpart they produce white light. Black is the absence of all colours.
 C")

30 CMYK Colour Model (Subtractive) C Cyan M Magenta Y Yellow K Key (Black)
 V Value (0 100%)")

31 HSV Colour Model H Hue (0-360⁰) S Saturation (0 100%) V Value (0 100%) Suitable for assigning grayscale colours, setting the saturation of a colour, etc. Source: Jensen (2007).

32 Use of Saturation and Hue Source: Slocum (1999). the aim is to create a map that is logical in conveying its message.
.")
33 Choosing Proper Colour Schemes Logical versus illogical colour scheme Source: Slocum (1999).


34 Two Basic Map Types Topographic (General Reference) Thematic

35 Thematic Maps - Choropleth Maps Choropleth Maps created by shading area units according to a descriptive value. Limitations: Lacking possible spatial variation within the units. The boundaries of the units might be arbitrary and thus unlikely to reflect major discontinuities. Consider data standardization. Unstandardized versus standardized data representation Source: Slocum (1999).

36 Levels of Measurement and Symbology Source: Slocum (1999).

37 Symbolizing Attribute Data All features, i.e., all attributes, in a layer can be displayed with the same symbol, or groups of attributes or selected attributes, can be displayed with different symbols. All features, i.e. all attributes are displayed with the same symbol. The two main ways in GIS of displaying attributes separately: o Categories > Unique Values o Quantities > Graduated Colours (Symbols)

38 Symbolizing Attribute Data Categories: Unique Values Used for discrete data nominal and ordinal levels of measurement.
39 Symbolizing Attribute Data Quantities: Graduated Colours (Symbols) Data are classed into groups (classes). Interval and Ratio levels of measurement. Classes can be defined in different ways; ArcMap offers seven classification schemes: o Manual o Equal Interval o Defined Interval o Quantile o Natural Breaks o Geometric Interval o Standard Deviation
 Maximum Breaks (D) Natural Breaks (E) Optimal (F) Source: Slocum")
40 Classification Schemes - General Equal Intervals (A) Quantile (B) Mean Standard Deviation (C) Maximum Breaks (D) Natural Breaks (E) Optimal (F) Source: Slocum (1999).

41 Graduated Colours Classification Schemes - ArcMap Manual classification allows the user to set up her own intervals. The histogram shows both original data, in gray columns, and created intervals.


42 Graduated Colours Classification Schemes - ArcMap Equal Interval breaks the whole range of values into equal intervals (class ranges).


43 Graduated Colours Classification Schemes - ArcMap Defined Interval classification breaks the range of values into intervals defined by the user.


44 Graduated Colours Classification Schemes - ArcMap Quantile classification breaks the range of values into classes of equal frequencies


45 Graduated Colours Classification Schemes - ArcMap Natural Breaks classification divides the range of values into natural classes defined by ArcMap similar values are grouped together and differences between classes are maximized.
 breaks the range of")

46 Classification Schemes - ArcMap eometric Interval (Smart Quantile) breaks the range of values into classes of similar requencies and with fairly consistent changes between intervals.


47 Graduated Colours Classification Schemes - ArcMap Standard Deviation classification separates the range of values into classes based on the standard deviations around mean. Standard deviations and mean shown.

48 Map Projection Maps should be displayed with a proper map projection -- e.g., two popular map projections in Canada are UTM, for the areas south of 84 latitude and with a width around the width, at the latitude in question, of a UTM zone, and Lambert Conformal Conic for areas wider than that. Unless there is a very specific and compelling reason, GCS should never be used to display maps. Displayed in UTM Displayed in Lambert Conformal Conic
49 Forest Management Planning Maps Overall directions on maps are provided in the Forest Information Manual (FIM), (Part B, Section 7.0 Forest Management Planning Maps). FIM then directs to look for more specifics on map standards and content in other specialized manuals, such as FIM Forest Management Planning Technical Specifications and FIM Base and Values Technical Specifications.

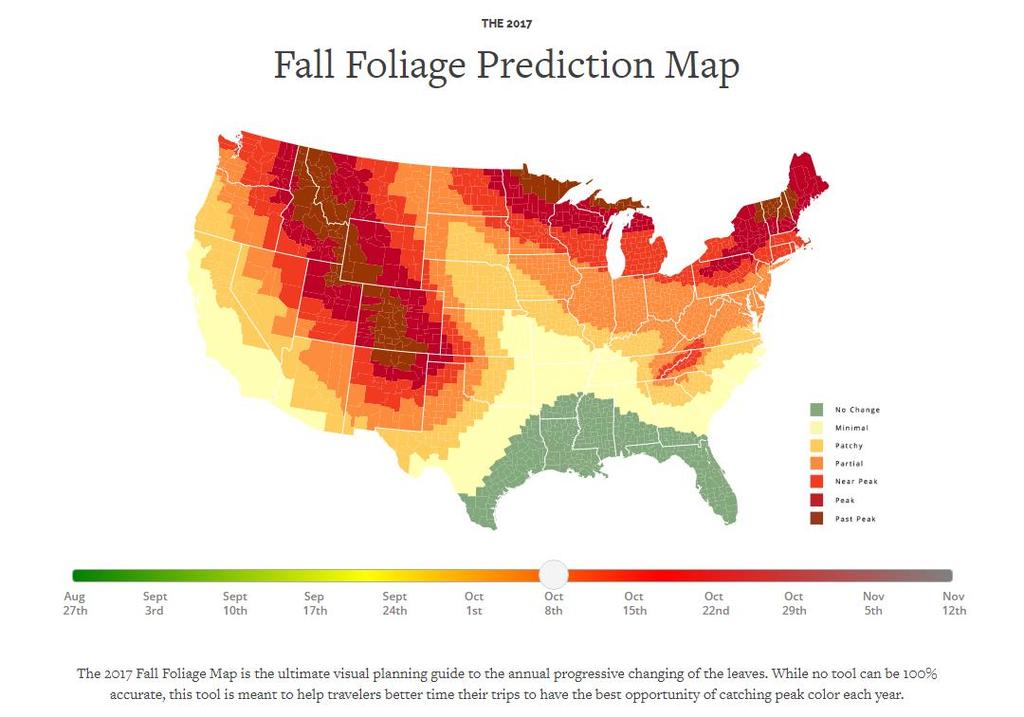
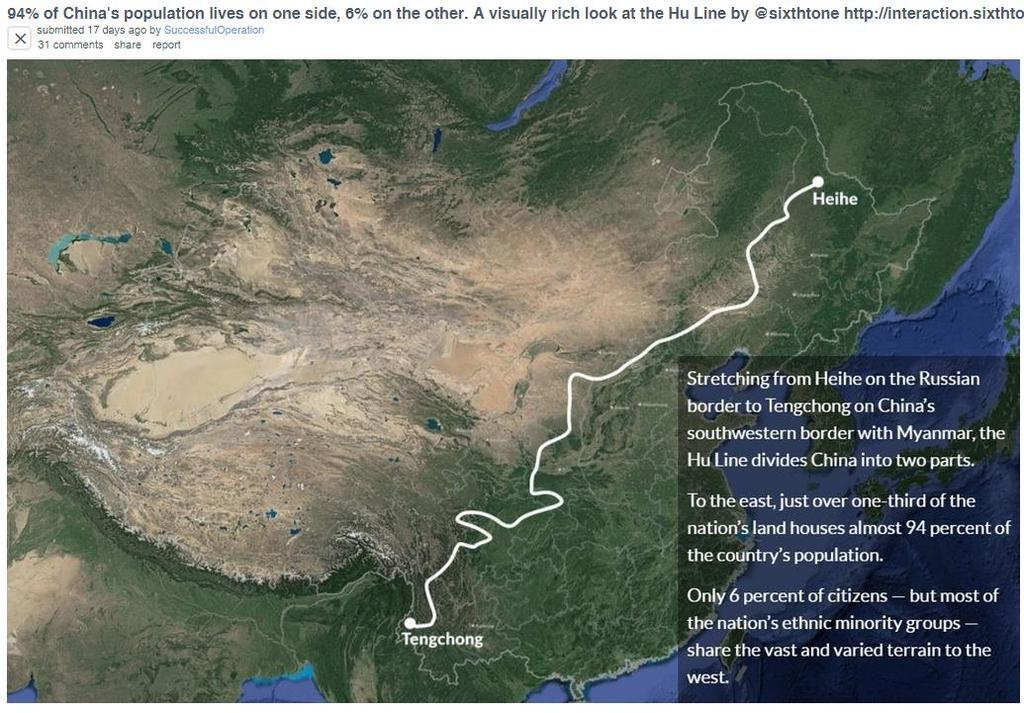
50 Examples of inventive, interesting and creative maps (referenced mainly through Simon Keustenmacher and Paul Banks comments/70h9n1/i_drew_a_map_ of_the_indigenous_people_languag es/?st=j7nyqkqb&sh=925ddb89


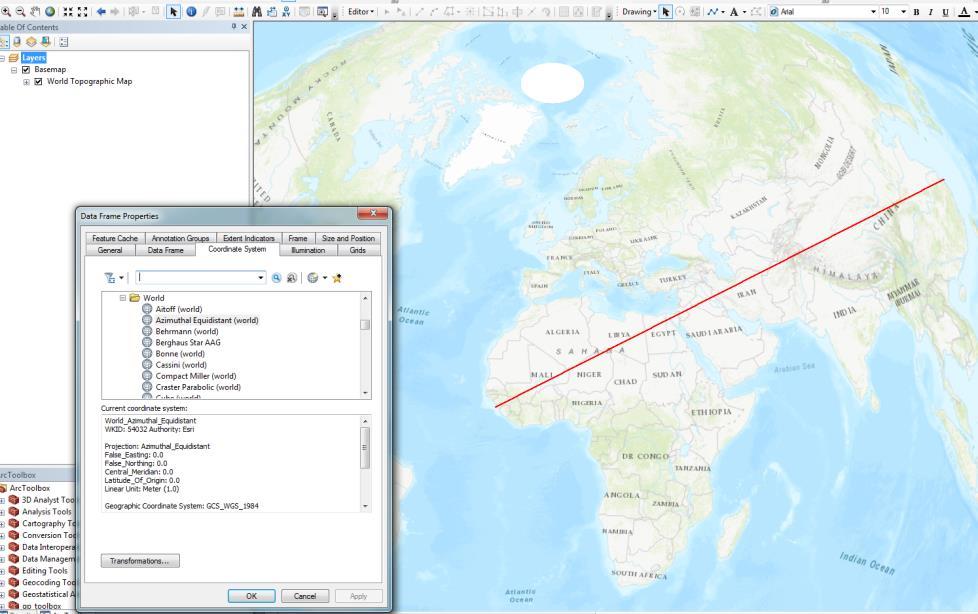
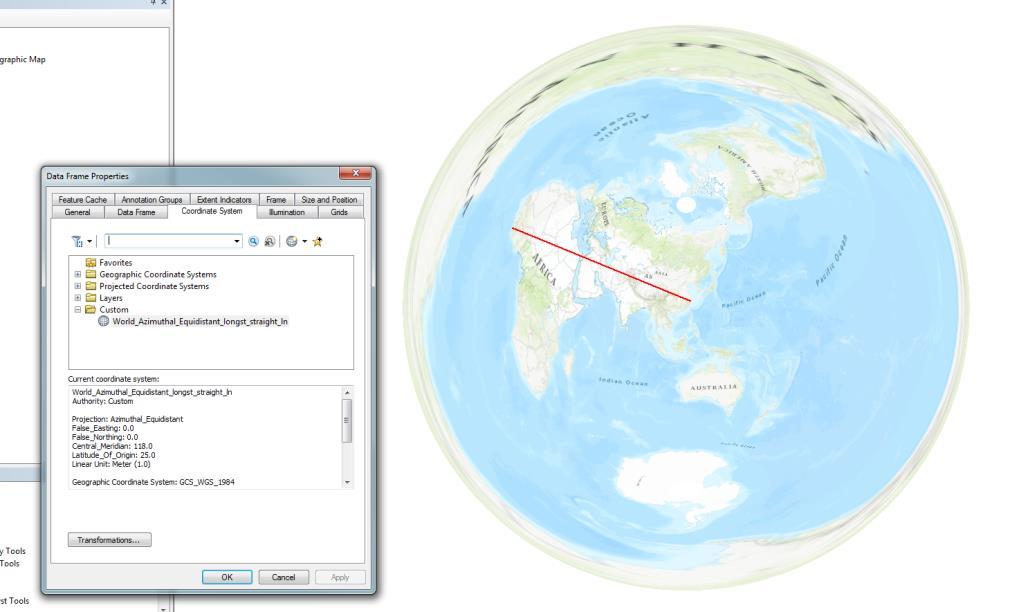
51 Author: Erik Crouch com/china/post/10356 /the-longest-straightpath-on-earth-startsin-east-china-ends-inliberia

52 omments/6w98kb/the_mississippi_ri ver_basin_in_the_united_states/?st=j 6URYOQ9&sh=7c8fcef6
53
54
55
56
57 Resources: Antes, J. R., K. Chang, and C Mullis The visual effects of map design: an eye movement analysis. The American Cartographer 12: Brewer, C. A Designing Better Maps: A Guide for GIS Users. ESRI Press. 202 pp. Chang, Kang-Tsung Introduction to Geographic Information System. McGraw-Hill. 450 pp. ESRI ArcGIS 10. ESRI ArcGIS 10 Help. Jensen., J. R Remote Sensing of the Environment: An Earth Resource Perspective. Pearson Prentice Hall. Lo, C. P. and A. K. W. Yeung Concepts and Techniques of Geographic Information Systems. Pearson Education Inc. 532 pp. Slocum, T. A Thematic Cartography and Visualization. Prentice-Hall, Inc. 293 pp.
CHAPTER 9 DATA DISPLAY AND CARTOGRAPHY
 CHAPTER 9 DATA DISPLAY AND CARTOGRAPHY 9.1 Cartographic Representation 9.1.1 Spatial Features and Map Symbols 9.1.2 Use of Color 9.1.3 Data Classification 9.1.4 Generalization Box 9.1 Representations 9.2
Chapter 7: Making Maps with GIS. 7.1 The Parts of a Map 7.2 Choosing a Map Type 7.3 Designing the Map
 Chapter 7: Making Maps with GIS 7.1 The Parts of a Map 7.2 Choosing a Map Type 7.3 Designing the Map What is a map? A graphic depiction of all or part of a geographic realm in which the real-world features
Lecture 5. GIS Data Capture & Editing. Tomislav Sapic GIS Technologist Faculty of Natural Resources Management Lakehead University
 Lecture 5 GIS Data Capture & Editing Tomislav Sapic GIS Technologist Faculty of Natural Resources Management Lakehead University GIS Data Input Surveying/GPS Data capture Facilitate data capture Final
GEOREFERENCING, PROJECTIONS Part I. PRESENTING DATA Part II
 Week 7 GEOREFERENCING, PROJECTIONS Part I PRESENTING DATA Part II topics of the week Georeferencing Coordinate systems Map Projections ArcMap and Projections Geo-referencing Geo-referencing is the process
The Geodatabase Working with Spatial Analyst. Calculating Elevation and Slope Values for Forested Roads, Streams, and Stands.
 GIS LAB 7 The Geodatabase Working with Spatial Analyst. Calculating Elevation and Slope Values for Forested Roads, Streams, and Stands. This lab will ask you to work with the Spatial Analyst extension.
Geography 281 Map Making with GIS Project Four: Comparing Classification Methods
 Geography 281 Map Making with GIS Project Four: Comparing Classification Methods Thematic maps commonly deal with either of two kinds of data: Qualitative Data showing differences in kind or type (e.g.,
Quiz 1. Quiz Instruc ons. Question 1. Question 2. 2 pts. 3 pts. This is a preview of the published version of the quiz. Started: Jul 3 at 4:29pm
 Quiz 1 This is a preview of the published version of the quiz Started: Jul 3 at 4:29pm Quiz Instruc ons Quiz 1 Question 1 Which of the following is not a basic element of map design that should be considered
Making Maps With GIS. Making Maps With GIS
 Making Maps With GIS Getting Started with GIS Chapter 7 Making Maps With GIS 7.1 The Parts of a Map 7.2 Choosing a Map Type 7.3 Designing the Map 1 What is a map? Map is the communication tool for the
GED 554 IT & GIS. Lecture 6 Exercise 5. May 10, 2013
 GED 554 IT & GIS Lecture 6 Exercise 5 May 10, 2013 Free GIS data sources ******************* Mapping numerical data & Symbolization ******************* Exercise: Making maps for presentation GIS DATA SOFTWARE
Lab #3 Map Projections.
 Lab #3 Map Projections http://visual.merriam-webster.com/images/earth/geography/cartography/map-projections.jpg Map Projections Projection: a systematic arrangement of parallels and meridians on a plane
Version 1.1 GIS Syllabus
 GEOGRAPHIC INFORMATION SYSTEMS CERTIFICATION Version 1.1 GIS Syllabus Endorsed 1 Version 1 January 2007 GIS Certification Programme 1. Target The GIS certification is aimed at: Those who wish to demonstrate
Lecture 1 Intro to GIS and GIS Vector and Raster Data Models
 Lecture 1 Intro to GIS and GIS Vector and Raster Data Models Tomislav Sapic GIS Technologist Faculty of Natural Resources Management Lakehead University Object GIS layer Use Hydro Pole utilities utility
Basic principles of cartographic design. Makram Murad-al-shaikh M.S. Cartography Esri education delivery team
 Basic principles of cartographic design Makram Murad-al-shaikh M.S. Cartography Esri education delivery team Cartographic concepts Cartography defined The communication channel - Why maps fail Objectives
Week 8 Cookbook: Review and Reflection
 : Review and Reflection Week 8 Overview 8.1) Review and Reflection 8.2) Making Intelligent Maps: The map sheet as a blank canvas 8.3) Making Intelligent Maps: Base layers and analysis layers 8.4) ArcGIS
Map image from the Atlas of Oregon (2nd. Ed.), Copyright 2001 University of Oregon Press
, Copyright 2001 University of Oregon Press") Map Layout and Cartographic Design with ArcGIS Desktop Matthew Baker ESRI Educational Services Redlands, CA Education UC 2008 1 Seminar overview General map design principles Working with map elements
Map Layout and Cartographic Design with ArcGIS Desktop Matthew Baker ESRI Educational Services Redlands, CA Education UC 2008 1 Seminar overview General map design principles Working with map elements
Overview key concepts and terms (based on the textbook Chang 2006 and the practical manual)
") Introduction Geo-information Science (GRS-10306) Overview key concepts and terms (based on the textbook 2006 and the practical manual) Introduction Chapter 1 Geographic information system (GIS) Geographically
Introduction Geo-information Science (GRS-10306) Overview key concepts and terms (based on the textbook 2006 and the practical manual) Introduction Chapter 1 Geographic information system (GIS) Geographically
Intro to GIS Summer 2012 Data Visualization
 Intro to GIS Summer 2012 Data Visualization UNDERSTANDING YOUR MAP DATA Qualitative vs. Quantitative Data Qualitative Data classified by category e.g. Soil types, Animal Species Quantitative Data grouped
Lecture 9: Reference Maps & Aerial Photography
 Lecture 9: Reference Maps & Aerial Photography I. Overview of Reference and Topographic Maps There are two basic types of maps? Reference Maps - General purpose maps & Thematic Maps - maps made for a specific
What is a map? A simple representation of the real world Two types of maps
 Mapping with GIS What is a map? A simple representation of the real world Two types of maps Reference maps showing reference features such as roads, locations, political boundaries, cities etc. Thematic
Lecture 5. Symbolization and Classification MAP DESIGN: PART I. A picture is worth a thousand words
 Lecture 5 MAP DESIGN: PART I Symbolization and Classification A picture is worth a thousand words Outline Symbolization Types of Maps Classifying Features Visualization Considerations Symbolization Symbolization
GIS in Management Planning. Lab 2 Coordinate Systems and Map Projections
 GIS in Management Planning Lab 2 Coordinate Systems and Map Projections Tomislav Sapic GIS Technologist Faculty of Natural Resources Management Lakehead University ArcGIS ArcToolbox Projections Functions
Performing Map Cartography. using Esri Production Mapping
 AGENDA Performing Map Cartography Presentation Title using Esri Production Mapping Name of Speaker Company Name Kannan Jayaraman Agenda Introduction What s New in ArcGIS 10.1 ESRI Production Mapping Mapping
Lecture 2. A Review: Geographic Information Systems & ArcGIS Basics
 Lecture 2 A Review: Geographic Information Systems & ArcGIS Basics GIS Overview Types of Maps Symbolization & Classification Map Elements GIS Data Models Coordinate Systems and Projections Scale Geodatabases
GTECH 380/722 Analytical and Computer Cartography Hunter College, CUNY Department of Geography
 GTECH 380/722 Analytical and Computer Cartography Hunter College, CUNY Department of Geography Fall 2014 Mondays 5:35PM to 9:15PM Instructor: Doug Williamson, PhD Email: Douglas.Williamson@hunter.cuny.edu
Geographers Perspectives on the World
 What is Geography? Geography is not just about city and country names Geography is not just about population and growth Geography is not just about rivers and mountains Geography is a broad field that
Problems and Challenges
 2018 Esri Petroleum GIS Conference Problems and Challenges May 9 10, 2018 Houston, Texas George R. Brown Convention Center Disunity of drawing standards and format Large amount of work in Cartography,
Lab#8: Working With Geodatabases. create a geodatabase with feature datasets, tables, raster datasets, and raster catalogs
 Lab#8: Geodatabase Concepts Page#1 of 25 In this lab, you will learn how to: Lab#8: Working With Geodatabases create a geodatabase with feature datasets, tables, raster datasets, and raster catalogs join
Presenting Tree Inventory. Tomislav Sapic GIS Technologist Faculty of Natural Resources Management Lakehead University
 Presenting Tree Inventory Tomislav Sapic GIS Technologist Faculty of Natural Resources Management Lakehead University Suggested Options 1. Print out a Google Maps satellite image of the inventoried block
A Review: Geographic Information Systems & ArcGIS Basics
 A Review: Geographic Information Systems & ArcGIS Basics Geographic Information Systems Geographic Information Science Why is GIS important and what drives it? Applications of GIS ESRI s ArcGIS: A Review
Lecture 6 - Raster Data Model & GIS File Organization
 Lecture 6 - Raster Data Model & GIS File Organization I. Overview of Raster Data Model Raster data models define objects in a fixed manner see Figure 1. Each grid cell has fixed size (resolution). The
FNRM 3131 Introduction to GIS in Natural Resource Management
 FNRM 3131 Introduction to GIS in Natural Resource Management Instructors: Andrew C Jenks 215 Green Hall ajenks@umnedu, @acjenks Paul V Bolstad 301H Green Hall pbolstad@umnedu Course Topics Motivation:
Introduction to Geographic Information Systems
 Introduction to Geographic Information Systems Lynn_Carlson@brown.edu 401-863-9917 The Environmental And Remote TecHnologies Lab MacMillan Hall, Room 105 http://www.brown.edu/research/earthlab/ Outline
Appropriate Selection of Cartographic Symbols in a GIS Environment
 Appropriate Selection of Cartographic Symbols in a GIS Environment Steve Ramroop Department of Information Science, University of Otago, Dunedin, New Zealand. Tel: +64 3 479 5608 Fax: +64 3 479 8311, sramroop@infoscience.otago.ac.nz
Popular Mechanics, 1954
 Introduction to GIS Popular Mechanics, 1954 1986 $2,599 1 MB of RAM 2017, $750, 128 GB memory, 2 GB of RAM Computing power has increased exponentially over the past 30 years, Allowing the existence of
Fundamentals of ArcGIS Desktop Pathway
 Fundamentals of ArcGIS Desktop Pathway Table of Contents ArcGIS Desktop I: Getting Started with GIS 3 ArcGIS Desktop II: Tools and Functionality 5 Understanding Geographic Data 8 Understanding Map Projections
GIS Quick Facts. CIVL 1101 GIS Quick Facts 1/5.
 CIVL 1101 1/5 What is GIS? Geographic Information Systems (GIS) provide a platform for displaying and analyzing spatial data. GIS systems allow you to view multiple layers of data simultaneously. GIS is
GIS = Geographic Information Systems;
 What is GIS GIS = Geographic Information Systems; What Information are we talking about? Information about anything that has a place (e.g. locations of features, address of people) on Earth s surface,
An Information Model for Maps: Towards Cartographic Production from GIS Databases
 An Information Model for s: Towards Cartographic Production from GIS Databases Aileen Buckley, Ph.D. and Charlie Frye Senior Cartographic Researchers, ESRI Barbara Buttenfield, Ph.D. Professor, University
APC PART I WORKSHOP MAPPING AND CARTOGRAPHY
 APC PART I WORKSHOP MAPPING AND CARTOGRAPHY 5 June 2015 MAPPING The act or process of making a map. A matching process where the points of one set are matched against the points of another set. Graphical
Laboratory Exercise X Most Dangerous Places to Live in the United States Based on Natural Disasters
 Brigham Young University BYU ScholarsArchive Engineering Applications of GIS - Laboratory Exercises Civil and Environmental Engineering 2016 Laboratory Exercise X Most Dangerous Places to Live in the United
Task 1: Open ArcMap and activate the Spatial Analyst extension.
 Exercise 10 Spatial Analyst The following steps describe the general process that you will follow to complete the exercise. Specific steps will be provided later in the step-by-step instructions component
DATA SOURCES AND INPUT IN GIS. By Prof. A. Balasubramanian Centre for Advanced Studies in Earth Science, University of Mysore, Mysore
 DATA SOURCES AND INPUT IN GIS By Prof. A. Balasubramanian Centre for Advanced Studies in Earth Science, University of Mysore, Mysore 1 1. GIS stands for 'Geographic Information System'. It is a computer-based
INTRODUCTION TO GEOGRAPHIC INFORMATION SYSTEM By Reshma H. Patil
 INTRODUCTION TO GEOGRAPHIC INFORMATION SYSTEM By Reshma H. Patil ABSTRACT:- The geographical information system (GIS) is Computer system for capturing, storing, querying analyzing, and displaying geospatial
Classification Exercise UCSB July 2006
 Classification Exercise UCSB July 2006 Purpose This exercise will examine how spatial data is catergorized and the advantages and disadvantages of different classification methods. Terms to know Population,
Introduction INTRODUCTION TO GIS GIS - GIS GIS 1/12/2015. New York Association of Professional Land Surveyors January 22, 2015
 New York Association of Professional Land Surveyors January 22, 2015 INTRODUCTION TO GIS Introduction GIS - GIS GIS 1 2 What is a GIS Geographic of or relating to geography the study of the physical features
MODULE 12: MAPPING. Key Concepts: Maps for Master Plans
 MODULE 12: MAPPING 237 237 237 217 217 217 200 200 200 80 119 27 Key Concepts: 255 0 163 131 239 110 Maps for Master Plans 255 0 163 132 65 135 255 0 163 122 53 120 Cost Effective Data and Software Map
Applied Cartography and Introduction to GIS GEOG 2017 EL. Lecture-2 Chapters 3 and 4
 Applied Cartography and Introduction to GIS GEOG 2017 EL Lecture-2 Chapters 3 and 4 Vector Data Modeling To prepare spatial data for computer processing: Use x,y coordinates to represent spatial features
Chapter 5. Presenting Data
 Chapter 5. Presenting Data Copyright McGraw-Hill Education. Permission required for reproduction or display. 5-1 Basic principles of map design 5-2 1 Map Design Process 5-3 The map objective The first
Theory, Concepts and Terminology
 GIS Workshop: Theory, Concepts and Terminology 1 Theory, Concepts and Terminology Suggestion: Have Maptitude with a map open on computer so that we can refer to it for specific menu and interface items.
Lab 4 -Vector data and Attributes
 Lab 4 -Vector data and Attributes ERSC/BIOL 4421/5421 Name In this lab you will learn how to create your own vector data by collecting point data from GPS coordinates and by digitizing lines using an Aerial
Charlene Nielsen, MSc.
 GIS Project Issues Charlene Nielsen, MSc charlene.nielsen@ualberta.ca 492-93979397 B414 BioSci Building www.biology.ualberta.ca/facilities/gis Introduction to GIS in Ecology What a GIS is not What is a
Geographic Systems and Analysis
 Geographic Systems and Analysis New York University Robert F. Wagner Graduate School of Public Service Instructor Stephanie Rosoff Contact: stephanie.rosoff@nyu.edu Office hours: Mondays by appointment
Geographical Information Systems
 Geographical Information Systems Geographical Information Systems (GIS) is a relatively new technology that is now prominent in the ecological sciences. This tool allows users to map geographic features
EnvSci 360 Computer and Analytical Cartography
 EnvSci 360 Computer and Analytical Cartography Lecture 7 Mapping Images, Surfaces, and 3-D Data Brief Overview of Imagery What is Imagery? A spatial data model that defines space as an array of equally
The data for this lab comes from McDonald Forest. We will be working with spatial data representing the forest boundary, streams, roads, and stands.
 GIS LAB 6 Using the Projection Utility. Converting Data to Oregon s Approved Lambert Projection. Determining Stand Size, Stand Types, Road Length, and Stream Length. This lab will ask you to work with
ENV208/ENV508 Applied GIS. Week 2: Making maps, data visualisation, and GIS output
 ENV208/ENV508 Applied GIS Week 2: Making maps, data visualisation, and GIS output Overview GIS Output Map Making Types of Maps Key Elements GIS Output Formats Table Graph Statistics Maps Map Making Maps
Task 1: Start ArcMap and add the county boundary data from your downloaded dataset to the data frame.
 Exercise 6 Coordinate Systems and Map Projections The following steps describe the general process that you will follow to complete the exercise. Specific steps will be provided later in the step-by-step
Overview. GIS Data Output Methods
 Overview GIS Output Formats ENV208/ENV508 Applied GIS Week 2: Making maps, data visualisation, and GIS output GIS Output Map Making Types of Maps Key Elements Table Graph Statistics Maps Map Making Maps
TRCA_Jurisdiction. File Geodatabase Feature Class. Tags watersheds, boundary, trca
 Page 1 of 7 TRCA_Jurisdiction File Geodatabase Feature Class Tags watersheds, boundary, trca Summary Delineate TRCAs' administrative boundary as well as boundaries of watersheds within the jurisdiction
Chapter 5. GIS The Global Information System
 Chapter 5 GIS The Global Information System What is GIS? We have just discussed GPS a simple three letter acronym for a fairly sophisticated technique to locate a persons or objects position on the Earth
APC Part I Workshop. Mapping and Cartography. 14 November 2014
 APC Part I Workshop Mapping and Cartography 14 November 2014 Cartography Cartography is the discipline dealing with the conception, production, dissemination and study of maps in all forms (ICA) A holistic
caused displacement of ocean water resulting in a massive tsunami. II. Purpose
 I. Introduction The Great Sumatra Earthquake event took place on December 26, 2004, and was one of the most notable and devastating natural disasters of the decade. The event consisted of a major initial
Cartography and Geovisualization. Chapters 12 and 13 of your textbook
 Cartography and Geovisualization Chapters 12 and 13 of your textbook Why cartography? Maps are the principle means of displaying spatial data Exploration: visualization, leading to conceptualization of
Digital Systems Roberto Muscedere Images 2013 Pearson Education Inc. 1
 Digital Systems Digital systems have such a prominent role in everyday life The digital age The technology around us is ubiquitous, that is we don t even notice it anymore Digital systems are used in:
Spatial Analysis using Vector GIS THE GOAL: PREPARATION:
 PLAN 512 GIS FOR PLANNERS Department of Urban and Environmental Planning University of Virginia Fall 2006 Prof. David L. Phillips Spatial Analysis using Vector GIS THE GOAL: This tutorial explores some
GIS Data Structure: Raster vs. Vector RS & GIS XXIII
 Subject Paper No and Title Module No and Title Module Tag Geology Remote Sensing and GIS GIS Data Structure: Raster vs. Vector RS & GIS XXIII Principal Investigator Co-Principal Investigator Co-Principal
Laboratory Exercise - Temple-View Least- Cost Mountain Bike Trail
 Brigham Young University BYU ScholarsArchive Engineering Applications of GIS - Laboratory Exercises Civil and Environmental Engineering 2017 Laboratory Exercise - Temple-View Least- Cost Mountain Bike
Learning ArcGIS: Introduction to ArcCatalog 10.1
 Learning ArcGIS: Introduction to ArcCatalog 10.1 Estimated Time: 1 Hour Information systems help us to manage what we know by making it easier to organize, access, manipulate, and apply knowledge to the
Desktop GIS for Geotechnical Engineering
 Desktop GIS for Geotechnical Engineering Satya Priya Deputy General Manager (Software) RMSI, A-7, Sector 16 NOIDA 201 301, UP, INDIA Tel: +91-120-2511102 Fax: +91-120-2510963 Email: Satya.Priya@rmsi.com
SCHOOL OF ENGINEERING AND TECHNOLOGY COMPUTER LAB
 PHASE 1_6 TH SESSION ARCGIS TRAINING AT KU GIS LABS: INTRODUCTION TO GIS: EXPLORING ARCCATALOG AND ARCGIS TOOLS 6 TH SESSION REPORT: 3 RD -5 TH SEPTEMBER 2014 SCHOOL OF ENGINEERING AND TECHNOLOGY COMPUTER
NR402 GIS Applications in Natural Resources
 NR402 GIS Applications in Natural Resources Lesson 1 Introduction to GIS Eva Strand, University of Idaho Map of the Pacific Northwest from http://www.or.blm.gov/gis/ Welcome to NR402 GIS Applications in
Designing GIS Databases to Support Mapping and Map Production Charlie Frye, ESRI Redlands Aileen Buckley, ESRI Redlands
 Designing GIS Databases to Support Mapping and Map Production Charlie Frye, ESRI Redlands Aileen Buckley, ESRI Redlands 1 Designing GIS Databases to Support Mapping and Map Production Charlie Frye, ESRI
Geodatabase An Overview
 Federal GIS Conference February 9 10, 2015 Washington, DC Geodatabase An Overview Ralph Denkenberger - esri Session Path The Geodatabase - What is it? - Why use it? - What types are there? Inside the Geodatabase
GTECH 380/722 Analytical and Computer Cartography Hunter College, CUNY Department of Geography
 GTECH 380/722 Analytical and Computer Cartography Hunter College, CUNY Department of Geography Fall 2011 Mondays 5:35PM to 9:15PM Instructor: Doug Williamson, PhD Email: Douglas.Williamson@hunter.cuny.edu
Geography 38/42:376 GIS II. Topic 1: Spatial Data Representation and an Introduction to Geodatabases. The Nature of Geographic Data
 Geography 38/42:376 GIS II Topic 1: Spatial Data Representation and an Introduction to Geodatabases Chapters 3 & 4: Chang (Chapter 4: DeMers) The Nature of Geographic Data Features or phenomena occur as
Representation of Geographic Data
 GIS 5210 Week 2 The Nature of Spatial Variation Three principles of the nature of spatial variation: proximity effects are key to understanding spatial variation issues of geographic scale and level of
Diamonds on the soles of scholarship?
 Educational Performance and Family Income Diamonds on the soles of scholarship? by Introduction Problem Two young girls entering elementary school in Boston aspire to be doctors. Both come from twoparent,
The Choropleth Map Slide #2: Choropleth mapping enumeration units
 The Choropleth Map Slide #2: Choropleth mapping is a common technique for representing enumeration data These are maps where enumeration units, such as states or countries, are shaded a particular color
Trail Flow: Analysis of Drainage Patterns Affecting a Mountain Bike Trail
 Andy Belcher BAE 590 Professor Huffman 12.9.11 Location Trail Flow: Analysis of Drainage Patterns Affecting a Mountain Bike Trail The location of the project area rests in the Cary area of Wake County,
Visual Studies Exercise, Assignment 07 (Architectural Paleontology) Geographic Information Systems (GIS), Part II
 Geographic Information Systems (GIS), Part II") ARCH1291 Visual Studies II Week 8, Spring 2013 Assignment 7 GIS I Prof. Alihan Polat Visual Studies Exercise, Assignment 07 (Architectural Paleontology) Geographic Information Systems (GIS), Part II Medium:
ARCH1291 Visual Studies II Week 8, Spring 2013 Assignment 7 GIS I Prof. Alihan Polat Visual Studies Exercise, Assignment 07 (Architectural Paleontology) Geographic Information Systems (GIS), Part II Medium:
Performing Advanced Cartography with Esri Production Mapping
 Esri International User Conference San Diego, California Technical Workshops July 25, 2012 Performing Advanced Cartography with Esri Production Mapping Tania Pal & Madhura Phaterpekar Agenda Outline generic
Subwatersheds File Geodatabase Feature Class
 Subwatersheds File Geodatabase Feature Class Tags subwatersheds, watersheds Summary shows the subwatersheds of the 9 watersheds in TRCA's jurisdiction Description sub watershed boundaries in TRCA jurisdiction.
Census Mapping with ArcGIS
 Census Mapping with ArcGIS Jin Lee, GIS manager at the Lewis Mumford Center and Center for Social and Demographic Analysis Email: jwlee@albany.edu Phone: 442-5402 Quick summary of Day1 http://csda.albany.edu/events-news/gisworkshop_outline_fall_3-1.pdf
Geog183: Cartographic Design and Geovisualization Winter Quarter 2017 Lecture 6: Map types and Data types
 Geog183: Cartographic Design and Geovisualization Winter Quarter 2017 Lecture 6: Map types and Data types Data types Data dimension: Point, Line, Area, Volume (Text) Data continuity: Discrete, Point, Polygon:
The Elements of GIS. Organizing Data and Information. The GIS Database. MAP and ATRIBUTE INFORMATION
 GIS s Roots in Cartography Getting Started With GIS Chapter 2 Dursun Z. Seker MAP and ATRIBUTE INFORMATION Data (numbers and text) store as files refer to them collectively as a database gather inform.
How not to give a poster: Some suggestions based on years of experience. D. Lund (credit to J. Granger)
") How not to give a poster: Some suggestions based on years of experience D. Lund (credit to J. Granger) Purpose of a Poster Summarize research concisely and attractively Help publicize it and generate discussion
How not to give a poster: Some suggestions based on years of experience D. Lund (credit to J. Granger) Purpose of a Poster Summarize research concisely and attractively Help publicize it and generate discussion
Lauren Jacob May 6, Tectonics of the Northern Menderes Massif: The Simav Detachment and its relationship to three granite plutons
 Lauren Jacob May 6, 2010 Tectonics of the Northern Menderes Massif: The Simav Detachment and its relationship to three granite plutons I. Introduction: Purpose: While reading through the literature regarding
Land Cover Data Processing Land cover data source Description and documentation Download Use Use
 Land Cover Data Processing This document provides a step by step procedure on how to build the land cover data required by EnSim. The steps provided here my be long and there may be short cuts (like using
In this exercise we will learn how to use the analysis tools in ArcGIS with vector and raster data to further examine potential building sites.
 GIS Level 2 In the Introduction to GIS workshop we filtered data and visually examined it to determine where to potentially build a new mixed use facility. In order to get a low interest loan, the building
Tutorial 8 Raster Data Analysis
 Objectives Tutorial 8 Raster Data Analysis This tutorial is designed to introduce you to a basic set of raster-based analyses including: 1. Displaying Digital Elevation Model (DEM) 2. Slope calculations
Geodatabase An Introduction
 Federal GIS Conference 2014 February 10 11, 2014 Washington DC Geodatabase An Introduction Ralph Denkenberger esri Session Path The Geodatabase - What is it? - Why use it? - What types are there? Inside
Import Digital Spatial Data (Shapefiles) into OneStop
 into OneStop") Import Digital Spatial Data (Shapefiles) into OneStop» Intended User: Pipeline Licence Applicants Overview To apply for a pipeline or pipeline installation licence, applicants must upload the proposed
Import Digital Spatial Data (Shapefiles) into OneStop» Intended User: Pipeline Licence Applicants Overview To apply for a pipeline or pipeline installation licence, applicants must upload the proposed
This week s topics. Week 6. FE 257. GIS and Forest Engineering Applications. Week 6
 FE 257. GIS and Forest Engineering Applications Week 6 Week 6 Last week Chapter 8 Combining and splitting landscape features and merging GIS databases Chapter 11 Overlay processes Questions? Next week
Geography 360 Principles of Cartography. April 17, 2006
 Geography 360 Principles of Cartography April 17, 2006 Outlines Cartographic design principles Enhancing visual hierarchies on maps Kinds of numerical data and color scheme What is proportional symbol
Aileen Buckley, Ph.D. and Charlie Frye
 An Information Model for Maps: Towards Production from GIS Databases Aileen Buckley, Ph.D. and Charlie Frye Researchers, ESRI GIS vs. cart GIS Outline of the presentation Introduction Differences between
Outline. Chapter 1. A history of products. What is ArcGIS? What is GIS? Some GIS applications Introducing the ArcGIS products How does GIS work?
 Outline Chapter 1 Introducing ArcGIS What is GIS? Some GIS applications Introducing the ArcGIS products How does GIS work? Basic data formats The ArcCatalog interface 1-1 1-2 A history of products Arc/Info
Exercise 4 Estimating the effects of sea level rise on coastlines by reclassification
 Exercise 4 Estimating the effects of sea level rise on coastlines by reclassification Due: Thursday February 1; at the start of class Goal: Get familiar with symbolizing and making time-series maps of
DISCRETE RANDOM VARIABLES EXCEL LAB #3
 DISCRETE RANDOM VARIABLES EXCEL LAB #3 ECON/BUSN 180: Quantitative Methods for Economics and Business Department of Economics and Business Lake Forest College Lake Forest, IL 60045 Copyright, 2011 Overview
Data Structures & Database Queries in GIS
 Data Structures & Database Queries in GIS Objective In this lab we will show you how to use ArcGIS for analysis of digital elevation models (DEM s), in relationship to Rocky Mountain bighorn sheep (Ovis
MERGING (MERGE / MOSAIC) GEOSPATIAL DATA
 GEOSPATIAL DATA") This help guide describes how to merge two or more feature classes (vector) or rasters into one single feature class or raster dataset. The Merge Tool The Merge Tool combines input features from input
This help guide describes how to merge two or more feature classes (vector) or rasters into one single feature class or raster dataset. The Merge Tool The Merge Tool combines input features from input