MAKING MAPS Cartographic Design & Principles Winter 2018
|
|
|
- Evelyn Chandler
- 6 years ago
- Views:
Transcription

1 MAKING MAPS Cartographic Design & Principles Winter 2018
2 Cartography the art, science, and technology of making maps, together with their study as scientific documents and works of art - The International Cartographic Association
3 Far from being an antique craft belonging to a bygone era, cartography is the art of geovisualization; a way of sharing spatial knowledge and empowering people through the application of good design, whether the medium is electronic or paper, permanent or perishable, static or dynamic - Alexander J Kent, Bulletin of the Society of Cartographers (2008)
4 The Cartographic Process


5 The Cartographic Process Purpose Topic Format Audience Collection Synthesis Analysis Layout Medium Monitor Projector Paper Design Design Content accuracy
6 Making maps is hard!
7 What is the PURPOSE of the map?
8 Who is the AUDIENCE?
9 What is the best way to REPRESENT the data?
10 Is all NECESSARY data included? Is all the UNNECESSARY data excluded?
11 How will the map be VIEWED?
12 Map data is also complex!
13 Is it qualitative or quantitative?
14 Are there any copyright issues with the data?
15 Are the symbols appropriate?
16 Has the data been properly analyzed?
17 Does the data serve the purpose of the map?
18 Is the data too generalized or complex?
19 Then there s the map DESIGN!
20 So many things to consider. Title & subtitle Map scale Legend How many data frames? Color Balance & layout Symbols Map Projection And so on
21 Core Cartographic Principles For designing maps people want to look at
22 Visual hierarchy [map design] the presentation of features on a map in a way that implies relative importance, usually achieved with visual contrast (GIS Dictionary)
23
24
25
26

27 Visual contrast How map features & page elements contrast each other and their background
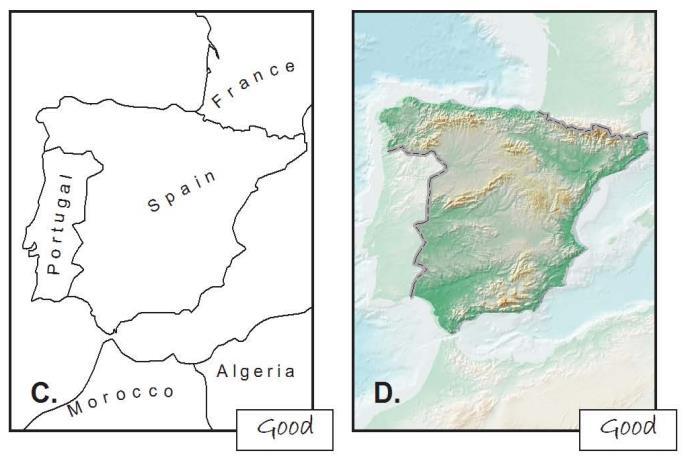
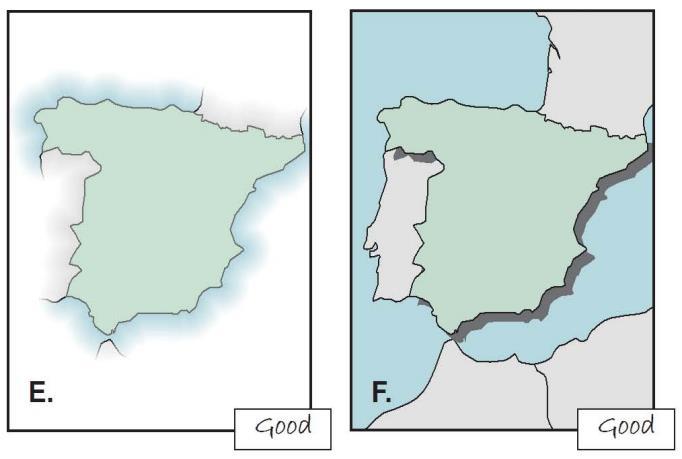
28 Visual contrast If you only use one line weight, one font size, and one font there is no contrast and the map is hard to read
29
30

31 Legibility The ability to be see and understand the map
32 Legibility 1. Emphasize important elements 2. Eliminate anything that does not enhance the message of the map
33
34

35 Figure-ground Easily distinguish between the main figure on the map and the background
36

37
38

39 Balance Organization of the map and other elements on the page layout

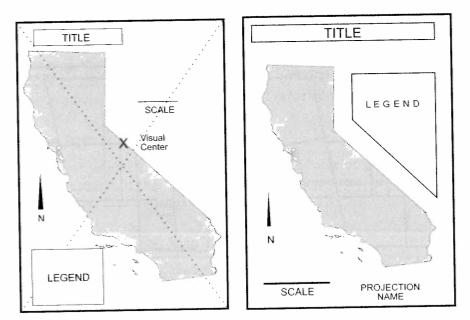
40 Balance Every element of a map has visual weight, which should be evenly distributed around the visual center of the page
41 Balance

42
43 Balance- visual weights Centrally located elements have less weight than those to one side Objects in the upper half appear heavier than those in the lower half Objects on the right side appear heavier than those on the left side Weight appears to increase with increasing distance from the center Isolated elements have more weight than grouped elements Larger elements have greater visual weight Red is heavier than blue Bright colors are heavier than dark Regular shapes seem heavier than irregular shapes Compact shapes have more visual weight than unordered, diffuse shapes Forms with a vertical orientation seem heavier than oblique forms - Arnheim, 1969
44 Balance White space is any area within the map frame not taken by the map 1. Certain amount of white space is required 2. Put the largest map possible on the page while still leaving room for other elements
45

46
47
48

49 Unity & Harmony The map appears to be a single unit, with an overall pleasing appearance it s a map that people want to look at
50 Finding creative inspiration You can be creative
51 Every great advance in science has issued from a new audacity of the imagination John Dewey, philosopher
52 Make lots of maps Explore new tools & try new techniques Do other creative things Take an art class Carry a sketch book to record what you see Draw a cartoon for a child
53 Look at lots of maps Actively & deliberately observe and absorb the imaginative creations of others Look at maps or an atlas View all types of art, regularly Museums, gardens, architecture, design magazines/books
54 Inspiration Flowing Data, Axis Maps, Making Maps: DIY Cartography, FOSS4G Map Gallery
55 Inspiration A Cartographer s Toolkit, Visual.ly Geography Infographics, Cartotalk, ESRI Mapping Blog,
56 Inspiration Edward Tufte data visualization Map as Art (Katharine Harmon)
Map image from the Atlas of Oregon (2nd. Ed.), Copyright 2001 University of Oregon Press
, Copyright 2001 University of Oregon Press") Map Layout and Cartographic Design with ArcGIS Desktop Matthew Baker ESRI Educational Services Redlands, CA Education UC 2008 1 Seminar overview General map design principles Working with map elements
Map Layout and Cartographic Design with ArcGIS Desktop Matthew Baker ESRI Educational Services Redlands, CA Education UC 2008 1 Seminar overview General map design principles Working with map elements
MAP SCALE, ELEMENTS & USE
 MAP SCALE, ELEMENTS & USE Maps & Geospatial Concepts Fall 2015 What cartographic elements affect a map? Scale Elements Layout Data Representation Data Accuracy & Misuse Scale Scale http://micro.magnet.fsu.edu/primer/java/scienceop
Cartography and Geovisualization. Chapters 12 and 13 of your textbook
 Cartography and Geovisualization Chapters 12 and 13 of your textbook Why cartography? Maps are the principle means of displaying spatial data Exploration: visualization, leading to conceptualization of
Intro to GIS Summer 2012 Data Visualization
 Intro to GIS Summer 2012 Data Visualization UNDERSTANDING YOUR MAP DATA Qualitative vs. Quantitative Data Qualitative Data classified by category e.g. Soil types, Animal Species Quantitative Data grouped
Basic principles of cartographic design. Makram Murad-al-shaikh M.S. Cartography Esri education delivery team
 Basic principles of cartographic design Makram Murad-al-shaikh M.S. Cartography Esri education delivery team Cartographic concepts Cartography defined The communication channel - Why maps fail Objectives
An Information Model for Maps: Towards Cartographic Production from GIS Databases
 An Information Model for s: Towards Cartographic Production from GIS Databases Aileen Buckley, Ph.D. and Charlie Frye Senior Cartographic Researchers, ESRI Barbara Buttenfield, Ph.D. Professor, University
CHAPTER 9 DATA DISPLAY AND CARTOGRAPHY
 CHAPTER 9 DATA DISPLAY AND CARTOGRAPHY 9.1 Cartographic Representation 9.1.1 Spatial Features and Map Symbols 9.1.2 Use of Color 9.1.3 Data Classification 9.1.4 Generalization Box 9.1 Representations 9.2
GTECH 380/722 Analytical and Computer Cartography Hunter College, CUNY Department of Geography
 GTECH 380/722 Analytical and Computer Cartography Hunter College, CUNY Department of Geography Fall 2014 Mondays 5:35PM to 9:15PM Instructor: Doug Williamson, PhD Email: Douglas.Williamson@hunter.cuny.edu
Physical Geography Lab Activity #15
 Physical Geography Lab Activity #15 Due date Name Choropleth Maps COR Objective 1 & 7, SLOs 1 & 3 15.1. Introduction Up until this point we have used maps to find locations on the Earth. While they are
Esri Production Mapping: Map Automation & Advanced Cartography MADHURA PHATERPEKAR JOE SHEFFIELD
 Esri Production Mapping: Map Automation & Advanced Cartography MADHURA PHATERPEKAR JOE SHEFFIELD Traditional Cartography What you really want Cartographic Workflow Output Cartographic Data Symbology Layout
GEOREFERENCING, PROJECTIONS Part I. PRESENTING DATA Part II
 Week 7 GEOREFERENCING, PROJECTIONS Part I PRESENTING DATA Part II topics of the week Georeferencing Coordinate systems Map Projections ArcMap and Projections Geo-referencing Geo-referencing is the process
Spatial Representation
 Spatial Representation Visual Culture LCC6311 Tony F. Lockhart 12/9/2009 Page 2 of 5 Table of Contents Introduction... 3 Grid Layout... 3 Public School Funding Visualization... 3 Inspiration... 4 Works
Periodic Table Project Element Card Sketches
 Kensington Woods High School Name: Chemistry/Art Periodic Table Project Element Card Sketches In this project, we will use graphic design skills to redesign the periodic table. You are challenged with
Student Name: Module 1: Elements of Art and Principles of Design Study Guide
 Before attempting the Module Exam, you should be familiar with the concepts below. Use your notes from each lesson to help you complete this self check worksheet. Review any lessons where you feel a lack
Map Makeovers: How to Make Your Map Great!
 Esri International User Conference San Diego, CA Technical Workshops Map Makeovers: How to Make Your Map Great! Charlie Frye, Esri, Redlands, Jim Herries, Esri, Redlands Session Goals Demonstrate cartographic
0 Maps are the principle means of displaying spatial data
 Why cartography? 0 Maps are the principle means of displaying spatial data 0 Exploration: visualization, leading to conceptualization of patterns and processes. (Chap 13) 0 Communication: convey information
Problems and Challenges
 2018 Esri Petroleum GIS Conference Problems and Challenges May 9 10, 2018 Houston, Texas George R. Brown Convention Center Disunity of drawing standards and format Large amount of work in Cartography,
GTECH 380/722 Analytical and Computer Cartography Hunter College, CUNY Department of Geography
 GTECH 380/722 Analytical and Computer Cartography Hunter College, CUNY Department of Geography Fall 2011 Mondays 5:35PM to 9:15PM Instructor: Doug Williamson, PhD Email: Douglas.Williamson@hunter.cuny.edu
How not to give a poster: Some suggestions based on years of experience. D. Lund (credit to J. Granger)
") How not to give a poster: Some suggestions based on years of experience D. Lund (credit to J. Granger) Purpose of a Poster Summarize research concisely and attractively Help publicize it and generate discussion
How not to give a poster: Some suggestions based on years of experience D. Lund (credit to J. Granger) Purpose of a Poster Summarize research concisely and attractively Help publicize it and generate discussion
Esri International User Conference 2015 Navigating Preconceptions to Create Better Maps
 Navigating Preconceptions to Create Better Maps Interdisciplinary Collaboration to Improve Cartography Kristin N. Hart Mapping and Spatial Services Group Lead / Senior GIS Specialist Bachelors in Geography,
Problem: Your paper doesn t fit on a 3x4 foot posterboard.
 Problem: Your paper doesn t fit on a 3x4 foot posterboard. Basics of Research Poster Design Nikki Dudley, The University of Iowa Digital Studio for Public Arts and Humanities Adapted by Bridget Draxler,
Long Term Topic Planner - Year Six Term One Were the Vikings Always Victorious and Vicious Knowledge, Skills and Understanding
 Long Term Topic Planner - Year Six Topic Name Term One Were the Vikings Always Victorious and Vicious History Art I can say where a period of history fits on a timeline? I can place a specific event on
9/7/ Studying Geography: Introduction to Mapping. Cartographic Terms. Cartographic Terms. Geographers Tools. Geographers Needs.
 Geographers Tools Studying Geography: Introduction to Mapping Prof. Anthony Grande Hunter College Geography Lecture design, content and presentation AFG0918. Individual images and illustrations may be
Topic: Fundamentals of Topographic Map (Cartographic Technique) Honors
 Honors") SN Kansagra School Master lesson Plan : Geography Subject Teacher :- Sanjay Nath Topic: Fundamentals of Topographic Map (Cartographic Technique) Honors Materials (Teaching Aids): White board, Audio visual
SN Kansagra School Master lesson Plan : Geography Subject Teacher :- Sanjay Nath Topic: Fundamentals of Topographic Map (Cartographic Technique) Honors Materials (Teaching Aids): White board, Audio visual
Snowden Cartography 1 GEOG 315:001 Cartography Thursdays 4:00 6:30PM F375 Fall 2010 Dr. Snowden Course Description
 Snowden Cartography 1 www.drksnowden.com GEOG 315:001 Cartography Thursdays 4:00 6:30PM F375 Fall 2010 Dr. Snowden Course Description Principles and theory of basic map design, layout, and communication.
Revive, Contemplate, and Integrate Lesson Plan. Your Name: Amanda Pellerin, Amanda Kodeck, and Pat Cruz Grade: 7
 Revive, Contemplate, and Integrate Lesson Plan Your Name: Amanda Pellerin, Amanda Kodeck, and Pat Cruz Grade: 7 Unit of Study: Social Studies/ Visual Arts Lesson Title: Modern Day Maps Goal/Purpose: Students
EnvSci360 Computer and Analytical Cartography
 EnvSci360 Computer and Analytical Cartography Lecture 11 Bias in Mapping Introduction Not only is it easy to lie with maps, it's essential. First sentence in How to Lie with Mapsby Mark Monmonier EnvSci
Geography 128 Winter Quarter Lecture 5: What is Analytical Cartography?
 Geography 128 Winter Quarter 2017 Lecture 5: What is Analytical Cartography? What is Cartography? Cartography - the science, technology and art of making maps. Matthew Hampton, 2007, A Mosaic of Space,
Expanding Canada s Rail Network to Meet the Challenges of the Future
 Expanding Canada s Rail Network to Meet the Challenges of the Future Lesson Overview Rail may become a more popular mode of transportation in the future due to increased population, higher energy costs,
Agenda. Introduction Exercise 1 Map Types. Part 1 ArcGIS Information and Organization Part 2 Purpose, Audience & Constraints.
 Agenda Introduction Exercise 1 Map Types Part 1 ArcGIS Information and Organization Part 2 Purpose, Audience & Constraints Exercise 2 Map Critique Break Part 3 Basic Cartographic Design Principles Part
Observe Reflect Question What type of document is this?
 Appendix 2 An Empty Primary Source Analysis Tool and a Full Primary Source Analysis Tool with Guiding Questions Observe Reflect Question What type of document is this? What is the purpose of this document?
Local Government Basemaps using ArcGIS
 Local Government Basemaps using ArcGIS Steve Grisé Scott Oppmann Tuesday, July 14, 10:15-11:30am SDCC 30B Topics Basemaps for Local Government Essential Application-Driven New Ideas Design Strategies Discussion
Your web browser (Safari 7) is out of date. For more security, comfort and. the best experience on this site: Update your browser Ignore
 is out of date. For more security, comfort and. the best experience on this site: Update your browser Ignore") Your web browser (Safari 7) is out of date. For more security, comfort and Activitydevelop the best experience on this site: Update your browser Ignore Places in the Park Why do we use symbols? Overview
Your web browser (Safari 7) is out of date. For more security, comfort and Activitydevelop the best experience on this site: Update your browser Ignore Places in the Park Why do we use symbols? Overview
Overview. GIS Data Output Methods
 Overview GIS Output Formats ENV208/ENV508 Applied GIS Week 2: Making maps, data visualisation, and GIS output GIS Output Map Making Types of Maps Key Elements Table Graph Statistics Maps Map Making Maps
ENV208/ENV508 Applied GIS. Week 2: Making maps, data visualisation, and GIS output
 ENV208/ENV508 Applied GIS Week 2: Making maps, data visualisation, and GIS output Overview GIS Output Map Making Types of Maps Key Elements GIS Output Formats Table Graph Statistics Maps Map Making Maps
Mapping the most and the least
 Mapping the most and the least Why do you make a map To communicate information at a glance To explore the data to see what patterns and retionships you can find To develop hypothesis (will be topic of
Studying Geography: Tools of the Trade
 GEOG 101 TUTORING AVAILABLE Free tutoring is available to all GEOG 101 students by experienced teachers. No appointment is necessary. Walk in/walk out sessions. Bring your notes, textbook, handouts, and
Creating an Illustrated Map: New Zealand
 S T U D E N T H A N D O U T A Creating an Illustrated Map: New Zealand You will work in a group of four to create an illustrated map of one type of Pacific island: a continental island. Your illustrated
(3) The student develops and formulates ideas from the environment. The student is expected to:
 The student develops and formulates ideas from the environment. The student is expected to:") Chapter 3 Art in Floral Design The following TEKS will be addressed in this chapter: (3) The student develops and formulates ideas from the environment. The student is expected to: (A) illustrate ideas
Chapter 3 Art in Floral Design The following TEKS will be addressed in this chapter: (3) The student develops and formulates ideas from the environment. The student is expected to: (A) illustrate ideas
4 Studying Geography:
 4 Studying Geography: Introduction to Mapping Prof. Anthony Grande Hunter College Geography Lecture design, content and presentation AFG0119 Individual images and illustrations may be subject to prior
ArcGIS for Desktop. ArcGIS for Desktop is the primary authoring tool for the ArcGIS platform.
 ArcGIS for Desktop ArcGIS for Desktop ArcGIS for Desktop is the primary authoring tool for the ArcGIS platform. Beyond showing your data as points on a map, ArcGIS for Desktop gives you the power to manage
Performing Advanced Cartography with Esri Production Mapping
 Esri International User Conference San Diego, California Technical Workshops July 25, 2012 Performing Advanced Cartography with Esri Production Mapping Tania Pal & Madhura Phaterpekar Agenda Outline generic
Performing Map Cartography. using Esri Production Mapping
 AGENDA Performing Map Cartography Presentation Title using Esri Production Mapping Name of Speaker Company Name Kannan Jayaraman Agenda Introduction What s New in ArcGIS 10.1 ESRI Production Mapping Mapping
Book: Spare Parts by Joshua Davis (ISBN: )
") 1 AP Human Geography Summer Reading 2017-2018 Study Guide Book: Spare Parts by Joshua Davis (ISBN: 978-0-374-53498-1) IMPORTANT: Read the entire study guide before you read the book. Introduction: Welcome
1 AP Human Geography Summer Reading 2017-2018 Study Guide Book: Spare Parts by Joshua Davis (ISBN: 978-0-374-53498-1) IMPORTANT: Read the entire study guide before you read the book. Introduction: Welcome
Esri Defense Mapping: Cartographic Production. Bo King
 Esri Defense Mapping: Cartographic Production Bo King Agenda Esri Defense Mapping: Cartographic Production Solution Overview Desktop Cartographic Production Workflow - Create Rapid Graphic Product On Demand
Chapter 5. Presenting Data
 Chapter 5. Presenting Data Copyright McGraw-Hill Education. Permission required for reproduction or display. 5-1 Basic principles of map design 5-2 1 Map Design Process 5-3 The map objective The first
ESS. Area of Experience: Environmental and Social Studies. At Junior Certificate level the student can:
 Area of Experience: Environmental and Social Studies 1 Examining the Past Describe the principal methods of examining the past and apply these to three different eras of history: Pre-Christian Ireland
Welcome to Geography 107 Introduction to Human Geography
 Welcome to Geography 107 Introduction to Human Geography Dr. Steve Graves California State University, Northridge Are you here today? Get out your clickers and we ll test the system. This is how attendance
Geography 281 Map Making with GIS Project Four: Comparing Classification Methods
 Geography 281 Map Making with GIS Project Four: Comparing Classification Methods Thematic maps commonly deal with either of two kinds of data: Qualitative Data showing differences in kind or type (e.g.,
Introduction to Human Geography & Geographic Concepts
 Introduction to Human Geography & Geographic Concepts What is Geography? Literal definition: Description of the Earth Serves as a bridge between physical and human sciences the study of the earth and its
Geo-Visualization. GRS09/10 Ron van Lammeren
 Geo-Visualization GRS09/10 Ron van Lammeren 2/30 Theory Semiologie Graphique http://www.flickr.com/photos/kbean/491051226/ 3/30 How to present my geo data? Visualization definitions Map making Cartographic
Year 8 standard elaborations Australian Curriculum: Geography
 Purpose Structure The standard elaborations (SEs) provide additional clarity when using the Australian Curriculum achievement standard to make judgments on a five-point scale. These can be used as a tool
Geo-Visualization. GRS1011 Ron van Lammeren
 Geo-Visualization GRS1011 Ron van Lammeren Theory Semiologie Graphique http://www.flickr.com/photos/kbean/491051226/ 2/30 How to present my geo data? Visualization definitions Map making Cartographic process
Slope Fields and Differential Equations. Copyright Cengage Learning. All rights reserved.
 Slope Fields and Differential Equations Copyright Cengage Learning. All rights reserved. Objectives Review verifying solutions to differential equations. Review solving differential equations. Review using
Today we begin the first technical topic related directly to the course that is: Equilibrium Carrier Concentration.
 Solid State Devices Dr. S. Karmalkar Department of Electronics and Communication Engineering Indian Institute of Technology, Madras Lecture - 3 Equilibrium and Carrier Concentration Today we begin the
Maps and sustainability
 Maps and sustainability The International Map Year [ mapyear.org ] Menno-Jan Kraak Maps Cartography and maps A map is a visual representation of an environment maps tell stories maps invite maps show patterns
GIS PORTFOLIO MOHAMED MAGDY MOHAMED HUSSAIN GIS ENGINEER. UWF GIS ONLINE CERTIFICATE GIS Internship (GIS4944)
") 2012 GIS PORTFOLIO MOHAMED MAGDY MOHAMED HUSSAIN GIS ENGINEER UWF GIS ONLINE CERTIFICATE GIS Internship (GIS4944) Portfolio Table of Contents Subject... Page Personal statement/mission/philosophy... 1
2012 GIS PORTFOLIO MOHAMED MAGDY MOHAMED HUSSAIN GIS ENGINEER UWF GIS ONLINE CERTIFICATE GIS Internship (GIS4944) Portfolio Table of Contents Subject... Page Personal statement/mission/philosophy... 1
Evolution or Devolution of Cartographic Education?
 Evolution or Devolution of Cartographic Education? Transformations in Teaching Cartographic Concepts and Techniques Aileen Buckley Cartographic Researcher, ESRI, Inc. abuckley@esri.com Terminology UCGIS*
BASIC TECHNOLOGY Pre K starts and shuts down computer, monitor, and printer E E D D P P P P P P P P P P
 BASIC TECHNOLOGY Pre K 1 2 3 4 5 6 7 8 9 10 11 12 starts and shuts down computer, monitor, and printer P P P P P P practices responsible use and care of technology devices P P P P P P opens and quits an
Galaxies. Introduction. Different Types of Galaxy. Teacher s Notes. Shape. 1. Download these notes at
 1. Introduction A galaxy is a collection of stars, the remains of stars, gas and dust, and the mysterious dark matter. There are many different types and sizes of galaxies, ranging from dwarf galaxies
Geographic Systems and Analysis
 Geographic Systems and Analysis New York University Robert F. Wagner Graduate School of Public Service Instructor Stephanie Rosoff Contact: stephanie.rosoff@nyu.edu Office hours: Mondays by appointment
Understanding Geographic Information System GIS
 Understanding Geographic Information System GIS What do we know about GIS? G eographic I nformation Maps Data S ystem Computerized What do we know about maps? Types of Maps (Familiar Examples) Street Maps
APC Part I Workshop. Mapping and Cartography. 14 November 2014
 APC Part I Workshop Mapping and Cartography 14 November 2014 Cartography Cartography is the discipline dealing with the conception, production, dissemination and study of maps in all forms (ICA) A holistic
Thales Canada, System Division. BattleView: Integrating ArcGIS Into Canadian Army s Command And Control Application
 BattleView: Integrating ArcGIS Into Canadian Army s Command And Control Application BattleView Overview Canadian Army s command and control (C2) application Deployed in army headquarters unit and above
MAP SYMBOL BREWER A NEW APPROACH FOR A CARTOGRAPHIC MAP SYMBOL GENERATOR
 MAP SYMBOL BREWER A NEW APPROACH FOR A CARTOGRAPHIC MAP SYMBOL GENERATOR Olaf Schnabel Institute of Cartography, Swiss Federal Institute of Technology (ETH) CH-8093 Zurich, Switzerland schnabel@karto.baug.ethz.ch
Maps Page Level of Difficulty:
 Chapter 11 Maps Page Level of Difficulty: 11.1 Introduction As scaled depictions of the world, maps are by necessity abstractions of reality. The abstraction takes many forms. Some features are left out
Pool Canvas. Add. Creation Settings. Chapter 1--Objectives and Tools of World Regional Geography. Description Instructions.
 1 of 6 TEST BANK > CONTROL PANEL > POOL MANAGER > POOL CANVAS Pool Canvas Add, modify, and remove questions. Select a question type from the Add Question drop-down list and click Go to add questions. Use
Relativity: The Special And General Theory By Albert Einstein
 Relativity: The Special And General Theory By Albert Einstein If you are searching for the book by Albert Einstein Relativity: The Special and General Theory in pdf format, then you've come to the loyal
GTECH 380/722 Analytical and Computer Cartography Hunter College, CUNY Department of Geography
 GTECH 380/722 Analytical and Computer Cartography Hunter College, CUNY Department of Geography Spring 2010 Wednesdays 5:35PM to 9:15PM Instructor: Doug Williamson, PhD Email: Douglas.Williamson@hunter.cuny.edu
D E S I G N S C H O O L W O R K S H O P T H R E E Backgrounds, Shapes & Layouts
 D E S I G N S C H O O L W O R K S H O P T H R E E Backgrounds, Shapes & Layouts I N T R O D U C T I O N Why backgrounds, shapes, and layouts matter BACKGROUNDS take a blank canvas and set the stage for
HISTORY 1XX/ DH 1XX. Introduction to Geospatial Humanities. Instructor: Zephyr Frank, Associate Professor, History Department Office: Building
 HISTORY 1XX/ DH 1XX Introduction to Geospatial Humanities Instructor: Zephyr Frank, Associate Professor, History Department Office: Building 200-332 Course Description This course introduces undergraduate
Laboratory on Geoinformatics and Cartography
 Research on usability testing and cognitive issues of cartographic visualizations in the context of different groups of users Milan Konečný Čeněk Šašinka, Zbyněk Štěrba Masaryk University, Brno, CZ 19.
LANGUAGE ARTS Junior Elementary
 LANGUAGE ARTS History of Writing Oral Language Handwriting Development Development of manuscript Development of cursive Word Study A Vowels and consonants Building words phonetically Silent e phonograms
EMMA : ECDC Mapping and Multilayer Analysis A GIS enterprise solution to EU agency. Sharing experience and learning from the others
 EMMA : ECDC Mapping and Multilayer Analysis A GIS enterprise solution to EU agency. Sharing experience and learning from the others Lorenzo De Simone, GIS Expert/ EMMA Project Manager 2014 GIS Workshop,
DRAWING YOUR CONTINENT
 CONTINENT PROJECT PART I On the attached sheet, you will draw your own continent. Use your creativity to create a continent that is uniquely your own. Give the continent a name. When you are finished with
Lecture 5. Symbolization and Classification MAP DESIGN: PART I. A picture is worth a thousand words
 Lecture 5 MAP DESIGN: PART I Symbolization and Classification A picture is worth a thousand words Outline Symbolization Types of Maps Classifying Features Visualization Considerations Symbolization Symbolization
Physics 2020 Laboratory Manual
 Physics 00 Laboratory Manual Department of Physics University of Colorado at Boulder Spring, 000 This manual is available for FREE online at: http://www.colorado.edu/physics/phys00/ This manual supercedes
 estrandh@uoregon.edu Introduction The general topic of this paper describes a unique cartographic project depicting a mountain landscape for the Friends of Opal Creek (F.O.C.), a non-profit organization.
MODULE 12: MAPPING. Key Concepts: Maps for Master Plans
 MODULE 12: MAPPING 237 237 237 217 217 217 200 200 200 80 119 27 Key Concepts: 255 0 163 131 239 110 Maps for Master Plans 255 0 163 132 65 135 255 0 163 122 53 120 Cost Effective Data and Software Map
THEMATIC CARTOGRAPHY AND GEOVISUALIZATION PDF
 THEMATIC CARTOGRAPHY AND GEOVISUALIZATION PDF ==> Download: THEMATIC CARTOGRAPHY AND GEOVISUALIZATION PDF THEMATIC CARTOGRAPHY AND GEOVISUALIZATION PDF - Are you searching for Thematic Cartography And
NATIONAL GEOGRAPHIC VISUAL ATLAS OF THE WORLD PDF
 NATIONAL GEOGRAPHIC VISUAL ATLAS OF THE WORLD PDF ==> Download: NATIONAL GEOGRAPHIC VISUAL ATLAS OF THE WORLD PDF NATIONAL GEOGRAPHIC VISUAL ATLAS OF THE WORLD PDF - Are you searching for National Geographic
Chapter 1, Section 1 Exploring Geography
 Chapter 1, Section 1 Exploring Geography (Pages 19 22) Setting a Purpose for Reading Think about these questions as you read: What are the physical and human features geographers study? How do geographers
GIS CONCEPTS ARCGIS METHODS AND. 3 rd Edition, July David M. Theobald, Ph.D. Warner College of Natural Resources Colorado State University
 GIS CONCEPTS AND ARCGIS METHODS 3 rd Edition, July 2007 David M. Theobald, Ph.D. Warner College of Natural Resources Colorado State University Copyright Copyright 2007 by David M. Theobald. All rights
3D MAPS SCALE, ACCURACY, LEVEL OF DETAIL
 26 th International Cartographic Conference August 25 30, 2013 Dresden, Germany 3D MAPS SCALE, ACCURACY, LEVEL OF DETAIL Prof. Dr. Temenoujka BANDROVA Eng. Stefan BONCHEV University of Architecture, Civil
Geological mapwork from scratch 2: valley with simple geology Draw your own cross sections and 3D geological model
 Geological mapwork scratch 2: valley with simple geology Draw your own cross sections and 3D geological model A valley with a stream looks like this: Modified the Geograph project collection. Copyright
Canadian Historical GIS Partnership Development: Taking Steps for Historical Mapping in Canada
 Canadian Historical GIS Partnership Development: Taking Steps for Historical Mapping in Canada Byron Moldofsky Manager, GIS and Cartography Office Department of Geography and Planning University of Toronto
UCL CENTRE FOR ADVANCED SPATIAL ANALYSIS. Mapping London. Oliver O Brien and James Cheshire. Society of Cartographers 48 th Annual Conference (UCL)
") UCL CENTRE FOR ADVANCED SPATIAL ANALYSIS Mapping London Oliver O Brien and James Cheshire Society of Cartographers 48 th Annual Conference (UCL) 5 September 2012 The Mapping London Blog A blog highlighting
UCL CENTRE FOR ADVANCED SPATIAL ANALYSIS Mapping London Oliver O Brien and James Cheshire Society of Cartographers 48 th Annual Conference (UCL) 5 September 2012 The Mapping London Blog A blog highlighting
Available online at Analele Stiintifice ale Universitatii Al. I. Cuza din Iasi Seria Geologie 58 (1) (2012) 53 58
 (2012) 53 58") Available online at http://geology.uaic.ro/auig/ Analele Stiintifice ale Universitatii Al. I. Cuza din Iasi Seria Geologie 58 (1) (2012) 53 58 AUI GEOLOGIE GIS database for mineral resources: case study
Available online at http://geology.uaic.ro/auig/ Analele Stiintifice ale Universitatii Al. I. Cuza din Iasi Seria Geologie 58 (1) (2012) 53 58 AUI GEOLOGIE GIS database for mineral resources: case study
Lesson Plan Summary Magic Tree House #30: Haunted Castle on Hallows Eve
 Lesson Plan Summary Magic Tree House #30: Haunted Castle on Hallows Eve Writing Suspenseful Short Stories EACH STUDENT WILL: Create a short story based on story elements found in a variety of Magic Tree
Designing Better Maps
 Designing Better Maps presented by: Tim Haithcoat University of Missouri Columbia with materials of: Dennis Fizsimons, SW Texas State University George McCleary, Jr., University of Kansas Design is a Choice
You can call the center of the atom, the nucleus. Most atoms in our environment have a stable nucleus.
 Build an Atom Simulation Part One Learning Objectives: Draw models that show atoms Use information about the number of protons, neutrons, and electrons to Identify an element and its position on the periodic
STUDY GUIDE. Exploring Geography. Chapter 1, Section 1. Terms to Know DRAWING FROM EXPERIENCE ORGANIZING YOUR THOUGHTS
 For use with textbook pages 19 22. Exploring Geography Terms to Know location A specific place on the earth (page 20) absolute location The exact spot at which a place is found on the globe (page 20) hemisphere
Psycho-pleasurability of Maps for Wayfinding
 Psycho-pleasurability of Maps for Wayfinding Chun-wen CHEN*, Manlai YOU**, Shang-chia CHIOU*** Graduate School of esign National Yunlin University of Science and Technology, Taiwan *g9030805@yuntech.edu.tw,
Geographer s Toolkit. Geography of Canada
 Geographer s Toolkit Geography of Canada www.craigmarlatt.com/school Geographer s Toolkit 1. Parts of a Map Map Symbols Mapping Your Location 2. Types of Maps 3. Political Map of Canada 4. Drainage Map
WHO IS WHO ON THE MAP?
 WHO IS WHO ON THE MAP? Eng. Stanislav Vasilev, PhD Assoc. Professor in Department of Photogrammetry and Cartography 1, Christo Smirnenski blvd. 1046 Sofia, Bulgaria e-mail: vasilevs_fgs@uacg.bg Abstract
Many Ways to Name a Place
 Your web browser (Safari 7) is out of date. For more security, comfort and Activityapply the best experience on this site: Update your browser Ignore Many Ways to Name a Place What are the names for the
Approaches to Spatial Analysis. Flora Vale, Linda Beale, Mark Harrower, Clint Brown Esri Redlands
 Approaches to Spatial Analysis Flora Vale, Linda Beale, Mark Harrower, Clint Brown Esri Redlands Analysis (noun) Detailed examination of the elements or structure of something, as a basis for discussion,
Geog183: Cartographic Design and Geovisualization Spring Quarter 2017 Lecture 14: Visual analytics and data exploration
 Geog183: Cartographic Design and Geovisualization Spring Quarter 2017 Lecture 14: Visual analytics and data exploration Data exploration Inheritor of the statistical graphic heritage Focus on new methods
Week 8 Cookbook: Review and Reflection
 : Review and Reflection Week 8 Overview 8.1) Review and Reflection 8.2) Making Intelligent Maps: The map sheet as a blank canvas 8.3) Making Intelligent Maps: Base layers and analysis layers 8.4) ArcGIS
2) Find and copy a subtitle e.g. Does anything else influence weather? 10) Name two other things that influence climate and weather.
 Find and copy a subtitle e.g. Does anything else influence weather? 10) Name two other things that influence climate and weather.") Date Understand a report on climate zones 1) What is the title of the report? 2) Find and copy a subtitle eg Does anything else influence weather? 3) What is weather? 4) What is climate? 5) What is temperature?
Date Understand a report on climate zones 1) What is the title of the report? 2) Find and copy a subtitle eg Does anything else influence weather? 3) What is weather? 4) What is climate? 5) What is temperature?