Maps as Tools for Visual Analysis of Geospatial Data. Dr. Claus Rinner Department of Geography and Environmental Studies Ryerson University
|
|
|
- Homer Nicholson
- 6 years ago
- Views:
Transcription
1 Maps as Tools for Visual Analysis of Geospatial Data Dr. Claus Rinner Department of Geography and Environmental Studies Ryerson University 1
2 Geography and data analytics 80% of all datasets are said to include geographic references What does this mean for the decisions made using these data? Geography The Secret Sauce of Data Analytics Jan Kestle, Environics Analytics Location as the integrator for multiple variables 2
3 Outline Map functions and map uses Work of art; storytelling Navigation and information storage Communication tool Analytical tool Cartographic principles and geovisualization Map-centred data analytics Spatial multi-criteria decision analysis (MCDA) The role of maps in decision-making Maps as collaboration tools The impact of crowd-sourced and open data 3
4 Mapping as storytelling Chris Brackley, As The Crow Flies Cartography [Map and inset of North America with migratory species routes removed due to possible copyright issue] 4


5 Fantasy map of Canada makes us wish we all lived in Middle-Earth and 5

6 Navigation with the Mercator projection 6

7 Mercator today 7
 Gender inequality, health expenditure and maternal mortality in sub-saharan Africa: A secondary data analysis.")
8 Mercator today communication function of maps Chirowa et al. (2013) Gender inequality, health expenditure and maternal mortality in sub-saharan Africa: A secondary data analysis. African Journal of Primary Health Care & Family Medicine 5(1), Art. #471, 5 pages 8
9 Cartographic principles Purpose of the map!? Nature of phenomenon => map type Measurement level Data distribution along the number line => graphic variables => classification Normalization 9
 Thematic Cartography and Geovisualization")
10 Cartographic principles nature of phenomenon Slocum et al. (2009) Thematic Cartography and Geovisualization 10


11 Cartographic principles nature of phenomenon Choropleth map: uses spatial units as the map symbols => perception of intensity rather than raw-count, raw magnitude => need to normalize/standardize 11

12 Cartographic principles measurement level Level of measurement and effectiveness of visual variables for mapping of areal data Slocum et al. (2009) 12

13 Cartographic principles measurement level, data distribution Sequential, spectral, and diverging colour schemes Slocum et al. (2009) 13


14 Cartographic principles data distribution Data classification Slocum et al. (2009) 14

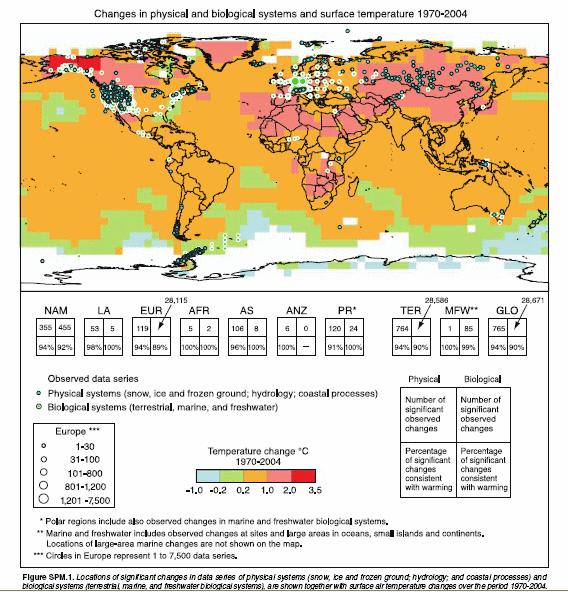
15 Cartographic principles IPCC map critique 15
16 The role of maps in scientific investigation VISUAL THINKING VISUAL COMMUNICATION Exploration Confirmation Synthesis Presentation PRIVATE REALM PUBLIC REALM DiBiase (1990) Visualization in the Earth Sciences 16

17 The uses of maps MacEachren s (1994) map use cube ( cartography^3 ) Geovisualization: highly interactive, specialist tools for geospatial data exploration 17
, http://geoanalytics.net/and/ 18")
18 Map-centred data analysis Demo of CommonGIS / V-Analytics (Gennady & Natalia Andrienko, Fraunhofer IAIS), 18
19 Map-centred data analysis An interactive mapping tool is worth a thousand numbers Rinner & Taranu (2006), p
20 Map-centred multi-criteria decision analysis (MCDA) AKA area-based composite indices 20
21 Map-centred MCDA Issues: Criterion (indicator) selection and directionality Normalization Rescaling Weighting Combination rule 21

22 Map-centred MCDA criterion selection, direction, & normalization 22
 Making")

23 Map-centred MCDA criterion rescaling Heinrich, Huber, & Rinner (2016) Making Area-based Composite Indices Comparable across Time - The Role of Standardization and Outlier Removal
24 Map-centred MCDA combination rule McHenry & Rinner (2016) The Impact of Multi-Criteria Decision Analysis Parameters on an Urban Deprivation Index
 A Geographic Visualization Approach to Multi Criteria Evaluation of Urban Quality of")
25 Geovisualization and big data Extend visual exploration of big data to processed data Rinner (2007) A Geographic Visualization Approach to Multi Criteria Evaluation of Urban Quality of Life 25

26 Open-source ArcGIS plugin for MCDA 26
27 Maps as evidence in decisionmaking European Geosciences Union, 27
")
28 Maps as evidence in decisionmaking Decision support for hot weather outreach Toronto Public Health (2011) 28


29 Maps as evidence in decisionmaking Focus on social vulnerability to heat-related illness Toronto Public Health (2011) 29
 Implementation of a Map-Based Heat Vulnerability Assessment and Decision Support")
30 Maps as evidence in decisionmaking Development of a spatial decision support tool Toronto Public Health (2011) Implementation of a Map-Based Heat Vulnerability Assessment and Decision Support System 30
31 Issue: Indicator weighting Heat vulnerability index composition Toronto Public Health (2011) 31
32 Issue: Normative (MCDA) vs. descriptive (e.g. PCA) modeling Index vs principal components Toronto Public Health (2011) 32
33 Issue: Ease of understanding of MCDA model Alternative index models Toronto Public Health (2011) 33

34 Issue: Purpose of index/map Toronto Public Health (2011) Implementation of a Map-Based Heat Vulnerability Assessment and Decision Support System 34
35 Maps as evidence in decisionmaking Locations and emissions from industrial facilities reporting to the National Pollutant Release Inventory (NPRI) Kershaw, Gower, Rinner, Campbell (2013) 35


36 Maps as evidence in decisionmaking Identifying inequitable exposure to toxic air pollution in racialized and low-income neighbourhoods to support pollution prevention Kershaw et al. (2013) 36
37 Maps as evidence in decisionmaking Oiamo (in progress) for Toronto Public Health: comprehensive environmental noise study Inform updates of noise by-laws Develop equitable mitigation strategies [Maps of City-wide environmental noise levels (day vs night) removed due to possible confidentiality issue] 37
38 Maps as evidence in decisionmaking CAMH System Improvement through Service Collaboratives Hart et al. (2015) [Map of draft service collaborative boundaries removed due to possible confidentiality issue] 38
 The use of Web 2.")
39 Maps as tools for collaboration Argumentation mapping Volunteered Geographic Information (VGI) Rinner, Kessler, & Andrulis (2008) The use of Web 2.0 concepts to support deliberation in spatial decision-making 39

40 Maps as tools for collaboration 40
 A Framework for Implementing Volunteered Geographic Information")
41 Maps as tools for collaboration Volunteered Geographic Information vs Data Fast & Rinner (2014) A Systems Perspective on Volunteered Geographic Information; Rinner & Fast (2014) A Framework for Implementing Volunteered Geographic Information Systems 41
42 Impact of open (geospatial) data Baculi, Fast, & Rinner (under review) The Geospatial Contents of Municipal and Regional Open Data Catalogues in Canada 42


43 Impact of open data Season s greetings card from Toronto traffic light locations DAVISxMARKIETA student exhibit 43

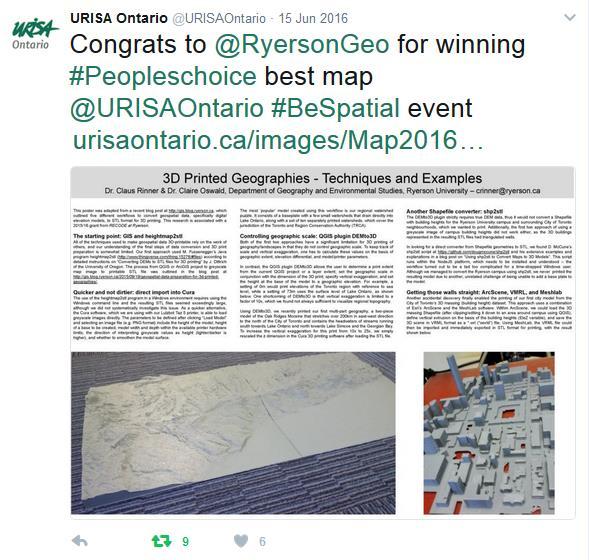
44 Impact of open data 3D-printed geographies 44

45 Summary: Maps, from art through communication to analytical tool 45
46 Thank you! Web: 46
Contents. Interactive Mapping as a Decision Support Tool. Map use: From communication to visualization. The role of maps in GIS
 Contents Interactive Mapping as a Decision Support Tool Claus Rinner Assistant Professor Department of Geography University of Toronto otru gis workshop rinner(a)geog.utoronto.ca 1 The role of maps in
A Geographic Visualization Approach to Multi-Criteria Evaluation of Urban Quality of Life
 A Geographic Visualization Approach to Multi-Criteria Evaluation of Urban Quality of Life CLAUS RINNER Department of Geography, Ryerson University, Toronto, Canada crinner@ryerson.ca This paper proposes
Geography 360 Principles of Cartography. April 17, 2006
 Geography 360 Principles of Cartography April 17, 2006 Outlines Cartographic design principles Enhancing visual hierarchies on maps Kinds of numerical data and color scheme What is proportional symbol
A Framework for Implementing Volunteered Geographic Information Systems
 A Framework for Implementing Volunteered Geographic Information Systems Claus Rinner, Victoria Fast Department of Geography, Ryerson University, Toronto, ON; crinner@ryerson.ca Abstract In an effort to
Switching to AQA from Edexcel: Draft Geography AS and A-level (teaching from September 2016)
") Switching to AQA from Edexcel: Draft Geography AS and A-level (teaching from September 2016) If you are thinking of switching from OCR to AQA (from September 2016), this resource is an easy reference guide.
Switching to AQA from Edexcel: Draft Geography AS and A-level (teaching from September 2016) If you are thinking of switching from OCR to AQA (from September 2016), this resource is an easy reference guide.
Dr.Sinisa Vukicevic Dr. Robert Summers
 Dr.Sinisa Vukicevic Dr. Robert Summers "Planning" means the scientific, aesthetic, and orderly disposition of land, resources, facilities and services with a view to securing the physical, economic and
Animating Maps: Visual Analytics meets Geoweb 2.0
 Animating Maps: Visual Analytics meets Geoweb 2.0 Piyush Yadav 1, Shailesh Deshpande 1, Raja Sengupta 2 1 Tata Research Development and Design Centre, Pune (India) Email: {piyush.yadav1, shailesh.deshpande}@tcs.com
BIG IDEAS. Area of Learning: SOCIAL STUDIES Urban Studies Grade 12. Learning Standards. Curricular Competencies
 Area of Learning: SOCIAL STUDIES Urban Studies Grade 12 BIG IDEAS Urbanization is a critical force that shapes both human life and the planet. The historical development of cities has been shaped by geographic,
ArcGIS for Desktop. ArcGIS for Desktop is the primary authoring tool for the ArcGIS platform.
 ArcGIS for Desktop ArcGIS for Desktop ArcGIS for Desktop is the primary authoring tool for the ArcGIS platform. Beyond showing your data as points on a map, ArcGIS for Desktop gives you the power to manage
Local Government. VALOR GIS Specialist South Georgia RDC
 Lw Low Cost GIS Sl Solutions for Local Government By: Joe Bendis VALOR GIS Specialist South Georgia RDC SERUG 2008 GIS success through cooperation $ $ VALOR Today: 5 staff members dedicated to VALOR innovations,
Climate Risk Visualization for Adaptation Planning and Emergency Response
 Climate Risk Visualization for Adaptation Planning and Emergency Response NCR Flood Fact Finding Workshop Ricardo Saavedra ricardo@vizonomy.com Social Media, Mobile, and Big Data St. Peter s Basilica,
Unit 1: Introduction: Thinking Geographically, Basic Concepts
 Unit 1: Introduction: Thinking Geographically, Basic Concepts 38:180 Human Geography What does it mean to think like a geographer? Memorizing places? Countries, capital cities, rivers, etc School Geography
Alleghany County Schools Curriculum Guide GRADE/COURSE: World Geography
 GRADE/COURSE: World 2013-14 GRADING PERIOD: 1 st Six Weeks Time Frame Unit/SOLs SOL # Strand Resource Assessment 8 days* The student will use maps, globes, satellite images, photographs, or diagrams to
Wayne E. Sirmon GEO 301 World Regional Geography
 Wayne E. Sirmon GEO 301 Geography 301 Geography 301 MAP: A graphic representation of a portion of the earth s surface dawn to scale, as seen from above. Types of Maps Climate maps give general information
Welcome. C o n n e c t i n g
 Welcome C o n n e c t i n g YOU D i s c i p l i n e s Why is This Meeting......So Important Now? OUR WORLD Is Increasingly Challenged The Evidence Is Clear We Need Better Understanding and More Collaboration
Application of Geographic Information Systems for Government School Sites Selection
 Rs. 3000,00 Application of Geographic Information Systems for Government School Sites Selection by K. D. Nethsiri Jayaweera M.Sc. Library - USJP 1111111111111111 210975 2014 210873 Application of Geographic
Reducing Vulnerability to Extreme Heat: Science-Policy Interface
 Reducing Vulnerability to Extreme Heat: Science-Policy Interface Olga Wilhelmi, Mary Hayden, Jennifer Boehnert, Ursula Lauper and SIMMER research team October 23, 2013 Toronto SIMMER workshop Science-Policy
Visualization of Trajectory Attributes in Space Time Cube and Trajectory Wall
 Visualization of Trajectory Attributes in Space Time Cube and Trajectory Wall Gennady Andrienko, Natalia Andrienko, Heidrun Schumann and Christian Tominski Abstract Space time cube is often used as a visualization
Geovisualization of Attribute Uncertainty
 Geovisualization of Attribute Uncertainty Hyeongmo Koo 1, Yongwan Chun 2, Daniel A. Griffith 3 University of Texas at Dallas, 800 W. Campbell Road, Richardson, Texas 75080, 1 Email: hxk134230@utdallas.edu
Disaster Management & Recovery Framework: The Surveyors Response
 Disaster Management & Recovery Framework: The Surveyors Response Greg Scott Inter-Regional Advisor Global Geospatial Information Management United Nations Statistics Division Department of Economic and
Will this program be printed in the Bulletin? Yes No
 NEW UNDERGRADUATE MINOR / CHANGE UNDERGRADUATE MINOR FORM Please fill out Section I. SECTION I: GENERAL INFORMATION Program: GEO Minor: Geography College: A&S Department: Geography Bulletin PP: 135 CIP
Geospatial Visual Analytics and Geovisualization in VisMaster (WP3.4)
") Geospatial Visual Analytics and Geovisualization in VisMaster (WP3.4) Gennady Andrienko Fraunhofer Institute IAIS Sankt Augustin Germany http://geoanalytics.net/and Heidrun Schumann University of Rostock
Geospatial Visual Analytics and Geovisualization in VisMaster (WP3.4) Gennady Andrienko Fraunhofer Institute IAIS Sankt Augustin Germany http://geoanalytics.net/and Heidrun Schumann University of Rostock
Hot Weather Response Plan
 City of Greater Sudbury Hot Weather Response Plan For Public Release Version 1.3 July 2007 May 2009 Revised: May 2010 TABLE OF CONTENTS Introduction... 3 Essential Components... 4 Objectives... 4 Roles
Snowden Cartography 1 GEOG 315:001 Cartography Thursdays 4:00 6:30PM F375 Fall 2010 Dr. Snowden Course Description
 Snowden Cartography 1 www.drksnowden.com GEOG 315:001 Cartography Thursdays 4:00 6:30PM F375 Fall 2010 Dr. Snowden Course Description Principles and theory of basic map design, layout, and communication.
GIS Visualization: A Library s Pursuit Towards Creative and Innovative Research
 GIS Visualization: A Library s Pursuit Towards Creative and Innovative Research Justin B. Sorensen J. Willard Marriott Library University of Utah justin.sorensen@utah.edu Abstract As emerging technologies
Most people used to live like this
 Urbanization Most people used to live like this Increasingly people live like this. For the first time in history, there are now more urban residents than rural residents. Land Cover & Land Use Land cover
GIS = Geographic Information Systems;
 What is GIS GIS = Geographic Information Systems; What Information are we talking about? Information about anything that has a place (e.g. locations of features, address of people) on Earth s surface,
Interactive Cumulative Curves for Exploratory Classification Maps
 Interactive Cumulative Curves for Exploratory Classification Maps Gennady Andrienko and Natalia Andrienko Fraunhofer Institute AIS Schloss Birlinghoven, 53754 Sankt Augustin, Germany Tel +49-2241-142486,
Interactive Statistics Visualisation based on Geovisual Analytics
 Interactive Statistics Visualisation based on Geovisual Analytics Prof. Mikael Jern NCVA LiU and NComVA AB May 2010 - Spin-off company to focus on Interactive Statistics Visualization and Storytelling
Core Courses for Students Who Enrolled Prior to Fall 2018
 Biostatistics and Applied Data Analysis Students must take one of the following two sequences: Sequence 1 Biostatistics and Data Analysis I (PHP 2507) This course, the first in a year long, two-course
Belfairs Academy GEOGRAPHY Fundamentals Map
 YEAR 12 Fundamentals Unit 1 Contemporary Urban Places Urbanisation Urbanisation and its importance in human affairs. Global patterns of urbanisation since 1945. Urbanisation, suburbanisation, counter-urbanisation,
Geography: Place & Liveability
 Geography: Place & Liveability Learning Area(s) Geography Year(s) 6, 7 Description AC Geography : Year 6 A diverse and connected world takes a global view of geography and focuses particularly on the concepts
Pathways. Pathways through the Geography Major
 Pathways through the Major majors may structure their course selections around a sub-field of. Pathways are suggestions for classes in, in related disciplines, and skills training. Each pathway includes
Canadian Historical GIS Partnership Development: Taking Steps for Historical Mapping in Canada
 Canadian Historical GIS Partnership Development: Taking Steps for Historical Mapping in Canada Byron Moldofsky Manager, GIS and Cartography Office Department of Geography and Planning University of Toronto
Cartographic Skills. L.O. To be aware of the various cartographic skills and when to use them
 Cartographic Skills L.O. To be aware of the various cartographic skills and when to use them Cartographic Skills The term cartography is derived from two words: Carto = map graphy = write/draw Cartography
Non-parametric bootstrap and small area estimation to mitigate bias in crowdsourced data Simulation study and application to perceived safety
 Non-parametric bootstrap and small area estimation to mitigate bias in crowdsourced data Simulation study and application to perceived safety David Buil-Gil, Reka Solymosi Centre for Criminology and Criminal
Demographic Data in ArcGIS. Harry J. Moore IV
 Demographic Data in ArcGIS Harry J. Moore IV Outline What is demographic data? Esri Demographic data - Real world examples with GIS - Redistricting - Emergency Preparedness - Economic Development Next
Dublin City Schools Social Studies Graded Course of Study Grade 5 K-12 Social Studies Vision
 K-12 Social Studies Vision The Dublin City Schools K-12 Social Studies Education will provide many learning opportunities that will help students to: develop thinking as educated citizens who seek to understand
VGIscience Summer School Interpretation, Visualisation and Social Computing of Volunteered Geographic Information (VGI)
") VGIscience Summer School Interpretation, Visualisation and Social Computing of Volunteered Geographic Information (VGI) TU Dresden, 11.-15. September 2017 Welcome PhD students working on research topics
VGIscience Summer School Interpretation, Visualisation and Social Computing of Volunteered Geographic Information (VGI) TU Dresden, 11.-15. September 2017 Welcome PhD students working on research topics
Cartography and Geovisualization. Chapters 12 and 13 of your textbook
 Cartography and Geovisualization Chapters 12 and 13 of your textbook Why cartography? Maps are the principle means of displaying spatial data Exploration: visualization, leading to conceptualization of
Cartography and Children Commission: Proposals for the next 4 years
 International Cartographic Association Cartography and Children Commission: Proposals for the next 4 years José Jesús Reyes Nuñez Eötvös Loránd University Dept. of Cartography and Geoinformatics Budapest,
World Geography. WG.1.1 Explain Earth s grid system and be able to locate places using degrees of latitude and longitude.
 Standard 1: The World in Spatial Terms Students will use maps, globes, atlases, and grid-referenced technologies, such as remote sensing, Geographic Information Systems (GIS), and Global Positioning Systems
Combining Geospatial and Statistical Data for Analysis & Dissemination
 Combining Geospatial and Statistical Data for Analysis & Dissemination (with Special Reference to Qatar Census 2010) Presentation by Mansoor Al Malki, Director of IT Department Qatar Statistics Authority
GTECH 201 Geographic Methods
 GTECH 201 Geographic Methods Map Quiz What is Geography? Administravia Course web site Accounts, printing, email (Hunter only) Send me an email with: name, geo courses taken, major/minor, Fr/So/Jr/Sr Types
INDIANA ACADEMIC STANDARDS FOR SOCIAL STUDIES, WORLD GEOGRAPHY. PAGE(S) WHERE TAUGHT (If submission is not a book, cite appropriate location(s))
 WHERE TAUGHT (If submission is not a book, cite appropriate location(s))") Prentice Hall: The Cultural Landscape, An Introduction to Human Geography 2002 Indiana Academic Standards for Social Studies, World Geography (Grades 9-12) STANDARD 1: THE WORLD IN SPATIAL TERMS Students
Prentice Hall: The Cultural Landscape, An Introduction to Human Geography 2002 Indiana Academic Standards for Social Studies, World Geography (Grades 9-12) STANDARD 1: THE WORLD IN SPATIAL TERMS Students
Generalisation and Multiple Representation of Location-Based Social Media Data
 Generalisation and Multiple Representation of Location-Based Social Media Data Dirk Burghardt, Alexander Dunkel and Mathias Gröbe, Institute of Cartography Outline 1. Motivation VGI and spatial data from
Curriculum map GEOGRAPHY
 Curriculum map Learning outcomes (LOs): Having completed a major in Geography, a student will be able to: 1. Demonstrate an understanding of the major biophysical and social patterns in the world, and
Applying Health Outcome Data to Improve Health Equity
 Applying Health Outcome Data to Improve Health Equity Devon Williford, MPH, Health GIS Specialist Lorraine Dixon-Jones, Policy Analyst CDPHE Health Equity and Environmental Justice Collaborative Mile High
Towards a fully integrated urban weather environment climate service in Mexico City
 Towards a fully integrated urban weather environment climate service in Mexico City Mexico City Ministry of Environment SEDEMA Tanya Müller (Secretary of Environment), Beatriz Cárdenas (SEDEMA), Luisa
Sample assessment task. Task details. Content description. Year level 7
 Sample assessment task Year level 7 Learning area Subject Title of task Task details Description of task Type of assessment Purpose of assessment Assessment strategy Evidence to be collected Suggested
GEOGRAPHY (GE) Courses of Instruction
 Courses of Instruction") GEOGRAPHY (GE) GE 102. (3) World Regional Geography. The geographic method of inquiry is used to examine, describe, explain, and analyze the human and physical environments of the major regions of the
GEOGRAPHY (GE) GE 102. (3) World Regional Geography. The geographic method of inquiry is used to examine, describe, explain, and analyze the human and physical environments of the major regions of the
Creating synergies between Statistical and Geospatial information for better policy outputs: The case of Mexico
 Creating synergies between Statistical and Geospatial information for better policy outputs: The case of Mexico Geospatial & Statistics Integration for Informed Decision Making Geospatial World Forum 2017
Cognitive Engineering for Geographic Information Science
 Cognitive Engineering for Geographic Information Science Martin Raubal Department of Geography, UCSB raubal@geog.ucsb.edu 21 Jan 2009 ThinkSpatial, UCSB 1 GIScience Motivation systematic study of all aspects
Key Points Sharing fosters participation and collaboration Metadata has a big role in sharing Sharing is not always easy
 Sharing Resources Geoff Mortson esri, Inc. SDI Solutions Team Key Points Sharing fosters participation and collaboration Metadata has a big role in sharing Sharing is not always easy Data Sharing is Good
Geography - Grade 8. Unit A - Global Settlement: Patterns and Sustainability
 Geography - Grade 8 Geographical Thinking: Spatial Significance Patterns and Trends Interrelationships Geographic Perspective Geographic Inquiry: STEP 1 - Formulate Questions STEP 2 - Gather and Organize
Methodological issues in the development of accessibility measures to services: challenges and possible solutions in the Canadian context
 Methodological issues in the development of accessibility measures to services: challenges and possible solutions in the Canadian context Alessandro Alasia 1, Frédéric Bédard 2, and Julie Bélanger 1 (1)
a system for input, storage, manipulation, and output of geographic information. GIS combines software with hardware,
 Introduction to GIS Dr. Pranjit Kr. Sarma Assistant Professor Department of Geography Mangaldi College Mobile: +91 94357 04398 What is a GIS a system for input, storage, manipulation, and output of geographic
8/28/2011. Contents. Lecture 1: Introduction to GIS. Dr. Bo Wu Learning Outcomes. Map A Geographic Language.
 Contents Lecture 1: Introduction to GIS Dr. Bo Wu lsbowu@polyu.edu.hk Department of Land Surveying & Geo-Informatics The Hong Kong Polytechnic University 1. Learning outcomes 2. GIS definition 3. GIS examples
A Framework for the Study of Urban Health. Abdullah Baqui, DrPH, MPH, MBBS Johns Hopkins University
 This work is licensed under a Creative Commons Attribution-NonCommercial-ShareAlike License. Your use of this material constitutes acceptance of that license and the conditions of use of materials on this
Conceptual Framework Fieldwork Enquiry: Rivers, Coasts & Ecosystems 3 days
 GCSE Geography Eduqas B Conceptual Framework Fieldwork Enquiry: Rivers, Coasts & Ecosystems 3 days Fully complete conceptual framework fieldwork enquiry to prepare students for Component 3: Applied Fieldwork
AP Human Geography. Course Outline Geography: Its Nature and Perspectives: Weeks 1-4
 AP Human Geography The Course The AP Human Geography course is designed to provide secondary students with the equivalent of one semester of a college introductory human geography class. The purpose of
1. Pass GE1101E Geographical Journeys: Exploring World Environments. This will be counted towards the Faculty Core or UE requirements.
 H Geography At the Department of Geography, students are encouraged to develop a deeper and more critical understanding of both physical and human environments. Students will acquire knowledge, skills
Applying Visual Analytics Methods to Spatial Time Series Data: Forest Fires, Phone Calls,
 Applying Visual Analytics Methods to Spatial Time Series Data: Forest Fires, Phone Calls, Dr. & Dr. Natalia Andrienko In collaboration with TU Darmstadt and Univ. Constance, DFG Priority Research Program
Data Documentation and Protocol for Maintenance and Updating
 Implementation of a Map-Based Heat Vulnerability Assessment and Decision Support System Data Documentation and Protocol for Maintenance and Updating 31 March 2011 Prepared on behalf and with the support
Long Island Breast Cancer Study and the GIS-H (Health)
") Long Island Breast Cancer Study and the GIS-H (Health) Edward J. Trapido, Sc.D. Associate Director Epidemiology and Genetics Research Program, DCCPS/NCI COMPREHENSIVE APPROACHES TO CANCER CONTROL September,
Long Island Breast Cancer Study and the GIS-H (Health) Edward J. Trapido, Sc.D. Associate Director Epidemiology and Genetics Research Program, DCCPS/NCI COMPREHENSIVE APPROACHES TO CANCER CONTROL September,
CONCEPTUAL DEVELOPMENT OF AN ASSISTANT FOR CHANGE DETECTION AND ANALYSIS BASED ON REMOTELY SENSED SCENES
 CONCEPTUAL DEVELOPMENT OF AN ASSISTANT FOR CHANGE DETECTION AND ANALYSIS BASED ON REMOTELY SENSED SCENES J. Schiewe University of Osnabrück, Institute for Geoinformatics and Remote Sensing, Seminarstr.
6th ICA Mountain Cartography Workshop Lenk/Switzerland. Cartographic Design Issues Utilizing Google Earth for Spatial Communication
 6th ICA Mountain Cartography Workshop Lenk/Switzerland Cartographic Design Issues Utilizing Google Earth for Spatial Communication Department of Geography and Regional Research Karel Kriz University Vienna,
Washington State K 12 Learning Standards and Guidelines Science Grade: 8 - Adopted: 2014
 Main Criteria: Washington State K 12 Learning Standards and Guidelines Secondary Criteria: Subjects: Science, Social Studies Grade: 8 Correlation Options: Show Correlated Washington State K 12 Learning
Extreme Temperature Protocol in Middlesex-London
 Clean Air Partnership Webinar March 17, 2009 Extreme Temperature Protocol in Middlesex-London Presented by Iqbal Kalsi, MBA, CPHI(C), CCEP iqbal.kalsi@mlhu.on.ca 1 History Informal monitoring, tracking
Foundation Geospatial Information to serve National and Global Priorities
 Foundation Geospatial Information to serve National and Global Priorities Greg Scott Inter-Regional Advisor Global Geospatial Information Management United Nations Statistics Division UN-GGIM: A global
THEMATIC CARTOGRAPHY AND GEOVISUALIZATION PDF
 THEMATIC CARTOGRAPHY AND GEOVISUALIZATION PDF ==> Download: THEMATIC CARTOGRAPHY AND GEOVISUALIZATION PDF THEMATIC CARTOGRAPHY AND GEOVISUALIZATION PDF - Are you searching for Thematic Cartography And
Maps and sustainability
 Maps and sustainability The International Map Year [ mapyear.org ] Menno-Jan Kraak Maps Cartography and maps A map is a visual representation of an environment maps tell stories maps invite maps show patterns
Climate Resilience Decision Making Framework in the Caribbean. A case of Spatial Data Management
 Climate Resilience Decision Making Framework in the Caribbean A case of Spatial Data Management Bishwa Pandey Sr. Data Management Specialist The World Bank Background The mission of The World Bank s Latin
https://sites.google.com/a/pdx.edu/gis-2-applications/home
 Page 1 of 5 GIS 2: APPLICATIONS Search this site GEOG 492/592: GIS 2 Syllabus Academic Guidelines Rubrics Presentation Rubric Project Poster Project Proposal Syllabus (PDF) Sitemap GEOG 492/592: GIS 2
Tools to Assess Local Health Needs. Richard Leadbeater, Esri NACo 2011 Healthy Counties Forum December 1, 2011
 Tools to Assess Local Health Needs Richard Leadbeater, Esri NACo 2011 Healthy Counties Forum December 1, 2011 Richard Leadbeater currently holds the position of Industry Solutions Manager with Esri. He
MAP SYMBOL BREWER A NEW APPROACH FOR A CARTOGRAPHIC MAP SYMBOL GENERATOR
 MAP SYMBOL BREWER A NEW APPROACH FOR A CARTOGRAPHIC MAP SYMBOL GENERATOR Olaf Schnabel Institute of Cartography, Swiss Federal Institute of Technology (ETH) CH-8093 Zurich, Switzerland schnabel@karto.baug.ethz.ch
Geography (GEOG) Introduction to Geography Global Change and Natural Disasters and Environmental Change
 Introduction to Geography Global Change and Natural Disasters and Environmental Change") Geography (GEOG) Head of Department: Professor Jeffrey P. Osleeb Department Office: Room 422, Philip E. Austin Building For major requirements, see the College of Liberal Arts and Sciences section of this
Geography (GEOG) Head of Department: Professor Jeffrey P. Osleeb Department Office: Room 422, Philip E. Austin Building For major requirements, see the College of Liberal Arts and Sciences section of this
VISUAL ANALYTICS APPROACH FOR CONSIDERING UNCERTAINTY INFORMATION IN CHANGE ANALYSIS PROCESSES
 VISUAL ANALYTICS APPROACH FOR CONSIDERING UNCERTAINTY INFORMATION IN CHANGE ANALYSIS PROCESSES J. Schiewe HafenCity University Hamburg, Lab for Geoinformatics and Geovisualization, Hebebrandstr. 1, 22297
Geo-Visualization. GRS1011 Ron van Lammeren
 Geo-Visualization GRS1011 Ron van Lammeren Theory Semiologie Graphique http://www.flickr.com/photos/kbean/491051226/ 2/30 How to present my geo data? Visualization definitions Map making Cartographic process
Geo-Visualization. GRS09/10 Ron van Lammeren
 Geo-Visualization GRS09/10 Ron van Lammeren 2/30 Theory Semiologie Graphique http://www.flickr.com/photos/kbean/491051226/ 3/30 How to present my geo data? Visualization definitions Map making Cartographic
Amarillo ISD Social Studies Curriculum
 Amarillo Independent School District follows the Texas Essential Knowledge and Skills (TEKS). All of AISD curriculum and documents and resources are aligned to the TEKS. The State of Texas State Board
Exploratory Data Analysis and Decision Making with Descartes and CommonGIS
 Exploratory Data Analysis and Decision Making with Descartes and CommonGIS Hans Voss, Natalia Andrienko, Gennady Andrienko Fraunhofer Institut Autonome Intelligente Systeme, FhG-AIS, Schloss Birlinghoven,
Geography (GEOG) Courses
 Courses") Geography (GEOG) 1 Geography (GEOG) Courses GEOG 100. Introduction to Human Geography. 4 (GE=D4) Introduction to the global patterns and dynamics of such human activities as population growth and movements,
Geography (GEOG) 1 Geography (GEOG) Courses GEOG 100. Introduction to Human Geography. 4 (GE=D4) Introduction to the global patterns and dynamics of such human activities as population growth and movements,
Geographical knowledge and understanding scope and sequence: Foundation to Year 10
 Geographical knowledge and understanding scope and sequence: Foundation to Year 10 Foundation Year 1 Year 2 Year 3 Year 4 Year 5 Year 6 Year level focus People live in places Places have distinctive features
GRADE 5 SOCIAL STUDIES SOCIAL STUDIES APPLICATION. SOCIAL STUDIES STANDARDS for Grade 5
 GRADE 5 SOCIAL STUDIES The Archdiocese of Cincinnati has established the following Social Studies standards based on the most current teachings which are aligned to Ohio New Learning Social Studies Standards.
ReCAP Status Review of the Updated Rural Access Index (RAI) Stephen Vincent, Principal Investigator
 Stephen Vincent, Principal Investigator") ReCAP Status Review of the Updated Rural Access Index (RAI) Stephen Vincent, Principal Investigator Establishment of RAI in 2005/2006 2006 Definition of the RAI Note by Peter Roberts Dated September 2005
ReCAP Status Review of the Updated Rural Access Index (RAI) Stephen Vincent, Principal Investigator Establishment of RAI in 2005/2006 2006 Definition of the RAI Note by Peter Roberts Dated September 2005
Hennig, B.D. and Dorling, D. (2014) Mapping Inequalities in London, Bulletin of the Society of Cartographers, 47, 1&2,
 Mapping Inequalities in London, Bulletin of the Society of Cartographers, 47, 1&2,") Hennig, B.D. and Dorling, D. (2014) Mapping Inequalities in London, Bulletin of the Society of Cartographers, 47, 1&2, 21-28. Pre- publication draft without figures Mapping London using cartograms The
Hennig, B.D. and Dorling, D. (2014) Mapping Inequalities in London, Bulletin of the Society of Cartographers, 47, 1&2, 21-28. Pre- publication draft without figures Mapping London using cartograms The
0 Maps are the principle means of displaying spatial data
 Why cartography? 0 Maps are the principle means of displaying spatial data 0 Exploration: visualization, leading to conceptualization of patterns and processes. (Chap 13) 0 Communication: convey information
Using GIS for Citizen Science Research
 Erin Harrington NRS 509 Final Project Using GIS for Citizen Science Research The concept of citizen science has existed since the beginning of the 20 th century, but it has not been until the last few
National Quali cations
 H 2018 X733/76/11 National Quali cations Geography TUESDAY, 1 MAY 9:00 AM 11:15 AM Total marks 60 SECTION 1 PHYSICAL ENVIRONMENTS 15 marks Attempt ALL questions. SECTION 2 HUMAN ENVIRONMENTS 15 marks Attempt
New COST Action: Towards a European Network on Chemical Weather Forecasting and Information Systems
 New COST Action: Towards a European Network on Chemical Weather Forecasting and Information Systems Proposer: Mikhail Sofiev Finnish Meteorological Institute Historical background EUMETNET Workshop on
GenEd Courses offered by Dept. of Geography, Presidency University
 GenEd Courses offered by Dept. of Geography, Presidency University (All the Courses are offered to both Science and Humanities Students) Semester Course No. Course Name Maximum No. of Students (originally
Cycles, Systems and Changing Places 5 days
 AS Level Geography AQA Cycles, Systems and Changing Places 5 days Complete the fieldwork requirements for AS level students within physical and human environments. Fieldwork in these locations provides
Better Topographic Map Production Using ArcGIS. A Comprehensive Solution for Mapping Organizations
 Better Topographic Map Production Using ArcGIS A Comprehensive Solution for Mapping Organizations The World Is Always Changing As a member of a national mapping organization, you know this is true. You
GCE. Geography. Student Guidance. Revised GCE. AS Unit 3: Fieldwork Skills and Techniques in Geography: the summary statement and table of data
 GCE Revised GCE Geography Student Guidance AS Unit 3: Fieldwork Skills and Techniques in Geography: the summary statement and table of data For first teaching from September 2016 For first award of AS
Washington State K 12 Learning Standards and Guidelines Science Grade: 6 - Adopted: 2014
 Main Criteria: Washington State K 12 Learning Standards and Guidelines Secondary Criteria: Subjects: Science, Social Studies Grade: 6 Correlation Options: Show Correlated Washington State K 12 Learning
METHODS FOR STATISTICS
 DYNAMIC CARTOGRAPHIC METHODS FOR VISUALIZATION OF HEALTH STATISTICS Radim Stampach M.Sc. Assoc. Prof. Milan Konecny Ph.D. Petr Kubicek Ph.D. Laboratory on Geoinformatics and Cartography, Department of
How to shape future met-services: a seamless perspective
 How to shape future met-services: a seamless perspective Paolo Ruti, Chief World Weather Research Division Sarah Jones, Chair Scientific Steering Committee Improving the skill big resources ECMWF s forecast
Megacity Research Project TP. Ho Chi Minh Adaptation to Global Climate Change in Vietnam: Integrative Urban and Environmental Planning Framework
 1. Organization 2. Global Warming 3. Starting Phase 4. Results, Transdisciplinarity, Low-Rise High Density 5. Risk of Flooding 6. Partners 7. Action Field 1 8. Action Field 2 9. Urban Development Trends
A Comprehensive Inventory of the Number of Modified Stream Channels in the State of Minnesota. Data, Information and Knowledge Management.
 A Comprehensive Inventory of the Number of Modified Stream Channels in the State of Minnesota Data, Information and Knowledge Management Glenn Skuta Environmental Analysis and Outcomes Division Minnesota