Interactive Statistics Visualisation based on Geovisual Analytics
|
|
|
- Frank Jennings
- 5 years ago
- Views:
Transcription


1 Interactive Statistics Visualisation based on Geovisual Analytics Prof. Mikael Jern NCVA LiU and NComVA AB May Spin-off company to focus on Interactive Statistics Visualization and Storytelling 1
2 NComVA based on 10 years innovative research. Our research centre NCVA was established in 2006 with 1 million in funding from the Swedish Knowledge Foundation; Our Geovisual Analytics technology is developed in close collaboration with in particular OECD and Statistics Sweden - with start in early 2008 but is based on our research since 2002 More than 50 man years development; Statistics explorer V1 for regional data (OECD explorer) and world countries (Factbook) is placed at the OECD public website in October 2008; NComVA AB was founded in May 2010 as a spin-off company from NCVA with involved researchers as shareholders to guarantee a long commitment with continued development and support; NComVA collaborates with organizations interested in leading-edge innovations including OECD, SCB, City of Gothenburg, EC Commission but also Unilever, SMHI, Ericsson Research; Early collaboration with experienced partners 2


3 a picture is worth a thousand words What these numbers could not communicate when presented as text in a table, which our brains interpret through the use of verbal processing, becomes visible and understandable when communicated visually. This is the power of statistics data visualization." Domestic sales larger than International and growing; Flat international sales and decreases sharply in August; Cyclical sales pattern in Domestic sales repeated on a quarterly basis reaching a peak in last month of quarter; 3


4 an interactive picture is worth a thousand pictures Air Pollution in an interactive OECD report Collaboration with Statistics Sweden 4

5 Search + Examine + Explain = SEE to Search for meaningful patterns Discovery then Examine them and once they re found. Gain Understanding and use Storytelling. to communicate meaningful findings to others.. Explain results often in Decisions aha, I see! Collaboration with Statistics Sweden 5
6 Collaboration with Statistics Sweden 6

7 Information Visualization Geovisual Analytics Information Visualization Geographic Visualization Geovisual Analytics 7

8 Information Visualization Geographic Visualization Geovisual Analytics Cognitive Perceptual Science Information Visualization Geographic Visualization Geovisual Analytics Cognitive Perceptual Science Time Animation Visualization 8


9 Information Visualization Geographic Visualization Geovisual Analytics Cognitive Perceptual Science Data Transformation Dynamic Filter Time Animation Visualization Information Visualization Geographic Visualization Communicate Storytelling Publish Geovisual Analytics Data Transformation Dynamic Filter Cognitive Perceptual Science Time Animation Visualization 9


10 From data import, explore and gain insight to storytelling, collaboration and publishing NComVA offers Statistics explorer applications 10


11 GAV Flash/HTML5 JS framework and toolbox Statistics explorer or Customized Applications 11


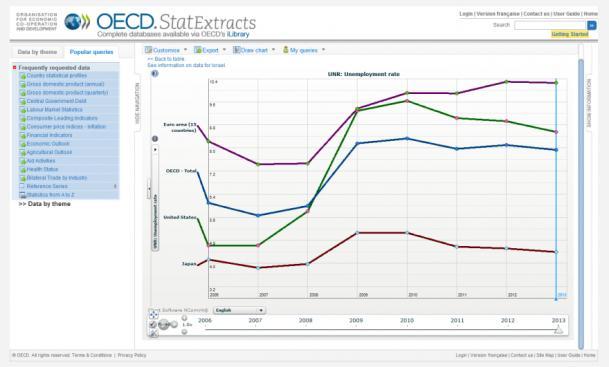
12 Integrating GAV JavaScript visual components into QlikView World explorer with Storytelling using multiple linked and coordinates views Why What Where When 12
13 World explorer with Storytelling using multiple linked and coordinates views Why Where Why What When World explorer with Storytelling using multiple linked and coordinates views 13


14 World explorer with Storytelling using multiple linked and coordinates views An improved GUI layout moving frequently used features icons into a top menu and thus more accessible to the user The story writing process Select data, explore, gain insight, create a story, share 14


15 Improved Story Editor Simplified Snapshot assignment add or remove Chapters Snapshot list edit, recapture or delete Snapshot select URL or Snapshot hyperlink to web site new Snapshot Snapshot link Using snapshots to store insights Metatext combined with links to snapshots that has captured the visualization 15


16 Highlight some key innovative technology points: Proven Information Visualization methods ; Highlight some key innovative technology points: Multiple linked and coordinated views explore and see the multivariate data simultaneously from several perspectives; 16


17 Highlight some key innovative technology points: Multiple linked and coordinated views explore and see the multivariate data simultaneously from several perspectives; Highlight some key innovative technology points: Dynamic Colour Legend - facilitating statistical methods for class value calculations and scientifically tested perceptual acceptance of colour scales and a filter mechanism attached to legend; Migration net flows 17

 for")
18 Migration Net Flows Europe in Colour and B/W Red means negative Flow and Blue is Positive Highlight some key innovative technology points: Dynamic Queries using the Indicator Filter Find outliers (percentile 10% and 90%) for age group


19 Highlight some key innovative technology points: Fish eye technique to See selected larger data set within their context Dynamic Bar Chart Viewed from the front, some items are in focus, but all items are present in a bird s eye view Highlight some key innovative technology points: Fish eye technique to See selected larger data set within their context Dynamic Bar Chart 19


20 Highlight some key innovative technology points: Focus & Context technique to See selected larger data set within their context Table Lens Highlight some key innovative technology points: Focus & Context technique to See selected larger data set within their context Choropleth Map 20

21 Highlight some key innovative technology points: Focus on areas of interest, while maintaining surrounding context (but not in as much detail). Give more space and attention to focus but keep context Fisheye views: geometric distortion like a magnifying glass over the area of interest Overview and detail: an overview map complements a detail map view. Focus & Context requires Interaction Highlight some key innovative technology points: Parallel Coordinates or Profile Plot age 0-14 age age 65+ life expectancy fertility rate GDP growth Max Niger Japan Niger China China Sweden Germany Japan Min 21
![N equidistance axes correspond to the variables Axes are scaled to the [min, max] range of the variable Every data item (country) corresponds to a polygonal line age 0-14 age 15-64 age 65+ life](/docs-images/83/88195305/images/22-1.jpg "expectancy fertility rate GDP growth Niger Max Japan Niger China China Sweden Germany Japan Min Highlight some key innovative technology points: Parallel Coordinates with applied Filter Mechanism -")
22 N equidistance axes correspond to the variables Axes are scaled to the [min, max] range of the variable Every data item (country) corresponds to a polygonal line age 0-14 age age 65+ life expectancy fertility rate GDP growth Niger Max Japan Niger China China Sweden Germany Japan Min Highlight some key innovative technology points: Parallel Coordinates with applied Filter Mechanism - Countries with highest Health Expenditure per capita; USA Denmark Finland 22


23 Highlight some key innovative technology points: Scatter Matrix - Information Visualization technique to explore multivariate data Highlight some key innovative technology points: Treemap Visualization in linked views 23

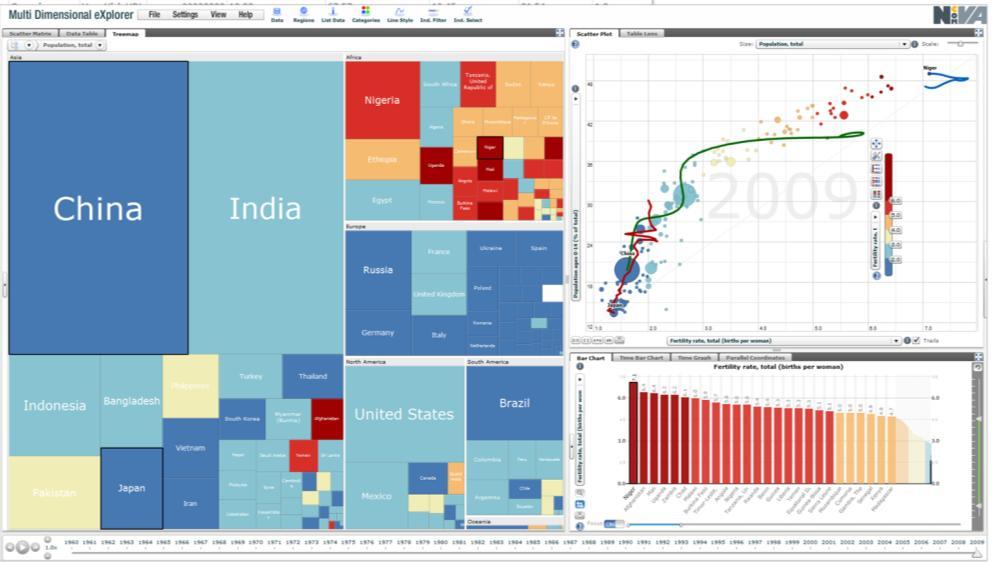
24 24
 and")

25 Highlight some key innovative technology points: Integrated Choropleth Map and Treemap Perception uses colour (Age 65+) and size (Population); Highlight some key innovative technology points: Interactive Treemap Perception uses colour Sales management 25


26 Highlight some key innovative technology points: Interactive Treemap Perception uses colour Sales management Pensionsmyndigheten marknadsvärde och avgift Size of market and Cost 26

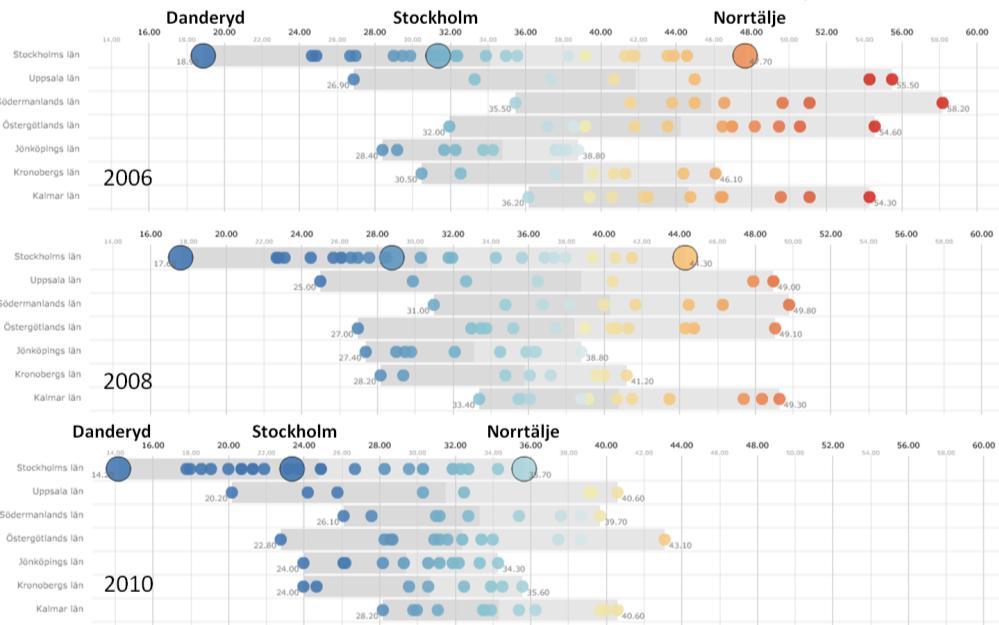
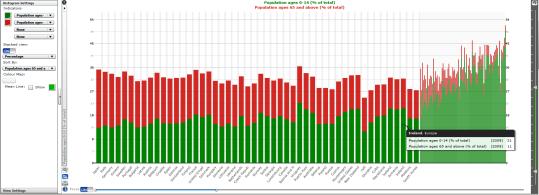
27 Distribution Plot becoming very popular Swedish counties with municipalities Unhealthy Indicator Distribution Plot becoming very popular Swedish counties with municipalities Unhealthy Indicator 27
28 Distribution Plot becoming very popular Swedish counties with municipalities Unhealthy Indicator Distribution Plot becoming very popular Swedish counties with municipalities Unhealthy Indicator 28

29 Highlight some key innovative technology points: Using Map Layers Highlight some key innovative technology points: Using Map Layers 29


30 Highlight some key innovative technology points: Introducing Flowmap explorer visualizing trading flows between countries USA as focus point Highlight some key innovative technology points: Introducing Flowmap explorer visualizing Migration flows between Swedish Municipalities 30

31 Highlight some key innovative technology points: Introducing Flowmap explorer visualizing Commuting flows between Norway and Sweden for counties Highlight some key innovative technology points: Using Dual Data Sources Point Data and Shape Data 31

32 Highlight some key innovative technology points: OECD Metropolitan explorer Highlight some key innovative technology points: Integrated Storytelling with Snapshot technology each component saves its state; 32
 e.g. 10,000; 2; 121;... Real numbers (e.g. object A is twice as big as B, can do arithmetic; Categorical data (Nominal) Labeling function e.")
 Categories: Low HDI, Medium HDI, High HDI, Very")
33 Highlight some key innovative technology points: Data Complexity in Statistics Visualization Quantitative and Categorical data Quantitative data (Numerical) e.g. 10,000; 2; 121;... Real numbers (e.g. object A is twice as big as B, can do arithmetic; Categorical data (Nominal) Labeling function e.g. Continent Europe, Asia, Africa; Category data that can be direct compared e.g. High, Low,..; Working with Categorical data in World explorer Human Development Indicator (HDI) Categories: Low HDI, Medium HDI, High HDI, Very High HDI 33

34 Working with Categorical data in World explorer Human Development Indicator (HDI) Categories: Low HDI, Medium HDI, High HDI, Very High HDI with Storytelling, collaboration and Publishing 34


35 with Storytelling, collaboration and Publishing with Storytelling, collaboration and Publishing 35
36 with Storytelling, collaboration and Publishing HTML5/JS Visualization for Mobile devices 36


37 HTML5/JS Visualization for Mobile devices Region selector, since bubbles are too small to select. New user interface layer for touch screen devices Smaller area for interactive visualization Allows for immediate updates of application and publishing of new statistics, unlike appstores HTML5/JS Visualization for Mobile devices 37

38 Publisher creates Flash or HTML5 Vislet code and now more from Tobias 38
Implementation of a Flow Map Demonstrator for Analyzing Commuting and Migration Flow Statistics Data
 Procedia - Social and Behavioral Sciences 00 (2011) 000 000 Procedia Social and Behavioral Sciences www.elsevier.com/locate/procedia Spatial Thinking and Geographic Information Sciences Implementation
Treemaps and Choropleth Maps Applied to Regional Hierarchical Statistical Data
 Treemaps and Choropleth Maps Applied to Regional Hierarchical Statistical Data Mikael Jern, Jakob Rogstadius, Tobias Åström NCVA National Center for Visual Analytics, Linkoping University, Sweden mikael.jern@itn.liu.se,
Animating Maps: Visual Analytics meets Geoweb 2.0
 Animating Maps: Visual Analytics meets Geoweb 2.0 Piyush Yadav 1, Shailesh Deshpande 1, Raja Sengupta 2 1 Tata Research Development and Design Centre, Pune (India) Email: {piyush.yadav1, shailesh.deshpande}@tcs.com
Lecture 5. Symbolization and Classification MAP DESIGN: PART I. A picture is worth a thousand words
 Lecture 5 MAP DESIGN: PART I Symbolization and Classification A picture is worth a thousand words Outline Symbolization Types of Maps Classifying Features Visualization Considerations Symbolization Symbolization
Your web browser (Safari 7) is out of date. For more security, comfort and. the best experience on this site: Update your browser Ignore
 is out of date. For more security, comfort and. the best experience on this site: Update your browser Ignore") Your web browser (Safari 7) is out of date. For more security, comfort and Activityengage the best experience on this site: Update your browser Ignore Introduction to GIS What is a geographic information
Your web browser (Safari 7) is out of date. For more security, comfort and Activityengage the best experience on this site: Update your browser Ignore Introduction to GIS What is a geographic information
The benefits of visualization - how to explore a municipality
 Int. Statistical Inst.: Proc. 58th World Statistical Congress, 2011, Dublin (Session STS019) p.2487 The benefits of visualization - how to explore a municipality Haldorson, Marie Statistics Sweden 701
Eurostat Business Cycle Clock (BCC): A user's guide
: A user's guide") EUROPEAN COMMISSION EUROSTAT Directorate C: National Accounts, Prices and Key Indicators Unit C-1: National accounts methodology. Indicators ESTAT.C.1 - National accounts methodology/indicators Eurostat
EUROPEAN COMMISSION EUROSTAT Directorate C: National Accounts, Prices and Key Indicators Unit C-1: National accounts methodology. Indicators ESTAT.C.1 - National accounts methodology/indicators Eurostat
M E R C E R W I N WA L K T H R O U G H
 H E A L T H W E A L T H C A R E E R WA L K T H R O U G H C L I E N T S O L U T I O N S T E A M T A B L E O F C O N T E N T 1. Login to the Tool 2 2. Published reports... 7 3. Select Results Criteria...
CentropeSTATISTICS Working Interactively with Cross-Border Statistic Data Clemens Beyer, Walter Pozarek, Manfred Schrenk
 Clemens Beyer, Walter Pozarek, Manfred Schrenk (Dipl.-Ing. Clemens Beyer, CEIT ALANOVA, Concorde Business Park 2/F, 2320 Schwechat, Austria, c.beyer@ceit.at) (Dipl.-Ing. Walter Pozarek, PGO Planungsgemeinschaft
Map your way to deeper insights
 Map your way to deeper insights Target, forecast and plan by geographic region Highlights Apply your data to pre-installed map templates and customize to meet your needs. Select from included map files
Your World is not Red or Green. Good Practice in Data Display and Dashboard Design
 Your World is not Red or Green Good Practice in Data Display and Dashboard Design References Tufte, E. R. (2). The visual display of quantitative information (2nd Ed.). Cheshire, CT: Graphics Press. Few,
Introduction to ArcMap
 Introduction to ArcMap ArcMap ArcMap is a Map-centric GUI tool used to perform map-based tasks Mapping Create maps by working geographically and interactively Display and present Export or print Publish
Techniques for Science Teachers: Using GIS in Science Classrooms.
 Techniques for Science Teachers: Using GIS in Science Classrooms. After ESRI, 2008 GIS A Geographic Information System A collection of computer hardware, software, and geographic data used together for
Web Visualization of Geo-Spatial Data using SVG and VRML/X3D
 Web Visualization of Geo-Spatial Data using SVG and VRML/X3D Jianghui Ying Falls Church, VA 22043, USA jying@vt.edu Denis Gračanin Blacksburg, VA 24061, USA gracanin@vt.edu Chang-Tien Lu Falls Church,
Transportation and Logistics Planning and Development Mapping Tool
 Transportation and Logistics Planning and Development Mapping Tool Doreen Gonzales-Gaboyan Business Development and Outreach Center for Innovation through Visualization and Simulation (CIVS) Purdue University
Implementation and Optimization Issues of the ROLAP Algebra
 General Research Report Implementation and Optimization Issues of the ROLAP Algebra F. Ramsak, M.S. (UIUC) Dr. V. Markl Prof. R. Bayer, Ph.D. Contents Motivation ROLAP Algebra Recap Optimization Issues
Globally Estimating the Population Characteristics of Small Geographic Areas. Tom Fitzwater
 Globally Estimating the Population Characteristics of Small Geographic Areas Tom Fitzwater U.S. Census Bureau Population Division What we know 2 Where do people live? Difficult to measure and quantify.
The production and use of a hydrographic flow-direction network of surface waters. Rickard HALLENGREN, Håkan OLSSON and Erik SISELL, Sweden
 The production and use of a hydrographic flow-direction network of surface waters Rickard HALLENGREN, Håkan OLSSON and Erik SISELL, Sweden Key words: hydrographic, flow-direction network, surface waters
OneStop Map Viewer Navigation
 OneStop Map Viewer Navigation» Intended User: Industry Map Viewer users Overview The OneStop Map Viewer is an interactive map tool that helps you find and view information associated with energy development,
How to Make or Plot a Graph or Chart in Excel
 This is a complete video tutorial on How to Make or Plot a Graph or Chart in Excel. To make complex chart like Gantt Chart, you have know the basic principles of making a chart. Though I have used Excel
INTRODUCTION TO ARCGIS Version 10.*
 Week 3 INTRODUCTION TO ARCGIS Version 10.* topics of the week Overview of ArcGIS Using ArcCatalog Overview of ArcGIS Desktop ArcGIS Overview Scalable desktop applications ArcView ArcEditor ArcInfo ArcGIS
Version 1.1 GIS Syllabus
 GEOGRAPHIC INFORMATION SYSTEMS CERTIFICATION Version 1.1 GIS Syllabus Endorsed 1 Version 1 January 2007 GIS Certification Programme 1. Target The GIS certification is aimed at: Those who wish to demonstrate
Geovisualization. Luc Anselin. Copyright 2016 by Luc Anselin, All Rights Reserved
 Geovisualization Luc Anselin http://spatial.uchicago.edu from EDA to ESDA from mapping to geovisualization mapping basics multivariate EDA primer From EDA to ESDA Exploratory Data Analysis (EDA) reaction
Smart Data Collection and Real-time Digital Cartography
 Smart Data Collection and Real-time Digital Cartography Yuji Murayama and Ko Ko Lwin Division of Spatial Information Science Faculty of Life and Environmental Sciences University of Tsukuba IGU 2013 1
APHuG Vocabulary: Chapter 1 Basic Concepts
 APHuG Vocabulary: Chapter 1 Basic Concepts Directions: In the spaces provided, write a definition in your own words and identify a real-world (or reasonable potential real) example for each term. Attach
Thieme Chemistry E-Books
 www.thieme-connect.com/chemistry-ebooks Thieme Chemistry E-Books SERIES Science of Synthesis Houben-Weyl MONOGRAPHS Protecting Groups Spectroscopic Methods Synthetic Methods of Organometallic and Inorganic
Skin Damage Visualizer TiVi60 User Manual
 Skin Damage Visualizer TiVi60 User Manual PIONEERS IN TISSUE VIABILITY IMAGING User Manual 3.2 Version 3.2 October 2013 Dear Valued Customer! TiVi60 Skin Damage Visualizer Welcome to the WheelsBridge Skin
Maps as Tools for Visual Analysis of Geospatial Data. Dr. Claus Rinner Department of Geography and Environmental Studies Ryerson University
 Maps as Tools for Visual Analysis of Geospatial Data Dr. Claus Rinner Department of Geography and Environmental Studies Ryerson University 1 Geography and data analytics 80% of all datasets are said to
Write a report (6-7 pages, double space) on some examples of Internet Applications. You can choose only ONE of the following application areas:
 on some examples of Internet Applications. You can choose only ONE of the following application areas:") UPR 6905 Internet GIS Homework 1 Yong Hong Guo September 9, 2008 Write a report (6-7 pages, double space) on some examples of Internet Applications. You can choose only ONE of the following application
UPR 6905 Internet GIS Homework 1 Yong Hong Guo September 9, 2008 Write a report (6-7 pages, double space) on some examples of Internet Applications. You can choose only ONE of the following application
CHAPTER 4: DATASETS AND CRITERIA FOR ALGORITHM EVALUATION
 CHAPTER 4: DATASETS AND CRITERIA FOR ALGORITHM EVALUATION 4.1 Overview This chapter contains the description about the data that is used in this research. In this research time series data is used. A time
The ESPON Programme. Goals Main Results Future
 The ESPON Programme Goals Main Results Future Structure 1. Goals Objectives and expectations Participation, organisation and networking Themes addressed in the applied research undertaken in ESPON projects
- Towards new concepts for handling geoinformation
 - Towards new concepts for handling geoinformation Centre for 3D Geoinformation Aalborg University Denmark Outline 1. Introduction 2. Digital Northern Jutland in DK 3. Cente for 3D geoinformation 4. Drivers
1-8 Scatter Plots. Learn to display and analyze data in scatter plots. Course 2
 Learn to display and analyze data in scatter plots. Vocabulary scatter plot positive correlation negative correlation no correlation To find out if two sets of data may be related, you can make a scatter
Big Data Discovery and Visualisation Insights for ArcGIS
 Big Data Discovery and Visualisation Insights for ArcGIS Create Enrich - Collaborate Lee Kum Cheong GIS CONVERSATIONS At Esri, we believe people can do amazing things with applied geography. GIS CONVERSATIONS
Gis Unit TropMed Mahidol U.
 Gis Unit TropMed Mahidol U. Database Information System Database Concepts 1. Non-Spatial Database table, document.. 2. Spatial Database locational databases (geographic) + attribute databases Gis Unit
Enterprise Integration of Autodesk MapGuide at the City of Vancouver
 11/30/2005-8:00 am - 9:30 am Room:Toucan 1 (Swan) Walt Disney World Swan and Dolphin Resort Orlando, Florida Enterprise Integration of Autodesk MapGuide at the City of Vancouver Jonathan Mark - City of
CHAPTER 2: KEY ISSUE 1 Where Is the World s Population Distributed? p
 CHAPTER 2: KEY ISSUE 1 Where Is the World s Population Distributed? p. 45-49 Always keep your vocabulary packet out whenever you take notes. As the term comes up in the text, add to your examples for the
METHODS FOR STATISTICS
 DYNAMIC CARTOGRAPHIC METHODS FOR VISUALIZATION OF HEALTH STATISTICS Radim Stampach M.Sc. Assoc. Prof. Milan Konecny Ph.D. Petr Kubicek Ph.D. Laboratory on Geoinformatics and Cartography, Department of
Your Virtual Workforce. On Demand. Worldwide. COMPANY PRESENTATION. clickworker GmbH 2017
 Your Virtual Workforce. On Demand. Worldwide. COMPANY PRESENTATION 2017 CLICKWORKER AT A GLANCE Segment: Paid Crowdsourcing / Microtasking Services: Text Creation (incl. SEO Texts), AI-Training Data, Internet
Chapter 5. Presenting Data
 Chapter 5. Presenting Data Copyright McGraw-Hill Education. Permission required for reproduction or display. 5-1 Basic principles of map design 5-2 1 Map Design Process 5-3 The map objective The first
Coordination of Infrastructure Projects with GIS and SharePoint
 Coordination of Infrastructure Projects with GIS and SharePoint Markus Schenardi Geocom Informatik AG Munich, October 24, 2013 2013 Esri Europe, Middle East and Africa User Conference October 23-25, 2013
Theory, Concepts and Terminology
 GIS Workshop: Theory, Concepts and Terminology 1 Theory, Concepts and Terminology Suggestion: Have Maptitude with a map open on computer so that we can refer to it for specific menu and interface items.
GIS CONCEPTS ARCGIS METHODS AND. 2 nd Edition, July David M. Theobald, Ph.D. Natural Resource Ecology Laboratory Colorado State University
 GIS CONCEPTS AND ARCGIS METHODS 2 nd Edition, July 2005 David M. Theobald, Ph.D. Natural Resource Ecology Laboratory Colorado State University Copyright Copyright 2005 by David M. Theobald. All rights
THE SPATIAL DATA WAREHOUSE OF SEOUL
 THE SPATIAL DATA WAREHOUSE OF SEOUL Jae-Ho Han The Seoul Metropolitan Government Seoul City Hall, Taepyeongno 1(il)-ga, Jung-gu, Seoul 100-744, Korea djhjha@hanmail.net Impyeong Lee Dept. of Geoinformatics,
2010 Oracle Corporation 1
 1 Map Views in Oracle Business Intelligence Enterprise Edition, 11g Abhinav Agarwal Jayant Sharma Consulting Product Manager, OBIEE Director, Prod. Mgmt., Oracle Spatial THE FOLLOWING
Brian D. George. GIMS Specialist Ohio Coastal Atlas Project Coordinator and Cartographer. Impacts and Outcomes of Mature Coastal Web Atlases
 Ohio Coastal Atlas Project Brian D. George GIMS Specialist Ohio Coastal Atlas Project Coordinator and Cartographer Ohio Department of Natural Resources Office of Coastal Management Sandusky, OH Impacts
Welcome! Power BI User Group (PUG) Copenhagen
 Copenhagen") Welcome! Power BI User Group (PUG) Copenhagen Making Maps in Power BI Andrea Martorana Tusa BI Specialist Welcome to Making maps in Power BI Who am I? First name: Andrea. Last name: Martorana Tusa. Italian,
Welcome! Power BI User Group (PUG) Copenhagen Making Maps in Power BI Andrea Martorana Tusa BI Specialist Welcome to Making maps in Power BI Who am I? First name: Andrea. Last name: Martorana Tusa. Italian,
Essential Maths Skills. for AS/A-level. Geography. Helen Harris. Series Editor Heather Davis Educational Consultant with Cornwall Learning
 Essential Maths Skills for AS/A-level Geography Helen Harris Series Editor Heather Davis Educational Consultant with Cornwall Learning Contents Introduction... 5 1 Understanding data Nominal, ordinal and
Data Aggregation with InfraWorks and ArcGIS for Visualization, Analysis, and Planning
 CI125230 Data Aggregation with InfraWorks and ArcGIS for Visualization, Analysis, and Planning Stephen Brockwell Brockwell IT Consulting Inc. Sean Kinahan Brockwell IT Consulting Inc. Learning Objectives
Visualizing Geospatial Graphs
 Visualizing Geospatial Graphs An introduction to visualizing geospatial graph data with KeyLines Geospatial www.cambridge-intelligence.com USA: +1 (775) 842-6665 UK: +44 (0)1223 362 000 Cambridge Intelligence
Fundamentals of ArcGIS Desktop Pathway
 Fundamentals of ArcGIS Desktop Pathway Table of Contents ArcGIS Desktop I: Getting Started with GIS 3 ArcGIS Desktop II: Tools and Functionality 5 Understanding Geographic Data 8 Understanding Map Projections
Are You Maximizing The Value Of All Your Data?
 Are You Maximizing The Value Of All Your Data? Using The SAS Bridge for ESRI With ArcGIS Business Analyst In A Retail Market Analysis SAS and ESRI: Bringing GIS Mapping and SAS Data Together Presented
North-South Gap Mapping Assignment Country Classification / Statistical Analysis
 North-South Gap Mapping Assignment Country Classification / Statistical Analysis Due Date: (Total Value: 55 points) Name: Date: Learning Outcomes: By successfully completing this assignment, you will be
Nigerian Capital Importation QUARTER THREE 2016
 Nigerian Capital Importation QUARTER THREE 2016 _ November 2016 Capital Importation Data The data on Capital Importation used in this report was obtained from the Central Bank of Nigeria (CBN). The data
An area chart emphasizes the trend of each value over time. An area chart also shows the relationship of parts to a whole.
 Excel 2003 Creating a Chart Introduction Page 1 By the end of this lesson, learners should be able to: Identify the parts of a chart Identify different types of charts Create an Embedded Chart Create a
Bathing water results 2011 Slovakia
 Bathing water results Slovakia 1. Reporting and assessment This report gives a general overview of water in Slovakia for the season. Slovakia has reported under the Directive 2006/7/EC since 2008. When
Desktop GIS for Geotechnical Engineering
 Desktop GIS for Geotechnical Engineering Satya Priya Deputy General Manager (Software) RMSI, A-7, Sector 16 NOIDA 201 301, UP, INDIA Tel: +91-120-2511102 Fax: +91-120-2510963 Email: Satya.Priya@rmsi.com
Descriptive Statistics
 Descriptive Statistics CHAPTER OUTLINE 6-1 Numerical Summaries of Data 6- Stem-and-Leaf Diagrams 6-3 Frequency Distributions and Histograms 6-4 Box Plots 6-5 Time Sequence Plots 6-6 Probability Plots Chapter
About peer review missions related to data management
 PEER REVIEW WORKSHOP ABOUT DATA MANAGEMENT Introduction Paul HAENER International Office for Water FRANCE p.haener@oieau.fr October 2016 About peer review missions related to data management 2 1 Data management
Innovation in Land Management: Integrated Solutions For National Cadastre Projects
 Success With GIS Innovation in Land Management: Integrated Solutions For National Cadastre Projects XXIII International FIG Congress Munich These documents are only complete, when used in connection with
Re-Mapping the World s Population
 Re-Mapping the World s Population Benjamin D Hennig 1, John Pritchard 1, Mark Ramsden 1, Danny Dorling 1, 1 Department of Geography The University of Sheffield SHEFFIELD S10 2TN United Kingdom Tel. +44
Study Guide Unit 6 Economics and Development
 Name Period Study Guide Unit 6 Economics and Development When you are asked to sketch maps, please put a key so that you can remember what the colors mean! Chapter 9: Development How does the author introduce
My Map Activity MINNESOTA SOCIAL STUDIES STANDARDS & BENCHMARKS
 My Map Activity OVERVIEW & OBJECTIVES Students will learn the basics of Google Maps while using geospatial data to create their neighborhood map with the places they spend time. They will also collect
NMR Predictor. Introduction
 NMR Predictor This manual gives a walk-through on how to use the NMR Predictor: Introduction NMR Predictor QuickHelp NMR Predictor Overview Chemical features GUI features Usage Menu system File menu Edit
EYE-TRACKING TESTING OF GIS INTERFACES
 Geoinformatics EYE-TRACKING TESTING OF GIS INTERFACES Bc. Vaclav Kudelka Ing. Zdena Dobesova, Ph.D. Department of Geoinformatics, Palacký University, Olomouc, Czech Republic ABSTRACT Eye-tracking is currently
ArcGIS & Extensions - Synergy of GIS tools. Synergy. Analyze & Visualize
 Using ArcGIS Extensions to Analyze and Visualize data Colin Childs 1 Topics Objectives Synergy Analysis & Visualization ArcGIS Analysis environments Geoprocessing tools Extensions ArcMap The analysis Process
Google Maps and Beyond
 Google Maps and Beyond Aaron Paul First American Title apaul@firstam.com 2015 APRA Symposium Association of Professional Reserve Analysts May 2 nd, 2015 Google Maps and Beyond - Overview Business case
Digital Cartography in the Royal Library - the National Library of Sweden
 LIBER QUARTERLY, ISSN 1435-5205 LIBER 1999. All rights reserved K.G. Saur, Munich. Printed in Germany Digital Cartography in the Royal Library - the National Library of Sweden by GÖRAN BÄÄRNHIELM Digital
Step-by-Step Procedure for Creating Customized BEx Maps
 Step-by-Step Procedure for Creating Customized BEx Maps Applies to: SAP BI or product release (release 701, level 0004, SAP EHP 1 for SAP NetWeaver 7.0). For more information, visit the Business Intelligence
OECD QSAR Toolbox v.3.4. Example for predicting Repeated dose toxicity of 2,3-dimethylaniline
 OECD QSAR Toolbox v.3.4 Example for predicting Repeated dose toxicity of 2,3-dimethylaniline Outlook Background Objectives The exercise Workflow Save prediction 2 Background This is a step-by-step presentation
Unit 1, Lesson 3 What Tools and Technologies Do Geographers Use?
 Unit 1, Lesson 3 What Tools and Technologies Do Geographers Use? Geographers use a variety of tools and technologies in investigating geographic questions. Maps and globes both represent the earth, but
Perinatal Mental Health Profile User Guide. 1. Using Fingertips Software
 Perinatal Mental Health Profile User Guide 1. Using Fingertips Software July 2017 Contents 1. Introduction... 3 2. Quick Guide to Fingertips Software Features... 3 2.1 Additional information... 3 2.2 Search
Vocabulary: Data About Us
 Vocabulary: Data About Us Two Types of Data Concept Numerical data: is data about some attribute that must be organized by numerical order to show how the data varies. For example: Number of pets Measure
Jim Fox. copyright UNC Asheville's NEMAC
 Decisions and System Thinking Jim Fox November, 2012 1 UNC Asheville s s NEMAC National Environmental Modeling and Analysis Center Applied Research and technology development on integration of environmental
Arboretum Explorer: Using GIS to map the Arnold Arboretum
 Arboretum Explorer: Using GIS to map the Arnold Arboretum Donna Tremonte, Arnold Arboretum of Harvard University 2015 Esri User Conference (UC), July 22, 2015 http://arboretum.harvard.edu/explorer Mission
2017 Scientific Ocean Drilling Bibliographic Database Report
 2017 Scientific Ocean Drilling Bibliographic Database Report Covering records related to the Deep Sea Drilling Project, Ocean Drilling Program, Integrated Ocean Drilling Program, and International Ocean
Data Sonification for Users with Visual Impairment: A Case Study with Geo-referenced Data. Haixia Zhao, Catherine Plaisant, Ben Shneiderman
 Data Sonification for Users with Visual Impairment: A Case Study with Geo-referenced Data Haixia Zhao, Catherine Plaisant, Ben Shneiderman University of Maryland Jonathan Lazar Towson University Data Sonification
Outline. 15. Descriptive Summary, Design, and Inference. Descriptive summaries. Data mining. The centroid
 Outline 15. Descriptive Summary, Design, and Inference Geographic Information Systems and Science SECOND EDITION Paul A. Longley, Michael F. Goodchild, David J. Maguire, David W. Rhind 2005 John Wiley
The Comprehensive Report
 High-Throughput Screening 2002: New Strategies and Technologies The Comprehensive Report Presented by HighTech Business Decisions 346 Rheem Blvd., Suite 208, Moraga, CA 94556 Tel: (925) 631-0920 Fax: (925)
GIS Test Drive What a Geographic Information System Is and What it Can Do. Alison Davis-Holland
 GIS Test Drive What a Geographic Information System Is and What it Can Do Alison Davis-Holland adavisholland@gmail.com WHO AM I? Geospatial Analyst M.S. in Geographic and Cartographic Sciences Use GIS
GENERAL RECOMMENDATIONS. Session 7. Breakout discussion. discuss on regional and interregional. proposals 1. COLLABORATION BETWEEN PROGRAMMES
 Session 7 24 July 2016, 9.00-11.00 Breakout discussion on regional and interregional joint project proposals Mr Shahbaz Khan summarized the two days of presentations and exchanges and requested the participants
Forecasting Practice: Decision Support System to Assist Judgmental Forecasting
 Forecasting Practice: Decision Support System to Assist Judgmental Forecasting Gauresh Rajadhyaksha Dept. of Electrical and Computer Engg. University of Texas at Austin Austin, TX 78712 Email: gaureshr@mail.utexas.edu
Planning Softproviding Meat User Documentation
 Great ideas are always simple Softproviding simply makes them happen. Planning Softproviding Meat User Documentation Version: 1.00 Date: 24 August 2017 Release: v5.50 Softproviding AG Riehenring 175 CH-4058
Scottish Atlas of Variation
 Scottish Atlas of Variation User Guide March 2019 Contents Introduction... 3 Accessing the Atlas of Variation... 3 Dashboard... 4 Introduction... 4 Drop-down menus... 5 Explore icon... 5 Information icons...
Baltic 2030: Bumps on the Road
 Sven Beyersdorff June 14th 2018 Baltic 2030: Bumps on the Road - How the Baltic Sea States are performing on the SDGs Aims of report Why did we do this? Understand performance of 11 countries in the Baltic
1 st Six Weeks # of Days. Unit # and Title Unit 1 Geography Overview
 1 st Six Weeks # of Days Unit # and Title Unit 1 Geography Overview Orange Grove ISD Instructional Planning Information and Process Standards The Process Standards Must Be Included in Each Unit # of Class
From Practical Data Analysis with JMP, Second Edition. Full book available for purchase here. About This Book... xiii About The Author...
 From Practical Data Analysis with JMP, Second Edition. Full book available for purchase here. Contents About This Book... xiii About The Author... xxiii Chapter 1 Getting Started: Data Analysis with JMP...
Combining Geospatial and Statistical Data for Analysis & Dissemination
 Combining Geospatial and Statistical Data for Analysis & Dissemination (with Special Reference to Qatar Census 2010) Presentation by Mansoor Al Malki, Director of IT Department Qatar Statistics Authority
New NC in the Global Economy (NCGE) Features
 Features") New NC in the Global Economy (NCGE) Features Forum on North Carolina in the Global Economy April 21, 2014 Stacey Frederick Center on Globalization, Governance & Competitiveness (CGGC) NC in the Global
New NC in the Global Economy (NCGE) Features Forum on North Carolina in the Global Economy April 21, 2014 Stacey Frederick Center on Globalization, Governance & Competitiveness (CGGC) NC in the Global
Making Maps With GIS. Making Maps With GIS
 Making Maps With GIS Getting Started with GIS Chapter 7 Making Maps With GIS 7.1 The Parts of a Map 7.2 Choosing a Map Type 7.3 Designing the Map 1 What is a map? Map is the communication tool for the
GED 554 IT & GIS. Lecture 6 Exercise 5. May 10, 2013
 GED 554 IT & GIS Lecture 6 Exercise 5 May 10, 2013 Free GIS data sources ******************* Mapping numerical data & Symbolization ******************* Exercise: Making maps for presentation GIS DATA SOFTWARE
Spatial Data Availability Energizes Florida s Citizens
 NASCIO 2016 Recognition Awards Nomination Spatial Data Availability Energizes Florida s Citizens State of Florida Agency for State Technology & Department of Environmental Protection Category: ICT Innovations
Understanding Interlinked Data
 Understanding Interlinked Data Visualising, Exploring, and Analysing Ontologies Olaf Noppens and Thorsten Liebig (Ulm University, Germany olaf.noppens@uni-ulm.de, thorsten.liebig@uni-ulm.de) Abstract Companies
Overview. Everywhere. Over everything.
 Cadenza Desktop Cadenza Web Cadenza Mobile Cadenza Overview. Everywhere. Over everything. The ultimate GIS and reporting suite. Provide, analyze and report data efficiently. For desktop, web and mobile.
One platform for desktop, web and mobile
 One platform for desktop, web and mobile Search and filter Get access to all data thematically filter data in context factually and spatially as well as display it dynamically. Export a selection or send
Evaluating e-government : implementing GIS services in Municipality
 Evaluating e-government : implementing GIS services in Municipality Municipality of Thessaloniki - G.I.S. Unit Misirloglou Symeon Head of the GIS Unit ESRI UC - 2016 The GIS Section - subset of the department
Lecture 3: Exploratory Spatial Data Analysis (ESDA) Prof. Eduardo A. Haddad
 Prof. Eduardo A. Haddad") Lecture 3: Exploratory Spatial Data Analysis (ESDA) Prof. Eduardo A. Haddad Key message Spatial dependence First Law of Geography (Waldo Tobler): Everything is related to everything else, but near things
Lecture 3: Exploratory Spatial Data Analysis (ESDA) Prof. Eduardo A. Haddad Key message Spatial dependence First Law of Geography (Waldo Tobler): Everything is related to everything else, but near things
Book Review: A Social Atlas of Europe
 Book Review: A Social Atlas of Europe Ferreira, J Author post-print (accepted) deposited by Coventry University s Repository Original citation & hyperlink: Ferreira, J 2015, 'Book Review: A Social Atlas
Lecture 9: Reference Maps & Aerial Photography
 Lecture 9: Reference Maps & Aerial Photography I. Overview of Reference and Topographic Maps There are two basic types of maps? Reference Maps - General purpose maps & Thematic Maps - maps made for a specific
Boyle s Law: A Multivariable Model and Interactive Animated Simulation
 Boyle s Law: A Multivariable Model and Interactive Animated Simulation Using tools available in Excel, we will turn a multivariable model into an interactive animated simulation. Projectile motion, Boyle's