Your World is not Red or Green. Good Practice in Data Display and Dashboard Design
|
|
|
- Marion Cummings
- 6 years ago
- Views:
Transcription
1 Your World is not Red or Green Good Practice in Data Display and Dashboard Design
. Burlingame, CA: Analytics Press. Few, S (29).")
2 References Tufte, E. R. (2). The visual display of quantitative information (2nd Ed.). Cheshire, CT: Graphics Press. Few, S. (22). Show me the numbers: Designing tables and graphs to enlighten (2nd Ed.). Burlingame, CA: Analytics Press. Few, S (29). Now you see it: Simple visualization techniques for quantitative analysis. Oakland, CA: Analytics Press.
3 Why This Presentation? Many projects in different organizations Many presentations of data Many dashboard designs A lot of ineffective ones Poor visualization No consideration of users perceptions or capacity for understanding A lot of bad use of data Ineffective Misleading Harmful
4 An Example One indicator, discussed weekly at a meeting of executives and managers at a big telecomm: This Week MTD YTD Target CSM This week, we celebrated! This Week MTD YTD Target CSM This week, much wailing and gnashing of teeth
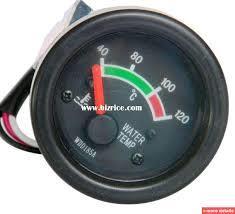
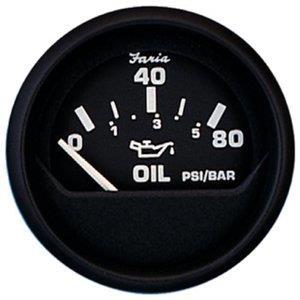
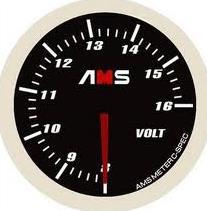
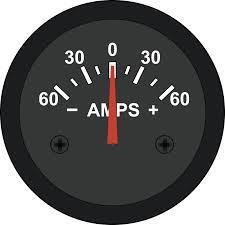


5 Indicators Gauges v Idiot Lights
6 Why the Idiot Lights? In 2, a study by EMC Corporation found that the world s information was doubling every two years Estimated that.8 million zetabytes would be created and replicated in 2 2 billion HD movies Fill enough ipads to build the Great ipad Wall of China twice the height of the original; or build a mountain of ipads 25x higher than Mt. Fuji Source:
7 Every Minute in 22: 57 new websites were created The Web picked up 27 new users YouTube users uploaded 48 hours of video users sent 24,66,667 messages Google received over 2,, search queries Facebook Users shared 684,478 items Flikr& Instagram users added 6,625 new photos Tumblr Bloggers published 27,778 new posts Apple received about 47, app downloads Twitter users sent over, tweets Source:
8 That was 22! In 23, a study by IBM estimated that 9% of all the data existing in the world had been generated within the past two years! That rate has held; we generate 2.5 quintillion bits of data per day.
9 We re Up to our Eyeballs in Data!
10 What s Needed? A way to make sense of the data Data + Analysis = Information Information + Display = Communication Goals: Understanding Better Decisions The purpose of analysis is insight!
11 Visual Perception Facts We do not attend to everything we see. Visual perception is selective. Our eyes are drawn to familiar patterns. We see what we know and expect. Memory plays an important role in human cognition, but working memory is extremely limited Few, S. (29). Now You See It: Simple Visualization Techniques for Quantitative Analysis. Oakland, CA:
12 Pre-attention Some aspects of the world are perceived pre-attentively; i.e., we don t have to think about them to see them.
13 Pre-Attentive Attributes For Precision with Quantitative Measures: Longer = Greater Higher or Farther to the Right = Greater Adapted from Few, S. (29). Now You See It: Simple Visualization Techniques for Quantitative Analysis. Oakland, CA
14 Sales (in Millions) Comparisons Across Categories Sales by Region Category Northeast West Coast Southeast Midwest Southwest Deep South Hawaii-Alaska 9 8 Sales by Region Region Northeast West Coast Southeast Midwest Southwest Deep South Hawaii-Alaska Sales Percent

15 Another Pie Chart


16 Bad Bar Better Chart Bar Chart
17
18 Time Series We analyze time series is to discover trends, or behavior over time The purpose: to try to predict, based on past behavior, what might happen in the future As with everything else, there are effective ways to gain this insight, and ineffective ways Remember: Working memory can only hold so much
19 Total Volume One Way Sales Volume, Year Month Jan Feb Mar Apr May Jun Jul Aug Sep Oct Nov Dec

20 Another Way

21 A Little Cleaner

22 Cleaner Yet
23 What About Tables? Op Op Op Op
24 Data Line Graph Op, Op 2 2 Variable Op Op Hour
25 Cycle Time More Operators Cycle Time: Op, Op 2, Op 3, Op Variable Op Op 2 Op 3 Op Hour
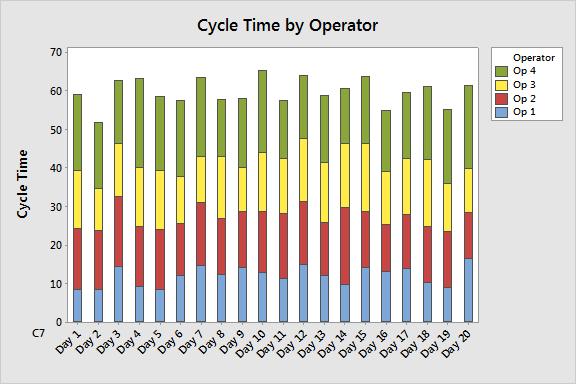
26 Cycle Time No Help Cycle Time by Operator 25 2 Operator Op Op 2 Op 3 Op Hour
27 No Help
28 Cycle Time A Different View Cycle Time by Operator 25 2 Operator Op Op 2 Op 3 Op Hour

29 Cycle Time With Color Cycle Time by Operator 25 2 Operator Op Op 2 Op 3 Op Index
30 Cycle Time No Help Cycle Time by Operator 25 2 Operator Op Op 2 Op 3 Op Hour Operator Op Op 2 Op 3 Op 4
31 Cycle Time Clearer Cycle Time by Operator 25 2 Operator Op Op 2 Op 3 Op Index

32 Clearer Still
33 Back to Tables for a Minute Table 5: Quarterly Sales Volumes, Fourth Quarter, Year Five Region Sales Volumes Percent Change from Last Quarter Percent Change from Same Quarter Last Year Performance Index Region A % very good 2.6% very good ++++ Region C 337.7% good.8% very good +++ Region B % very good -8.2% bad + Region F % bad 4.7% good Region D % bad -2.6% bad Region E % very bad -22.3% very bad , SPC Press. Used by Permission
34 Region D Summary Last Quarter Last Year Now 2, SPC Press. Used by Permission
35 W&P 49 Quarterly Sales for Region D , SPC Press. Used by Permission
36 Region D, Trended Limits / /-93.5 Trend: +3.7 Units/Quarter 2, SPC Press. Used by Permission W&P 5
37 Red-Green Again This Week MTD YTD Target CSM
38 Moving Range Individual Value The Real Story Weekly Score UCL=36.29 _ X= LCL=7.27 /4/2 3/ 5/2 5/24/2 8/2/2 / /2 2/2/2 2/28/2 5/9/2 7/ 8/2 9/26/2 2/5/2 Week of UCL=.68 MR=3.58 LCL= /4/2 3/ 5/2 5/24/2 8/2/2 / /2 2/2/2 2/28/2 5/9/2 7/ 8/2 9/26/2 2/5/2 Week of
39 The Real Story We can confidently predict much wailing and gnashing of teeth, without significant management action
40
41 The Real Story For two years, the system had been stable They had top weekly net promoter scores from 7.3% to 36.3% of their customers (closer to 26.8% than farther away) Without action, they would continue to see about 65 weeks out of with a Red indicator So how useful is this? This Week MTD YTD Target CSM
42 Can They Be Useful? YES!
GAMINGRE 8/1/ of 7
 FYE 09/30/92 JULY 92 0.00 254,550.00 0.00 0 0 0 0 0 0 0 0 0 254,550.00 0.00 0.00 0.00 0.00 254,550.00 AUG 10,616,710.31 5,299.95 845,656.83 84,565.68 61,084.86 23,480.82 339,734.73 135,893.89 67,946.95
Improve Forecasts: Use Defect Signals
 Improve Forecasts: Use Defect Signals Paul Below paul.below@qsm.com Quantitative Software Management, Inc. Introduction Large development and integration project testing phases can extend over many months
Day Length Web Activity
 Day Length We Activity SAMPLE Name: Follow the directions for each section and type your answers on a separate sheet of paper. Use TI-Graph Link or TI Inter Active! to present your data and models you
Computing & Telecommunications Services
 Computing & Telecommunications Services Monthly Report September 214 CaTS Help Desk (937) 775-4827 1-888-775-4827 25 Library Annex helpdesk@wright.edu www.wright.edu/cats/ Table of Contents HEAT Ticket
Computing & Telecommunications Services Monthly Report January CaTS Help Desk. Wright State University (937)
") January 215 Monthly Report Computing & Telecommunications Services Monthly Report January 215 CaTS Help Desk (937) 775-4827 1-888-775-4827 25 Library Annex helpdesk@wright.edu www.wright.edu/cats/ Last
January 215 Monthly Report Computing & Telecommunications Services Monthly Report January 215 CaTS Help Desk (937) 775-4827 1-888-775-4827 25 Library Annex helpdesk@wright.edu www.wright.edu/cats/ Last
Sluggish Economy Puts Pinch on Manufacturing Technology Orders
 Updated Release: June 13, 2016 Contact: Penny Brown, AMT, 703-827-5275 pbrown@amtonline.org Sluggish Economy Puts Pinch on Manufacturing Technology Orders Manufacturing technology orders for were down
Mr. XYZ. Stock Market Trading and Investment Astrology Report. Report Duration: 12 months. Type: Both Stocks and Option. Date: Apr 12, 2011
 Mr. XYZ Stock Market Trading and Investment Astrology Report Report Duration: 12 months Type: Both Stocks and Option Date: Apr 12, 2011 KT Astrologer Website: http://www.softwareandfinance.com/magazine/astrology/kt_astrologer.php
Monitoring Platelet Issues - a novel approach CUSUM. Clive Hyam Blood Stocks Management Scheme London
 Monitoring Platelet Issues - a novel approach CUSUM Clive Hyam Blood Stocks Management Scheme London Overview of Presentation What s driving the need to better understand platelet issues Potential tools
SPECIMEN. Date Morning/Afternoon. A Level Geography H481/01 Physical systems Sample Question Paper. Time allowed: 1 hour 30 minutes PMT
 Oxford Cambridge and RSA A Level Geography H481/01 Physical systems Sample Question Paper Date Morning/Afternoon Time allowed: 1 hour 30 minutes You must have: the Resource Booklet the OCR 12-page Answer
Tracking Accuracy: An Essential Step to Improve Your Forecasting Process
 Tracking Accuracy: An Essential Step to Improve Your Forecasting Process Presented by Eric Stellwagen President & Co-founder Business Forecast Systems, Inc. estellwagen@forecastpro.com Business Forecast
Visual Display of Information
 Visual Display of Information XKCD Edward Tufte Charles Joseph Minard s dramatic account of Napoleon's Russian campaign of 1812 (drawn in 1861) 1, men arrived in Moscow 422, men started the journey to
REPORT ON LABOUR FORECASTING FOR CONSTRUCTION
 REPORT ON LABOUR FORECASTING FOR CONSTRUCTION For: Project: XYZ Local Authority New Sample Project Contact us: Construction Skills & Whole Life Consultants Limited Dundee University Incubator James Lindsay
GRADE 6 GEOGRAPHY TERM 1 LATITUDE AND LONGITUDE (degrees)
") 1 GRADE 6 GEOGRAPHY TERM 1 LATITUDE AND LONGITUDE (degrees) Contents Lines of Latitude... 2 Lines of Longitude... 3 The hemispheres of The Earth... 4 Finding countries and cities on a map using latitude
1 GRADE 6 GEOGRAPHY TERM 1 LATITUDE AND LONGITUDE (degrees) Contents Lines of Latitude... 2 Lines of Longitude... 3 The hemispheres of The Earth... 4 Finding countries and cities on a map using latitude
ENGINE SERIAL NUMBERS
 ENGINE SERIAL NUMBERS The engine number was also the serial number of the car. Engines were numbered when they were completed, and for the most part went into a chassis within a day or so. However, some
2. Graphing Practice. Warm Up
 2. Graphing Practice In this worksheet you will practice graphing and use your graphs to interpret and analyze data. The first three questions are warm-up questions; complete this section before moving
February 5, 2018 START HERE. measurement scale. Means. number of means. independent measures t-test Ch dependent measures t-test Ch 16.
 χ Test for Frequencies February 5, 018 Contents Chi squared (χ ) test for frequencies Example 1: left vs right handers in our class The χ distribution One or two tailed? Example : Birthdays by month Using
Mountain View Community Shuttle Monthly Operations Report
 Mountain View Community Shuttle Monthly Operations Report December 6, 2018 Contents Passengers per Day, Table...- 3 - Passengers per Day, Chart...- 3 - Ridership Year-To-Date...- 4 - Average Daily Ridership
The science of learning from data.
 STATISTICS (PART 1) The science of learning from data. Numerical facts Collection of methods for planning experiments, obtaining data and organizing, analyzing, interpreting and drawing the conclusions
Lecture Prepared By: Mohammad Kamrul Arefin Lecturer, School of Business, North South University
 Lecture 15 20 Prepared By: Mohammad Kamrul Arefin Lecturer, School of Business, North South University Modeling for Time Series Forecasting Forecasting is a necessary input to planning, whether in business,
Time series and Forecasting
 Chapter 2 Time series and Forecasting 2.1 Introduction Data are frequently recorded at regular time intervals, for instance, daily stock market indices, the monthly rate of inflation or annual profit figures.
Four Basic Steps for Creating an Effective Demand Forecasting Process
 Four Basic Steps for Creating an Effective Demand Forecasting Process Presented by Eric Stellwagen President & Cofounder Business Forecast Systems, Inc. estellwagen@forecastpro.com Business Forecast Systems,
In this activity, students will compare weather data from to determine if there is a warming trend in their community.
 Overview: In this activity, students will compare weather data from 1910-2000 to determine if there is a warming trend in their community. Objectives: The student will: use the Internet to locate scientific
PRACTICE FOR PLACEMENT EXAM PART A
 PRACTICE FOR PLACEMENT EXAM PART A For students trying to place into: MAT 099, Intermediate Algebra MAT 000, Mathematics in Today s World MAT 00, Algebra with Trigonometry Problems - are based on Arithmetic
Load Forecasting Technical Workshop. January 30, 2004
 Load Forecasting Technical Workshop January 30, 2004 Agenda New Commercial Survey Results (20 Minutes) Changing Commercial Saturation s (20 Minutes) Conditional Demand Analysis (30 Minutes) Changing Commercial
2013 Tide Newsletter and occasionally by much more. What's more,
 The Official Newsletter for the Nor easters Metal Detecting Club! Tide s Ed it io n HTTP://WWW.NOR EASTER S.NET Year ly Ti des for 2013 The Metal Detecting Creed By Jessie Thompson We are Metal Detectorists.
χ 2 Test for Frequencies January 15, 2019 Contents
 χ 2 Test for Frequencies January 15, 2019 Contents Chi squared (χ 2 ) test for frequencies Example 1: left vs right handers in our class The χ 2 distribution One or two tailed? Example 2: Birthdays by
Sales Analysis User Manual
 Sales Analysis User Manual Confidential Information This document contains proprietary and valuable, confidential trade secret information of APPX Software, Inc., Richmond, Virginia Notice of Authorship
Determine the trend for time series data
 Extra Online Questions Determine the trend for time series data Covers AS 90641 (Statistics and Modelling 3.1) Scholarship Statistics and Modelling Chapter 1 Essent ial exam notes Time series 1. The value
WIND DATA REPORT FOR THE YAKUTAT JULY 2004 APRIL 2005
 WIND DATA REPORT FOR THE YAKUTAT JULY 2004 APRIL 2005 Prepared on July 12, 2005 For Bob Lynette 212 Jamestown Beach Lane Sequim WA 98382 By John Wade Wind Consultant LLC 2575 NE 32 nd Ave Portland OR 97212
Monthly Long Range Weather Commentary Issued: APRIL 18, 2017 Steven A. Root, CCM, Chief Analytics Officer, Sr. VP,
 Monthly Long Range Weather Commentary Issued: APRIL 18, 2017 Steven A. Root, CCM, Chief Analytics Officer, Sr. VP, sroot@weatherbank.com MARCH 2017 Climate Highlights The Month in Review The average contiguous
What is the difference between Weather and Climate?
 What is the difference between Weather and Climate? Objective Many people are confused about the difference between weather and climate. This makes understanding the difference between weather forecasts
Lesson Adaptation Activity: Analyzing and Interpreting Data
 Lesson Adaptation Activity: Analyzing and Interpreting Data Related MA STE Framework Standard: 3-ESS2-1. Use graphs and tables of local weather data to describe and predict typical weather during a particular
Science Standard 1: Students analyze monthly precipitation and temperature records, displayed in bar charts, collected in metric units (mm).
.") Title: Precipitation Patterns across the Globe NSF GK-12 Fellow: Terry Legg Type of Lesson: STEM Grade Level(s): 4 th - 7 th grade This activity can be tailored to older, more advanced students by having
Title: Precipitation Patterns across the Globe NSF GK-12 Fellow: Terry Legg Type of Lesson: STEM Grade Level(s): 4 th - 7 th grade This activity can be tailored to older, more advanced students by having
DOZENALS. A project promoting base 12 counting and measuring. Ideas and designs by DSA member (#342) and board member, Timothy F. Travis.
 and board member, Timothy F. Travis.") R AENBO DOZENALS A project promoting base 12 counting and measuring. Ideas and designs by DSA member (#342) and board member Timothy F. Travis. I became aware as a teenager of base twelve numbering from
R AENBO DOZENALS A project promoting base 12 counting and measuring. Ideas and designs by DSA member (#342) and board member Timothy F. Travis. I became aware as a teenager of base twelve numbering from
Rob J Hyndman. Forecasting using. 3. Autocorrelation and seasonality OTexts.com/fpp/2/ OTexts.com/fpp/6/1. Forecasting using R 1
 Rob J Hyndman Forecasting using 3. Autocorrelation and seasonality OTexts.com/fpp/2/ OTexts.com/fpp/6/1 Forecasting using R 1 Outline 1 Time series graphics 2 Seasonal or cyclic? 3 Autocorrelation Forecasting
Thursday 25 May 2017 Morning Time allowed: 1 hour 30 minutes
 Oxford Cambridge and RSA GCSE (9 1) Mathematics J560/04 Paper 4 (Higher Tier) H Thursday 25 May 2017 Morning Time allowed: 1 hour 30 minutes *7348865303* You may use: A scientific or graphical calculator
SOCIAL MEDIA IN THE COMMUNICATIONS CENTRE
 SOCIAL MEDIA IN THE COMMUNICATIONS CENTRE Karen Gordon Gordon Strategy www.gordonstrategy.ca v 1 WHAT WE ARE GOING TO TALK ABOUT TODAY T h e s o c i a l m e d i a i n c i d e n t W h a t c a n h a p p
STATISTICAL FORECASTING and SEASONALITY (M. E. Ippolito; )
") STATISTICAL FORECASTING and SEASONALITY (M. E. Ippolito; 10-6-13) PART I OVERVIEW The following discussion expands upon exponential smoothing and seasonality as presented in Chapter 11, Forecasting, in
STATISTICAL FORECASTING and SEASONALITY (M. E. Ippolito; 10-6-13) PART I OVERVIEW The following discussion expands upon exponential smoothing and seasonality as presented in Chapter 11, Forecasting, in
The Great American Solar Eclipse
 The Great American Solar Eclipse Collection of weblinks on eclipse at https://physicsweb.creighton.edu/ Overview: What you can expect to see and where to see it. Why eclipses are so rare and spectacular
Section II: Assessing Chart Performance. (Jim Benneyan)
") Section II: Assessing Chart Performance (Jim Benneyan) 1 Learning Objectives Understand concepts of chart performance Two types of errors o Type 1: Call an in-control process out-of-control o Type 2: Call
Section II: Assessing Chart Performance (Jim Benneyan) 1 Learning Objectives Understand concepts of chart performance Two types of errors o Type 1: Call an in-control process out-of-control o Type 2: Call
DAILY QUESTIONS 28 TH JUNE 18 REASONING - CALENDAR
 DAILY QUESTIONS 28 TH JUNE 18 REASONING - CALENDAR LEAP AND NON-LEAP YEAR *A non-leap year has 365 days whereas a leap year has 366 days. (as February has 29 days). *Every year which is divisible by 4
GTR # VLTs GTR/VLT/Day %Δ:
 MARYLAND CASINOS: MONTHLY REVENUES TOTAL REVENUE, GROSS TERMINAL REVENUE, WIN/UNIT/DAY, TABLE DATA, AND MARKET SHARE CENTER FOR GAMING RESEARCH, DECEMBER 2017 Executive Summary Since its 2010 casino debut,
Statistics for IT Managers
 Statistics for IT Managers 95-796, Fall 2012 Module 2: Hypothesis Testing and Statistical Inference (5 lectures) Reading: Statistics for Business and Economics, Ch. 5-7 Confidence intervals Given the sample
An alternative to Red-Yellow-Green Board Reports
 Tuesday, December 12 Session A9/B9 An alternative to Red-Yellow-Green Board Reports Dan Watson, MBA Valerie Craig, RN, MSN, MAOM Richard Scoville, PhD Objectives Describe how MHS transitioned to a systems-based
Intro to Info Vis. CS 725/825 Information Visualization Spring } Before class. } During class. Dr. Michele C. Weigle
 CS 725/825 Information Visualization Spring 2018 Intro to Info Vis Dr. Michele C. Weigle http://www.cs.odu.edu/~mweigle/cs725-s18/ Today } Before class } Reading: Ch 1 - What's Vis, and Why Do It? } During
TILT, DAYLIGHT AND SEASONS WORKSHEET
 TILT, DAYLIGHT AND SEASONS WORKSHEET Activity Description: Students will use a data table to make a graph for the length of day and average high temperature in Utah. They will then answer questions based
Selection of Variable Selecting the right variable for a control chart means understanding the difference between discrete and continuous data.
 Statistical Process Control, or SPC, is a collection of tools that allow a Quality Engineer to ensure that their process is in control, using statistics. Benefit of SPC The primary benefit of a control
Introduction to Course
 .. Introduction to Course Oran Kittithreerapronchai 1 1 Department of Industrial Engineering, Chulalongkorn University Bangkok 10330 THAILAND last updated: September 17, 2016 COMP METH v2.00: intro 1/
SO x is a cubed root of t
 7.6nth Roots 1) What do we know about x because of the following equation x 3 = t? All in one.docx SO x is a cubed root of t 2) Definition of nth root: 3) Study example 1 4) Now try the following problem
D2D SALES WITH SURVEY123, OP DASHBOARD, AND MICROSOFT SSAS
 D2D SALES WITH SURVEY123, OP DASHBOARD, AND MICROSOFT SSAS EDWARD GAUSE, GISP DIRECTOR OF INFORMATION SERVICES (ENGINEERING APPS) HTC (HORRY TELEPHONE COOP.) EDWARD GAUSE, GISP DIRECTOR OF INFORMATION
Introduction to Information Visualization
 Introduction to Information Visualization Edward Tufte: References The Visual Display of Quantitative Information Envisioning Information Visual Explanation Dr. John Stasko s Information Visualization
All work must be shown in this course for full credit. Unsupported answers may receive NO credit.
 AP Calculus. Worksheet All work must be shown in this course for full credit. Unsupported answers may receive NO credit.. Write the equation of the line that goes through the points ( 3, 7) and (4, 5)
Climate Change and Water Supply Research. Drought Response Workshop October 8, 2013
 Climate Change and Water Supply Research Drought Response Workshop October 8, 2013 DWR Photo Oroville Reservoir, 2009 Talk Overview Expectations History Atmospheric Rivers and Water Supply Current Research
Lesson 8: Variability in a Data Distribution
 Classwork Example 1: Comparing Two Distributions Robert s family is planning to move to either New York City or San Francisco. Robert has a cousin in San Francisco and asked her how she likes living in
Statistical Models for Rainfall with Applications to Index Insura
 Statistical Models for Rainfall with Applications to April 21, 2008 Overview The idea: Insure farmers against the risk of crop failure, like drought, instead of crop failure itself. It reduces moral hazard
Lecture Prepared By: Mohammad Kamrul Arefin Lecturer, School of Business, North South University
 Lecture 15 20 Prepared By: Mohammad Kamrul Arefin Lecturer, School of Business, North South University Modeling for Time Series Forecasting Forecasting is a necessary input to planning, whether in business,
Friday April 21, :30 MDT (7:30 pm) All TAAS and other new and not so new astronomers are invited. Ursa Major. Photo Courtesy of Naoyuki Kurita
 All TAAS and other new and not so new astronomers are invited. Ursa Major. Photo Courtesy of Naoyuki Kurita") TAAS Fabulous Fifty Friday April 21, 2017 19:30 MDT (7:30 pm) Ursa Major Photo Courtesy of Naoyuki Kurita All TAAS and other new and not so new astronomers are invited Evening Events 7:30 pm Meet inside
TAAS Fabulous Fifty Friday April 21, 2017 19:30 MDT (7:30 pm) Ursa Major Photo Courtesy of Naoyuki Kurita All TAAS and other new and not so new astronomers are invited Evening Events 7:30 pm Meet inside
WHEN IS IT EVER GOING TO RAIN? Table of Average Annual Rainfall and Rainfall For Selected Arizona Cities
 WHEN IS IT EVER GOING TO RAIN? Table of Average Annual Rainfall and 2001-2002 Rainfall For Selected Arizona Cities Phoenix Tucson Flagstaff Avg. 2001-2002 Avg. 2001-2002 Avg. 2001-2002 October 0.7 0.0
Lesson Nine Population Problems. Key question How does growth of Florida s human population affect bear populations?
 Lesson Nine Population Problems Key question How does growth of Florida s human population affect bear populations? Conceptual frameworks topics IV.C. Florida black bear seasonal activities and movements
Former Guterl Specialty Steel Site
 Former Guterl Specialty Steel Site Environmental Monitoring Report 2013-2014 U. S. ARMY CORPS OF ENGINEERS BUILDING STRONG Buffalo District Formerly Utilized Sites Remedial Action Program May 2015 Site
Name of business: Food Control Plan Diary 2017 Supplementary Records Hot-Hold
 Name of business: Food Control Plan Diary 2017 Supplementary Records Hot-Hold Th those s uitable for small to medium food businesses limited s Helpful Tips - Checking Food Temperatures Here are a few
Statistics lecture 3. Bell-Shaped Curves and Other Shapes
 Statistics lecture 3 Bell-Shaped Curves and Other Shapes Goals for lecture 3 Realize many measurements in nature follow a bell-shaped ( normal ) curve Understand and learn to compute a standardized score
TOPIC: Descriptive Statistics Single Variable
 TOPIC: Descriptive Statistics Single Variable I. Numerical data summary measurements A. Measures of Location. Measures of central tendency Mean; Median; Mode. Quantiles - measures of noncentral tendency
Project No India Basin Shadow Study San Francisco, California, USA
 Project No. 432301 India Basin Shadow Study San Francisco, California, USA Numerical Modelling Studies 04 th June 2018 For Build Inc. Report Title: India Basin Shadow Study San Francisco, California, USA
GIS PORTFOLIO MOHAMED MAGDY MOHAMED HUSSAIN GIS ENGINEER. UWF GIS ONLINE CERTIFICATE GIS Internship (GIS4944)
") 2012 GIS PORTFOLIO MOHAMED MAGDY MOHAMED HUSSAIN GIS ENGINEER UWF GIS ONLINE CERTIFICATE GIS Internship (GIS4944) Portfolio Table of Contents Subject... Page Personal statement/mission/philosophy... 1
2012 GIS PORTFOLIO MOHAMED MAGDY MOHAMED HUSSAIN GIS ENGINEER UWF GIS ONLINE CERTIFICATE GIS Internship (GIS4944) Portfolio Table of Contents Subject... Page Personal statement/mission/philosophy... 1
Record date Payment date PID element Non-PID element. 08 Sep Oct p p. 01 Dec Jan p 9.85p
 2017/18 Record date Payment date PID element Non-PID element 08 Sep 17 06 Oct 17 9.85p - 9.85p 01 Dec 17 05 Jan 18-9.85p 9.85p 09 Mar 18 06 Apr 18 9.85p - 9.85p Final 22 Jun 18 27 Jul 18 14.65p - 14.65p
Process Behavior Analysis Understanding Variation
 Process Behavior Analysis Understanding Variation Steven J Mazzuca ASQ 2015-11-11 Why Process Behavior Analysis? Every day we waste valuable resources because we misunderstand or misinterpret what our
Winter Season Resource Adequacy Analysis Status Report
 Winter Season Resource Adequacy Analysis Status Report Tom Falin Director Resource Adequacy Planning Markets & Reliability Committee October 26, 2017 Winter Risk Winter Season Resource Adequacy and Capacity
WYANDOTTE MUNICIPAL SERVICES COMMUNITY WIND ENERGY PROJECT WIND RESOUCE SUMMARY
 WYANDOTTE MUNICIPAL SERVICES COMMUNITY WIND ENERGY PROJECT WIND RESOUCE SUMMARY MONTHLY REPORT October 15, 2007 Black & Veatch Project: 144374 Prepared by: Black & Veatch Corporation 6300 S. Syracuse Way
Monthly Trading Report July 2018
 Monthly Trading Report July 218 Figure 1: July 218 (% change over previous month) % Major Market Indicators 2 2 4 USEP Forecasted Demand CCGT/Cogen/Trigen Supply ST Supply Figure 2: Summary of Trading
Computation of Large Sparse Aggregated Areas for Analytic Database Queries
 Computation of Large Sparse Aggregated Areas for Analytic Database Queries Steffen Wittmer Tobias Lauer Jedox AG Collaborators: Zurab Khadikov Alexander Haberstroh Peter Strohm Business Intelligence and
SYSTEM BRIEF DAILY SUMMARY
 SYSTEM BRIEF DAILY SUMMARY * ANNUAL MaxTemp NEL (MWH) Hr Ending Hr Ending LOAD (PEAK HOURS 7:00 AM TO 10:00 PM MON-SAT) ENERGY (MWH) INCREMENTAL COST DAY DATE Civic TOTAL MAXIMUM @Max MINIMUM @Min FACTOR
u.s. Naval Observatory Astronomical Applications Department
 Phases ofthe Moon Page 1 of 1 u.s. Naval Observatory Astronomical Applications Department Phases of the Moon 1944 Phases of the Moon Universal Time New Moon First Quarter Full Moon Last Quarter d h m d
Mathematics B Monday 2 November 2015 Paper One Question book
 2015 Senior External Examination Mathematics B Monday 2 November 2015 Paper One Question book 9 am to 12:10 pm Time allowed Perusal time: 10 minutes Working time: 3 hours Examination materials provided
REGIONAL TRAINING COURSE ON METHODS AND TOOLS TO IDENTIFY SOURCES OF AIR POLLUTION
 REGIONAL TRAINING COURSE ON METHODS AND TOOLS TO IDENTIFY SOURCES OF AIR POLLUTION IAEA RER 1013: Supporting Air Quality Management Source apportionment by Positive Matrix Factorization Marta Almeida Email:
Unit #2: Linear and Exponential Functions Lesson #13: Linear & Exponential Regression, Correlation, & Causation. Day #1
 Algebra I Name Unit #2: Linear and Exponential Functions Lesson #13: Linear & Exponential Regression, Correlation, & Causation Day #1 Period Date When a table of values increases or decreases by the same
The point is located eight units to the right of the y-axis and two units above the x-axis. A) ( 8, 2) B) (8, 2) C) ( 2, 8) D) (2, 8) E) ( 2, 8)
 ( 8, 2) B) (8, 2) C) ( 2, 8) D) (2, 8) E) ( 2, 8)") Name: Date: 1. Find the coordinates of the point. The point is located eight units to the right of the y-axis and two units above the x-axis. A) ( 8, ) B) (8, ) C) (, 8) D) (, 8) E) (, 8). Find the coordinates
Name: Date: 1. Find the coordinates of the point. The point is located eight units to the right of the y-axis and two units above the x-axis. A) ( 8, ) B) (8, ) C) (, 8) D) (, 8) E) (, 8). Find the coordinates
Monthly Long Range Weather Commentary Issued: APRIL 25, 2016 Steven A. Root, CCM, Chief Analytics Officer, Sr. VP, sales
 Monthly Long Range Weather Commentary Issued: APRIL 25, 2016 Steven A. Root, CCM, Chief Analytics Officer, Sr. VP, sales sroot@weatherbank.com MARCH 2016 Climate Highlights The Month in Review The March
Introduction to Algebra: The First Week
 Introduction to Algebra: The First Week Background: According to the thermostat on the wall, the temperature in the classroom right now is 72 degrees Fahrenheit. I want to write to my friend in Europe,
Interactive Statistics Visualisation based on Geovisual Analytics
 Interactive Statistics Visualisation based on Geovisual Analytics Prof. Mikael Jern NCVA LiU and NComVA AB May 2010 - Spin-off company to focus on Interactive Statistics Visualization and Storytelling
Highlights of the 2006 Water Year in Colorado
 Highlights of the 2006 Water Year in Colorado Nolan Doesken, State Climatologist Atmospheric Science Department Colorado State University http://ccc.atmos.colostate.edu Presented to 61 st Annual Meeting
Computer Activity #3 SUNRISE AND SUNSET: THE SEASONS
 NAME(S)!!!!!!!!!!!!!!!!!!!!!!!!!!!!!!!!!! ASTRONOMY 25 Computer Activity #3 SUNRISE AND SUNSET: THE SEASONS SECTION DAY/TIME S. V. LLOYD Overview The seasonal variation in temperature is due to two changes
ACCA Interactive Timetable
 ACCA Interactive Timetable 2018 Professional information last updated uary 2018 v4.1 Please note: Information and dates in this timetable are subject to change. How the 4 exam sittings can work for you
UNIVERSITY OF CAMBRIDGE INTERNATIONAL EXAMINATIONS International General Certificate of Secondary Education
 www.xtremepapers.com UNIVERSITY OF CAMBRIDGE INTERNATIONAL EXAMINATIONS International General Certificate of Secondary Education *2678444144* ENVIRONMENTAL MANAGEMENT 0680/02 Paper 2 May/June 2008 1 hour
Time Series Analysis
 Time Series Analysis A time series is a sequence of observations made: 1) over a continuous time interval, 2) of successive measurements across that interval, 3) using equal spacing between consecutive
Monthly Trading Report Trading Date: Dec Monthly Trading Report December 2017
 Trading Date: Dec 7 Monthly Trading Report December 7 Trading Date: Dec 7 Figure : December 7 (% change over previous month) % Major Market Indicators 5 4 Figure : Summary of Trading Data USEP () Daily
SYSTEM BRIEF DAILY SUMMARY
 SYSTEM BRIEF DAILY SUMMARY * ANNUAL MaxTemp NEL (MWH) Hr Ending Hr Ending LOAD (PEAK HOURS 7:00 AM TO 10:00 PM MON-SAT) ENERGY (MWH) INCREMENTAL COST DAY DATE Civic TOTAL MAXIMUM @Max MINIMUM @Min FACTOR
Average 175, , , , , , ,046 YTD Total 1,098,649 1,509,593 1,868,795 1,418, ,169 1,977,225 2,065,321
 AGRICULTURE 01-Agriculture JUL 2,944-4,465 1,783-146 102 AUG 2,753 6,497 5,321 1,233 1,678 744 1,469 SEP - 4,274 4,183 1,596 - - 238 OCT 2,694 - - 1,032 340-276 NOV 1,979-5,822 637 3,221 1,923 1,532 DEC
Average 175, , , , , , ,940 YTD Total 944,460 1,284,944 1,635,177 1,183, ,954 1,744,134 1,565,640
 AGRICULTURE 01-Agriculture JUL 2,944-4,465 1,783-146 102 AUG 2,753 6,497 5,321 1,233 1,678 744 1,469 SEP - 4,274 4,183 1,596 - - 238 OCT 2,694 - - 1,032 340-276 NOV 1,979-5,822 637 3,221 1,923 1,532 DEC
Virginia Basis Tables for Corn, Soybeans, and Wheat
 VIRGINIA POL VTECHNIC INSTn U 11~. UNIVERSITY LIBRARIES Agricultural and Applied Economics Virginia Basis Tables for Corn, Soybeans, and Wheat David E. Kenyon* Introduction Futures prices determined at
Third Grade Math and Science DBQ Weather and Climate/Representing and Interpreting Charts and Data
 Third Grade Math and Science DBQ Weather and Climate/Representing and Interpreting Charts and Data A document based question (DBQ) is an authentic assessment where students interact with content related
2007 Stations for Brad Pitt Page 1. Mercury Stationary Retrograde 13 Feb 2007 in 03rd House
 2007 Stations for Brad Pitt Page 1 Mercury Stationary Retrograde 13 Feb 2007 in 03rd House 25Ò 26Ò 27Ò 28Ò 29Ò 00Ò 01Ò 02Ò 03Ò 04Ò 05Ò 06Ò 07Ò 08Ò 09Ò 10Ò 11Ò œ 30 Jan 2007 02:11 am 25Ò 25' Enters Rx Zone
Technical note on seasonal adjustment for M0
 Technical note on seasonal adjustment for M0 July 1, 2013 Contents 1 M0 2 2 Steps in the seasonal adjustment procedure 3 2.1 Pre-adjustment analysis............................... 3 2.2 Seasonal adjustment.................................
LAB 3: THE SUN AND CLIMATE NAME: LAB PARTNER(S):
:") GEOG 101L PHYSICAL GEOGRAPHY LAB SAN DIEGO CITY COLLEGE SELKIN 1 LAB 3: THE SUN AND CLIMATE NAME: LAB PARTNER(S): The main objective of today s lab is for you to be able to visualize the sun s position
GEOG 101L PHYSICAL GEOGRAPHY LAB SAN DIEGO CITY COLLEGE SELKIN 1 LAB 3: THE SUN AND CLIMATE NAME: LAB PARTNER(S): The main objective of today s lab is for you to be able to visualize the sun s position
DEPARTMENT OF THE ARMY MILITARY SURFACE DEPLOYMENT AND DISTRIBUTION COMMAND (SDDC) 1 SOLDIER WAY SCOTT AFB, IL 62225
 1 SOLDIER WAY SCOTT AFB, IL 62225") DEPARTMENT OF THE ARMY MILITARY SURFACE DEPLOYMENT AND DISTRIBUTION COMMAND (SDDC) 1 SOLDIER WAY SCOTT AFB, IL 62225 SDDC Operations Special Requirements Branch 1 Soldier Way Scott AFB, IL 62225 April
DEPARTMENT OF THE ARMY MILITARY SURFACE DEPLOYMENT AND DISTRIBUTION COMMAND (SDDC) 1 SOLDIER WAY SCOTT AFB, IL 62225 SDDC Operations Special Requirements Branch 1 Soldier Way Scott AFB, IL 62225 April
Why does attention to web articles fall with time?
 Why does attention to web articles fall with time? M.V. Simkin and V.P. Roychowdhury Department of Electrical Engineering, University of California, Los Angeles, CA 90095-594 We analyze access statistics
OSS NEWSLETTER & FORECAST Sunday, July 10, OSS NEWSLETTER & FORECAST.
 OSS NEWSLETTER & FORECAST Sunday, July 10, 2011 1 OSS NEWSLETTER & FORECAST http://www.oss.cc Table of Contents Market Comments... 1 Financial Events for the Coming Week... 4 Last Week s OSS INDICATORS
ALGEBRA I COURSE SYLLABUS
 Dominican International School ALGEBRA I COURSE SYLLABUS GRADE LEVEL: 8 SCHOOL YEAR: 2018-2019 TEACHER: Christiaan Basson EMAIL: cbasson@dishs.tp.edu.tw COURSE DESCRIPTION Algebra I is the course that
YACT (Yet Another Climate Tool)? The SPI Explorer
? The SPI Explorer") YACT (Yet Another Climate Tool)? The SPI Explorer Mike Crimmins Assoc. Professor/Extension Specialist Dept. of Soil, Water, & Environmental Science The University of Arizona Yes, another climate tool for
YACT (Yet Another Climate Tool)? The SPI Explorer Mike Crimmins Assoc. Professor/Extension Specialist Dept. of Soil, Water, & Environmental Science The University of Arizona Yes, another climate tool for
A FACILITY MANAGER S INTRODUCTION TO WEATHER CORRECTION FOR UTILITY BILL TRACKING. John Avina, Director Abraxas Energy Consulting
 A FACILITY MANAGER S INTRODUCTION TO WEATHER CORRECTION FOR UTILITY BILL TRACKING John Avina, Director Abraxas Energy Consulting ABSTRACT Utility bill tracking is at the heart of an effective energy management