Applying Visual Analytics Methods to Spatial Time Series Data: Forest Fires, Phone Calls,
|
|
|
- Clifford Bond
- 5 years ago
- Views:
Transcription


1 Applying Visual Analytics Methods to Spatial Time Series Data: Forest Fires, Phone Calls, Dr. & Dr. Natalia Andrienko In collaboration with TU Darmstadt and Univ. Constance, DFG Priority Research Program on Visual Analytics, SPP 1335

2 Joint research group of Fraunhofer Institute IAIS and University of Bonn Major R&D direction: Visual Analytics for spatial and temporal data data mining optimization geovisualization Key research projects: GeoPKDD: Geographic Privacyaware Knowledge Discovery (FET-Open ) ViAMoD: Visual Spatiotemporal Pattern Analysis of Movement and Event Data (DFG, ) OASIS ( ), ESS ( ) EU-funded IPs on crisis management VisMaster, MODAP (FET-Open CAs) 2
 Attributes: population + various crime")
3 Spatial Time Series: Data Structure Spatial references: states of the USA Temporal references: years from 1960 till 2000 (41) Attributes: population + various crime rates 3

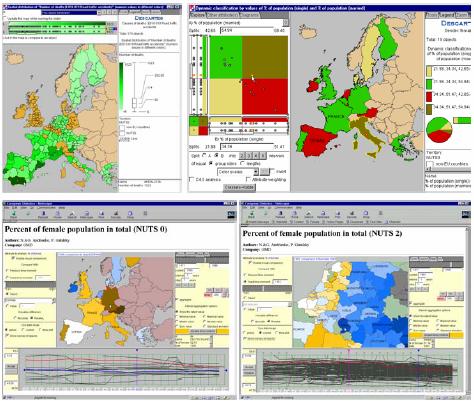
4 OECD Explorer (2009) EuroFigures (1999) 4
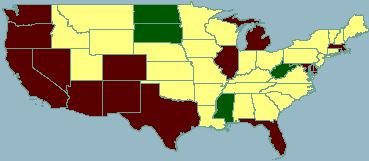
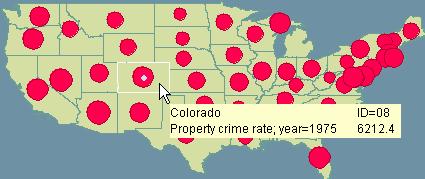
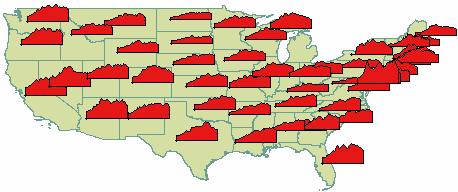
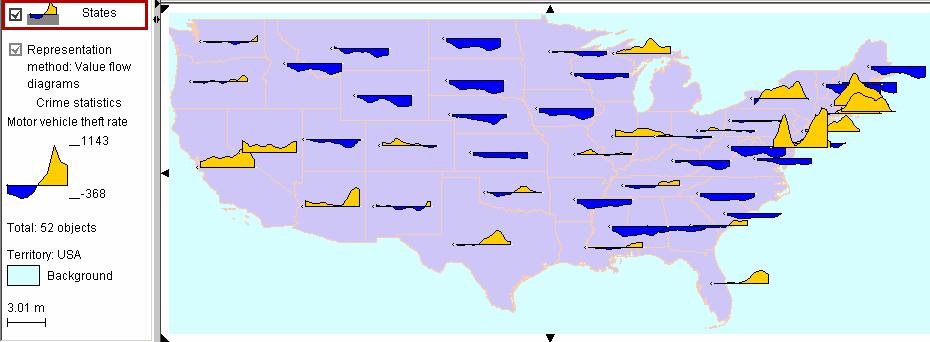
5 Spatial Visualizations: animated maps, diagram maps 5
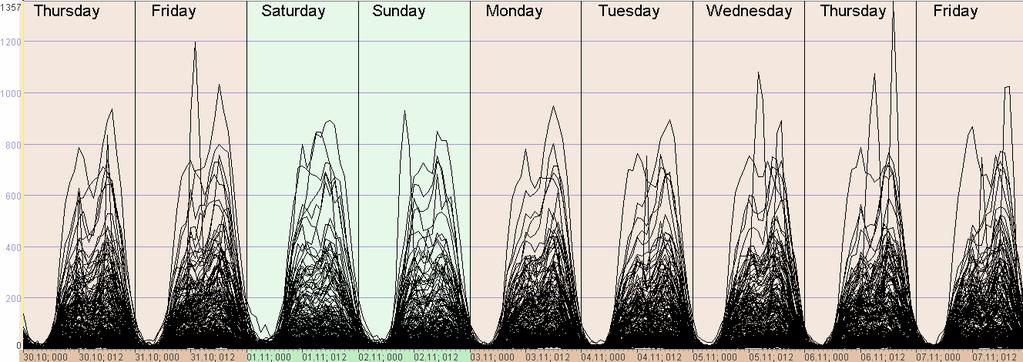
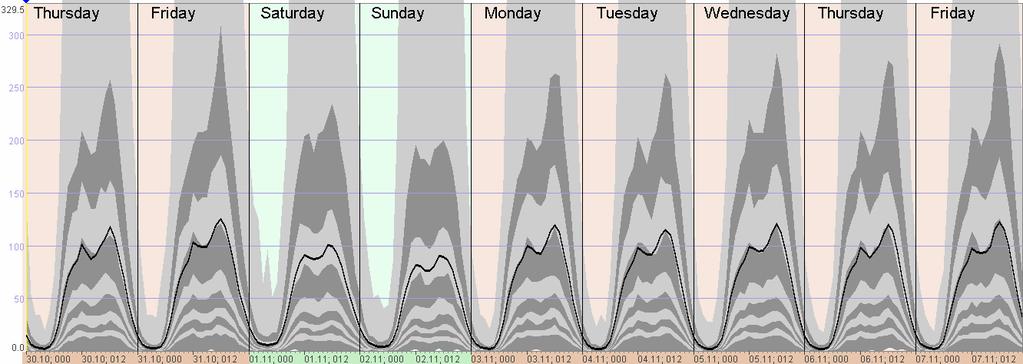
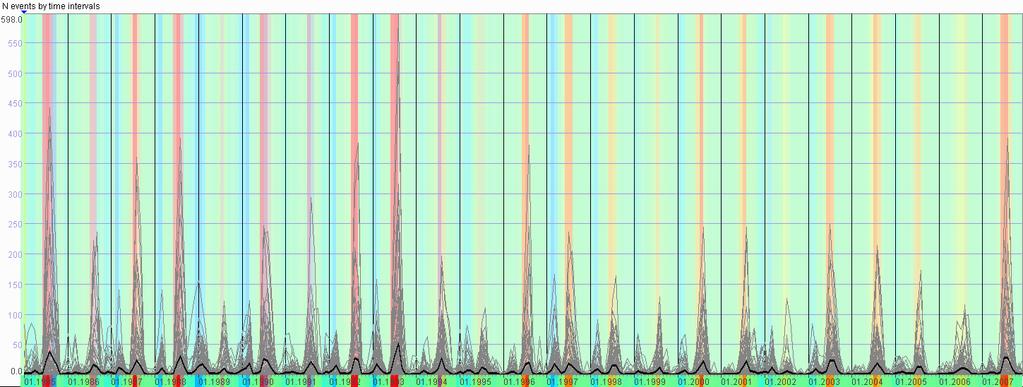
6 Temporal visualizations 6

7 Exploring trends by interactive operations 7
8 Scalability problem What if we have - Multiple attributes - Many places - Long time series Interactive visualization is not sufficient We need grouping in space and time => Clustering 8
9 Data sets Forest fires in Italy (courtesy of the European forest Fires database, accessed within the Forest Fires project, tender to JRC) - Monthly counts of forest fires for 107 regions, 24 years 24 x 12 = 264 time intervals - Annual counts of forest fires by different causes, accidental and deliberate Phone calls in Milan (courtesy of WIND, provided within ESS project) - Hourly counts of mobile phone calls, 9 days, 238 regions 9 x 24 = 216 time intervals 9
 Group places by similarity of temporal dynamics: clustering Time in Space")
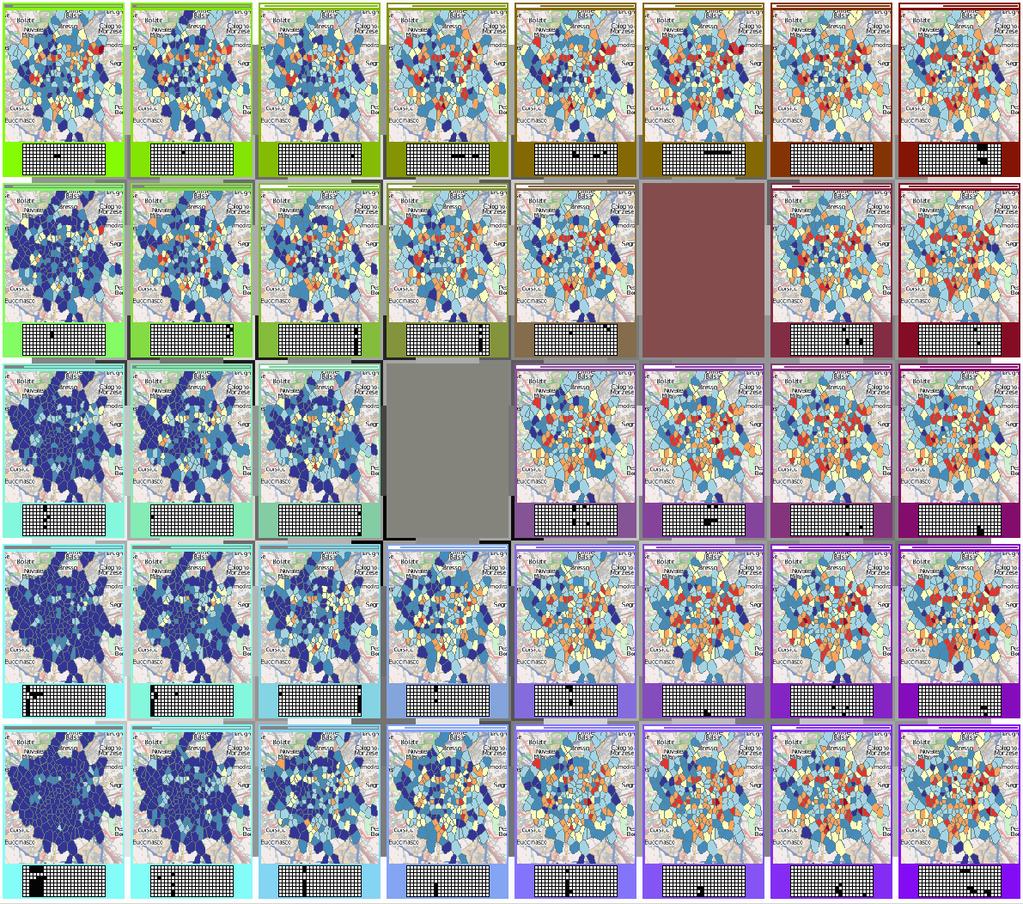
10 Approach 2) Group time intervals by similarity of spatial situations: clustering Space in Time 1) Group places by similarity of temporal dynamics: clustering Time in Space 10
11 SOM Self-Organizing Map (Kohonen 2001) is a neural network type vector projection and quantization algorithm. By means of a competitive, iterative training process, a network of prototype vectors (or neurons, or cells) is trained (adjusted) to the input vector data. The output of the algorithm is a network of vectors that is approximately topology preserving w.r.t. the input data. The network can be interpreted as a set of clusters and simultaneously as a map to lay out the input data elements (e.g., in the nearest neighbor sense w.r.t. the prototypes). Typically, two-dimensional rectangular or hexagonal prototype vector networks are assumed. The capability of SOM to arrange input data in a regular network structure provides good opportunities for visualization. 11

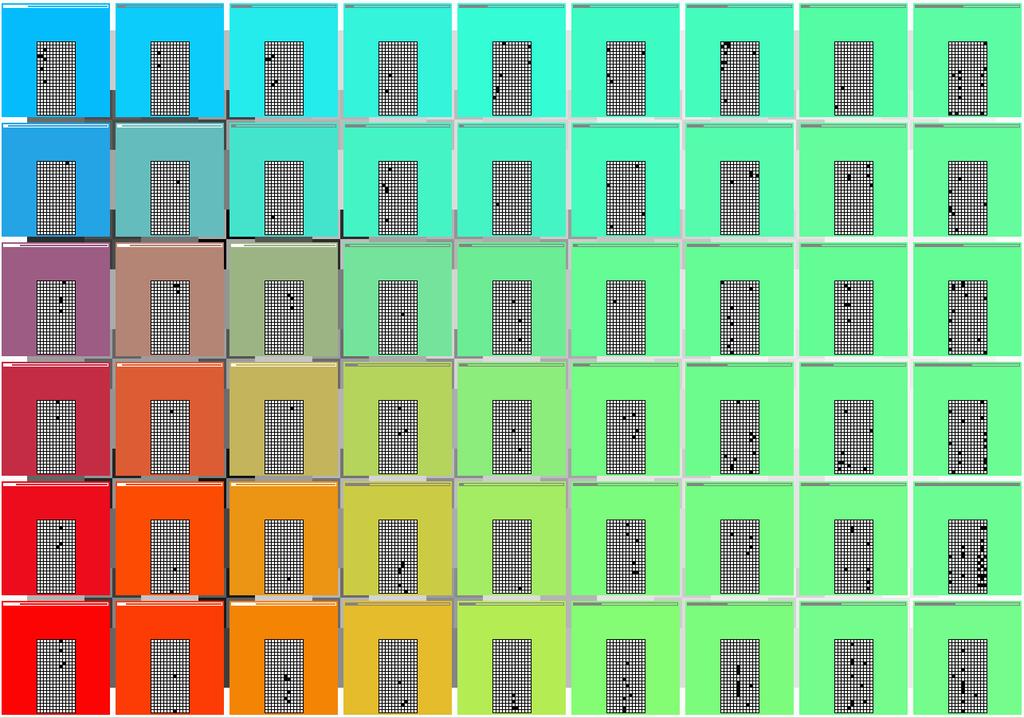
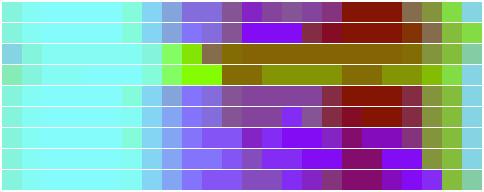
12 Space-in-Time and Time-in-Space SOMs: visualization 1. Bars on top of a cell show number of objects inside 2. Shading of borders between cells reflects similarity of features 3. Similarity of colors also reflects similarity 4. Colors are projected on other displays: maps (if grouping places) and time graphs (if grouping time intervals), Natalia Andrienko, Sebastian Bremm, Tobias Schreck, Tatiana von Landesberger, Peter Bak, Daniel Keim Space-in-Time and Time-in-Space Self-Organizing Maps for Exploring Spatiotemporal Patterns Computer Graphics Forum, 2010, v.29 (3) 12

")
 Feature")
13 Time-in-Space SOM of forest fires Inside cells: index images (what is grouped) feature images (what are the features) Feature images Index images 13
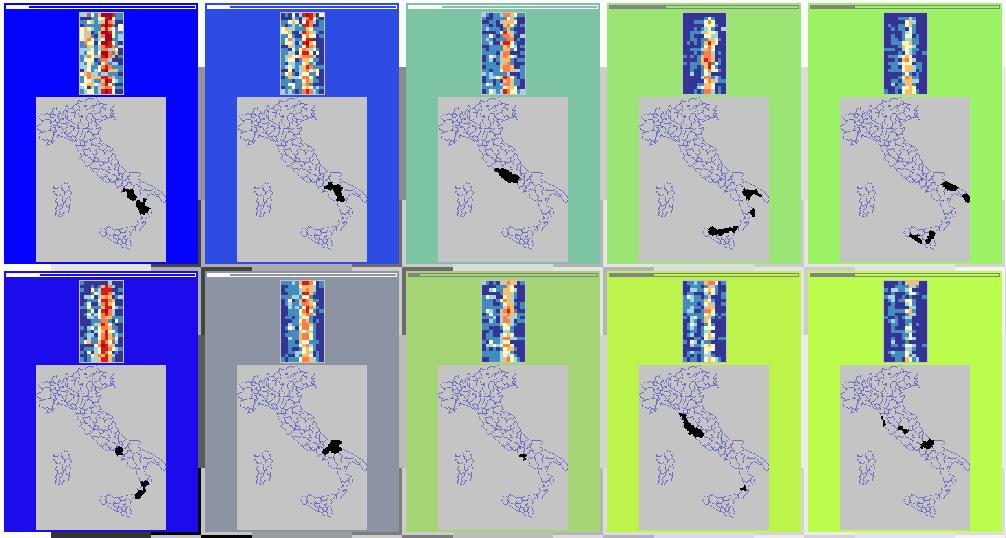
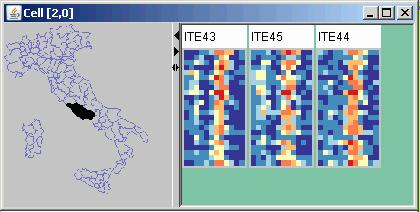
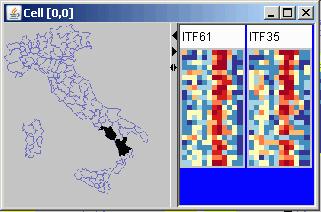
14 Time-in-Space SOM: details 14
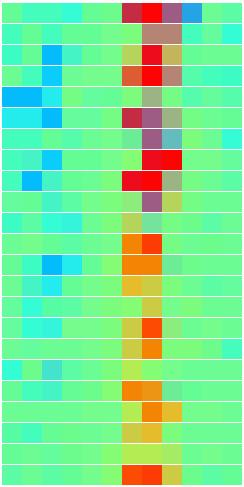
15 Space-in-time SOM (index images) years 1 Months 12 15
")
16 Space-in-time SOM (feature images) 16

17 Cause 3: Accident Cause 4: Deliberate Comparison of spatial distributions of temporal dynamics 17

18 Time-in-Space SOM of mobile phone calls 18
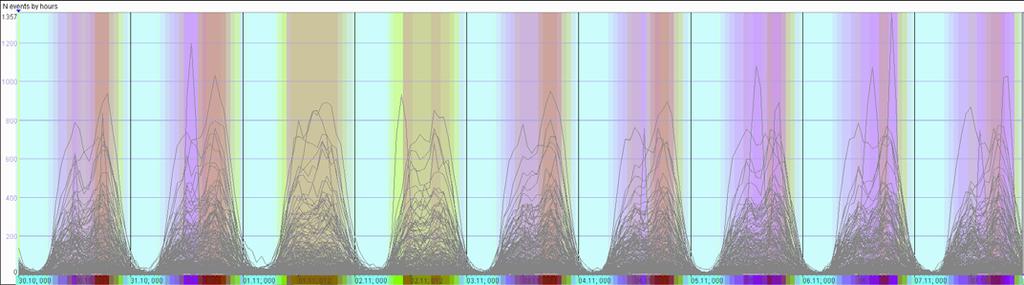
19 Space-in-Time SOM of mobile phone calls 19
20 Next step: predictive modeling Applying Holt-Winters smoothing to detected clusters, separately for working days and weekends (joint work with Christian Pölitz, Univ. Bonn) 20


21 Further work: search for outliers, event detection etc. 21
22 Conclusions Interactive and animated maps and graphs are not sufficient for analyzing large and complex data. Visual methods need to be augmented by computations. With space-in-time and time-in-space SOMs we consider data from two different perspectives: - places grouped by similar attribute dynamics - time intervals grouped by similar spatial distributions of attribute values Clusters colours reflect their similarity Two case studies demonstrate the value of the approach A step towards predictive modelling - Live demo is possible 22
Space-in-Time and Time-in-Space Self-Organizing Maps for Exploring Spatiotemporal Patterns
 Eurographics/ IEEE-VGTC Symposium on Visualization 2010 G. Melançon, T. Munzner, and D. Weiskopf (Guest Editors) Volume 29 (2010), Number 3 Space-in-Time and Time-in-Space Self-Organizing Maps for Exploring
Visualization of Trajectory Attributes in Space Time Cube and Trajectory Wall
 Visualization of Trajectory Attributes in Space Time Cube and Trajectory Wall Gennady Andrienko, Natalia Andrienko, Heidrun Schumann and Christian Tominski Abstract Space time cube is often used as a visualization
Towards Privacy-Preserving Semantic Mobility Analysis
 EuroVis Workshop on Visual Analytics (2013) M. Pohl and H. Schumann (Editors) Towards Privacy-Preserving Semantic Mobility Analysis N. Andrienko 1, G. Andrienko 1 and G. Fuchs 1 1 Fraunhofer IAIS, Sankt
Visual Analytics ofmovement
 Gennady Andrienko. Natalia Andrienko Peter Bak Daniel Keim Stefan Wrobel Visual Analytics ofmovement ~ Springer Contents 1 Introduction... 1 1.1 A Single Trajectory.....................................
Geospatial Visual Analytics and Geovisualization in VisMaster (WP3.4)
") Geospatial Visual Analytics and Geovisualization in VisMaster (WP3.4) Gennady Andrienko Fraunhofer Institute IAIS Sankt Augustin Germany http://geoanalytics.net/and Heidrun Schumann University of Rostock
Geospatial Visual Analytics and Geovisualization in VisMaster (WP3.4) Gennady Andrienko Fraunhofer Institute IAIS Sankt Augustin Germany http://geoanalytics.net/and Heidrun Schumann University of Rostock
Implementing Visual Analytics Methods for Massive Collections of Movement Data
 Implementing Visual Analytics Methods for Massive Collections of Movement Data G. Andrienko, N. Andrienko Fraunhofer Institute Intelligent Analysis and Information Systems Schloss Birlinghoven, D-53754
Extracting Events from Spatial Time Series
 Extracting Events from Spatial ime Series Gennady Andrienko, Natalia Andrienko, Martin Mladenov, Michael Mock, Christian Poelitz Fraunhofer IAIS and University of Bonn, Germany http://www.visual-analytics.info
Scalable Analysis of Movement Data for Extracting and Exploring Significant Places
 IEEE TRANSACTIONS ON VISUALIZATION AND COMPUTER GRAPHICS, MANUSCRIPT ID 1 Scalable Analysis of Movement Data for Extracting and Exploring Significant Places Gennady Andrienko, Natalia Andrienko, Christophe
Analysis of Interest Rate Curves Clustering Using Self-Organising Maps
 Analysis of Interest Rate Curves Clustering Using Self-Organising Maps M. Kanevski (1), V. Timonin (1), A. Pozdnoukhov(1), M. Maignan (1,2) (1) Institute of Geomatics and Analysis of Risk (IGAR), University
Open Data meets Big Data
 Open Data meets Big Data Max Craglia, Sven Schade, Anders Friis European Commission Joint Research Centre www.jrc.ec.europa.eu Serving society Stimulating innovation Supporting legislation JRC is Technical
Extracting Patterns of Individual Movement Behaviour from a Massive Collection of Tracked Positions
 Extracting Patterns of Individual Movement Behaviour from a Massive Collection of Tracked Positions Gennady Andrienko and Natalia Andrienko Fraunhofer Institute IAIS Schloss Birlinghoven, 53754 Sankt Augustin,
Draft. Visual Analytics for Understanding Spatial Situations from Episodic Movement Data
 DOI 10.1007/s13218-012-0177-4 FAC H B E I T R AG Visual Analytics for Understanding Spatial Situations from Episodic Movement Data Natalia Andrienko Gennady Andrienko Hendrik Stange Thomas Liebig Dirk
Jae-Bong Lee 1 and Bernard A. Megrey 2. International Symposium on Climate Change Effects on Fish and Fisheries
 International Symposium on Climate Change Effects on Fish and Fisheries On the utility of self-organizing maps (SOM) and k-means clustering to characterize and compare low frequency spatial and temporal
Accuracy of near real time updates in wind power forecasting with regard to different weather regimes
 Accuracy of near real time updates in wind power forecasting with regard to different weather regimes Nadja Saleck 1, Florian Bertsch 2, Lüder von Bremen 1, Detlev Heinemann 1 1 ForWind, University of
Revealing Patterns and Trends of Mass Mobility through Spatial and Temporal Abstraction of Origin-Destination Movement Data
 Revealing Patterns and Trends of Mass Mobility through Spatial and Temporal Abstraction of Origin-Destination Movement Data Gennady Andrienko, Natalia Andrienko, Georg Fuchs, and Jo Wood Abstract Origin-destination
MobilityGraphs: Visual Analysis of Mass Mobility Dynamics via Spatio-Temporal Graphs and Clustering
 2016 IEEE. Personal use of this material is permitted. However, permission to reprint/republish this material for advertising or promotional purposes or for creating new collective works for resale or
(Received 00 Month 20XX; final version received 00 Month 20XX)
") Space, Time, and Visual Analytics Gennady Andrienko, Natalia Andrienko, Urška Demšar, Doris Dransch, Jason Dykes, Sara Fabrikant, Mikael Jern, Menno-Jan Kraak, Heidrun Schumann, Christian Tominski Department,
Space, Time, and Visual Analytics Gennady Andrienko, Natalia Andrienko, Urška Demšar, Doris Dransch, Jason Dykes, Sara Fabrikant, Mikael Jern, Menno-Jan Kraak, Heidrun Schumann, Christian Tominski Department,
Maps as Tools for Visual Analysis of Geospatial Data. Dr. Claus Rinner Department of Geography and Environmental Studies Ryerson University
 Maps as Tools for Visual Analysis of Geospatial Data Dr. Claus Rinner Department of Geography and Environmental Studies Ryerson University 1 Geography and data analytics 80% of all datasets are said to
Drought News August 2014
 European Drought Observatory (EDO) Drought News August 2014 (Based on data until the end of July) http://edo.jrc.ec.europa.eu August 2014 EDO (http://edo.jrc.ec.europa.eu) Page 2 of 8 EDO Drought News
A Conceptual Framework and Taxonomy of Techniques for Analyzing Movement
 A Conceptual Framework and axonomy of echniques for Analyzing Movement G. Andrienko 1, N. Andrienko 1, P. Bak 2, D. Keim 3,. Kisilevich 3,. Wrobel 1 1 Fraunhofer Institute IAI - Intelligent Analysis and
Geog183: Cartographic Design and Geovisualization Winter Quarter 2017 Lecture 6: Map types and Data types
 Geog183: Cartographic Design and Geovisualization Winter Quarter 2017 Lecture 6: Map types and Data types Data types Data dimension: Point, Line, Area, Volume (Text) Data continuity: Discrete, Point, Polygon:
Using R for time series analysis and spatial-temporal distribution of global burnt surface multi-year product
 Using R for time series analysis and spatial-temporal distribution of global burnt surface multi-year product Jedrzej Bojanowski* César Carmona-Moreno European Commission - Joint Research Centre Institute
Table S1 shows the SOM parameters that were used in the main manuscript. These correspond to the default set of options of the SOM Toolbox.
 Supplemental file 1: SOM training parameters and sensitivity analysis. Table S1 shows the SOM parameters that were used in the main manuscript. These correspond to the default set of options of the SOM
Maps as Research Tools Within a Virtual Research Environment.
 Maps as Research Tools Within a Virtual Research Environment. Sebastian Specht, Christian Hanewinkel Leibniz-Institute for Regional Geography Leipzig, Germany Abstract. The Tambora.org Virtual Research
Machine Learning of Environmental Spatial Data Mikhail Kanevski 1, Alexei Pozdnoukhov 2, Vasily Demyanov 3
 1 3 4 5 6 7 8 9 10 11 1 13 14 15 16 17 18 19 0 1 3 4 5 6 7 8 9 30 31 3 33 International Environmental Modelling and Software Society (iemss) 01 International Congress on Environmental Modelling and Software
Math/Stat Classification of Spatial Analysis and Spatial Statistics Operations
 Draft3, April 2012 Math/Stat Classification of Spatial Analysis and Spatial Statistics Operations for MapCalc software distributed by Berry & Associates // Spatial Information Systems Alternative frameworks
Crime Analyst Extension. Christine Charles
 Crime Analyst Extension Christine Charles ccharles@esricanada.com Agenda Why use Crime Analyst? Overview Tools Demo Interoperability With our old software it could take a police officer up to forty minutes
Animating Maps: Visual Analytics meets Geoweb 2.0
 Animating Maps: Visual Analytics meets Geoweb 2.0 Piyush Yadav 1, Shailesh Deshpande 1, Raja Sengupta 2 1 Tata Research Development and Design Centre, Pune (India) Email: {piyush.yadav1, shailesh.deshpande}@tcs.com
Spatial Pattern Analysis: Mapping Trends and Clusters. Lauren M. Scott, PhD Lauren Rosenshein Bennett, MS
 Spatial Pattern Analysis: Mapping Trends and Clusters Lauren M. Scott, PhD Lauren Rosenshein Bennett, MS Presentation Outline Spatial statistics overview Describing spatial patterns Quantifying spatial
Application of SOM neural network in clustering
 J. Biomedical Science and Engineering, 2009, 2, 637-643 doi: 10.4236/jbise.2009.28093 Published Online December 2009 (http://www.scirp.org/journal/jbise/). Application of SOM neural network in clustering
Artificial Neural Networks Examination, March 2004
 Artificial Neural Networks Examination, March 2004 Instructions There are SIXTY questions (worth up to 60 marks). The exam mark (maximum 60) will be added to the mark obtained in the laborations (maximum
An Ontology-based Framework for Modeling Movement on a Smart Campus
 An Ontology-based Framework for Modeling Movement on a Smart Campus Junchuan Fan 1, Kathleen Stewart 1 1 Department of Geographical and Sustainability Sciences, University of Iowa, Iowa City, IA, 52242,
MDSS Functional Prototype Display System Preview April 2002
 MDSS Functional Prototype Display System Preview April 2002 Bill Mahoney National Center for Atmospheric Research Images shown are valid as of 15 April 2002 NCAR MDSS Display System - Overview The MDSS
METHODS FOR STATISTICS
 DYNAMIC CARTOGRAPHIC METHODS FOR VISUALIZATION OF HEALTH STATISTICS Radim Stampach M.Sc. Assoc. Prof. Milan Konecny Ph.D. Petr Kubicek Ph.D. Laboratory on Geoinformatics and Cartography, Department of
Objectives Define spatial statistics Introduce you to some of the core spatial statistics tools available in ArcGIS 9.3 Present a variety of example a
 Introduction to Spatial Statistics Opportunities for Education Lauren M. Scott, PhD Mark V. Janikas, PhD Lauren Rosenshein Jorge Ruiz-Valdepeña 1 Objectives Define spatial statistics Introduce you to some
Interactive Statistics Visualisation based on Geovisual Analytics
 Interactive Statistics Visualisation based on Geovisual Analytics Prof. Mikael Jern NCVA LiU and NComVA AB May 2010 - Spin-off company to focus on Interactive Statistics Visualization and Storytelling
Classic K -means clustering. Classic K -means example (K = 2) Finding the optimal w k. Finding the optimal s n J =
 Finding the optimal w k. Finding the optimal s n J =") Review of classic (GOF K -means clustering x 2 Fall 2015 x 1 Lecture 8, February 24, 2015 K-means is traditionally a clustering algorithm. Learning: Fit K prototypes w k (the rows of some matrix, W to
Review of classic (GOF K -means clustering x 2 Fall 2015 x 1 Lecture 8, February 24, 2015 K-means is traditionally a clustering algorithm. Learning: Fit K prototypes w k (the rows of some matrix, W to
A Method for Comparing Self-Organizing Maps: Case Studies of Banking and Linguistic Data
 Kirt, T., Vainik, E., & Võhandu, L. (2007). A method for comparing selforganizing maps: case studies of banking and linguistic data. In Y. Ioannidis, B. Novikov, & B. Rachev (Eds.), Proceedings of eleventh
Using co-clustering to analyze spatio-temporal patterns: a case study based on spring phenology
 Using co-clustering to analyze spatio-temporal patterns: a case study based on spring phenology R. Zurita-Milla, X. Wu, M.J. Kraak Faculty of Geo-Information Science and Earth Observation (ITC), University
ARTIFICIAL NEURAL NETWORKS گروه مطالعاتي 17 بهار 92
 ARTIFICIAL NEURAL NETWORKS گروه مطالعاتي 17 بهار 92 BIOLOGICAL INSPIRATIONS Some numbers The human brain contains about 10 billion nerve cells (neurons) Each neuron is connected to the others through 10000
Visual Analytics of Flight Trajectories for Uncovering Decision Making Strategies
 Visual Analytics of Flight Trajectories for Uncovering Decision Making Strategies Gennady Andrienko, Natalia Andrienko, Georg Fuchs, Stefan Rüping Fraunhofer Institute IAIS Sankt Augustin, Germany Jose
Self-Organization by Optimizing Free-Energy
 Self-Organization by Optimizing Free-Energy J.J. Verbeek, N. Vlassis, B.J.A. Kröse University of Amsterdam, Informatics Institute Kruislaan 403, 1098 SJ Amsterdam, The Netherlands Abstract. We present
Learning Vector Quantization (LVQ)
") Learning Vector Quantization (LVQ) Introduction to Neural Computation : Guest Lecture 2 John A. Bullinaria, 2007 1. The SOM Architecture and Algorithm 2. What is Vector Quantization? 3. The Encoder-Decoder
Learning Vector Quantization (LVQ) Introduction to Neural Computation : Guest Lecture 2 John A. Bullinaria, 2007 1. The SOM Architecture and Algorithm 2. What is Vector Quantization? 3. The Encoder-Decoder
Vocabulary: Data About Us
 Vocabulary: Data About Us Two Types of Data Concept Numerical data: is data about some attribute that must be organized by numerical order to show how the data varies. For example: Number of pets Measure
ADAPTABLE DASHBOARD FOR VISUALIZATION OF ORIGIN-DESTINATION DATA PATTERNS
 ADAPTABLE DASHBOARD FOR VISUALIZATION OF ORIGIN-DESTINATION DATA PATTERNS Ieva Dobrāja, PhD Candidate Prof. Dr. Menno-Jan Kraak Dr. Yuri Engelhardt NCG Symposium 2017 ADAPTABLE DASHBOARD FOR VISUALIZATION
Question 1. Feedback Lesson 4 Quiz. You submitted this quiz on Tue 27 May :04 PM MYT. You got a score of out of
 Feedback Lesson 4 Quiz You submitted this quiz on Tue 27 May 2014 8:04 PM MYT. You got a score of 15.00 out of 15.00. Question 1 Comparing two or more layers of spatial data on top of each other is an
ADAPTABLE DASHBOARD FOR VISUALIZATION OF ORIGIN-DESTINATION DATA PATTERNS
 ADAPTABLE DASHBOARD FOR VISUALIZATION OF ORIGIN-DESTINATION DATA PATTERNS Ieva Dobrāja, PhD Candidate Prof. Dr. Menno-Jan Kraak Dr. Yuri Engelhardt NCG Symposium 2017 ADAPTABLE DASHBOARD FOR VISUALIZATION
Outline ESDA. Exploratory Spatial Data Analysis ESDA. Luc Anselin
 Exploratory Spatial Data Analysis ESDA Luc Anselin University of Illinois, Urbana-Champaign http://www.spacestat.com Outline ESDA Exploring Spatial Patterns Global Spatial Autocorrelation Local Spatial
Historical Spatio-temporal data in current GIS
 Historical Spatio-temporal data in current GIS Case Study: German-Herero war of resistance 1904 Susanna Ambondo Abraham Matriculation Number: 4576256 First Supervisor: Prof. Dr. Lars Bernard Second Supervisor:
Multi-Plant Photovoltaic Energy Forecasting Challenge with Regression Tree Ensembles and Hourly Average Forecasts
 Multi-Plant Photovoltaic Energy Forecasting Challenge with Regression Tree Ensembles and Hourly Average Forecasts Kathrin Bujna 1 and Martin Wistuba 2 1 Paderborn University 2 IBM Research Ireland Abstract.
Hotspots of Hector s Dolphins On the South Coast
 Hotspots of Hector s Dolphins On the South Coast Judy Rodda 1 and Antoni Moore 1 1 School of Surveying University of Otago, Dunedin, New Zealand Phone: +64 3 479-7585 Fax: +64 3 479-7586 Email: judy.rodda@postgrad.otago.ac.nz
Mapcube and Mapview. Two Web-based Spatial Data Visualization and Mining Systems. C.T. Lu, Y. Kou, H. Wang Dept. of Computer Science Virginia Tech
 Mapcube and Mapview Two Web-based Spatial Data Visualization and Mining Systems C.T. Lu, Y. Kou, H. Wang Dept. of Computer Science Virginia Tech S. Shekhar, P. Zhang, R. Liu Dept. of Computer Science University
CS : Spatial Data Modeling and Analysis. Geovisualization
 CS260-002: Spatial Data Modeling and Analysis Geovisualization Visual Perception Learning Styles & Personality Types: Visual, Auditory, Kinesthetic Cholera cases in the London epidemic of 1854 Cholera
Mobility, Data Mining and Privacy: The GeoPKDD Paradigm
 Mobility, Data Mining and Privacy: The GeoPKDD Paradigm GeoPKDD White paper, KDD Lab November 23, 2009 Abstract The technologies of mobile communications and ubiquitous computing pervade our society, and
CALIOPE EU: Air Quality
 CALIOPE EU: Air Quality CALIOPE EU air quality forecast application User Guide caliope@bsc.es Version 30/09/2015 TABLE OF CONTENTS 1. Description... 1 2. Installation... 1 3. User Guide... 2 3.1 Air quality
Learning Vector Quantization
 Learning Vector Quantization Neural Computation : Lecture 18 John A. Bullinaria, 2015 1. SOM Architecture and Algorithm 2. Vector Quantization 3. The Encoder-Decoder Model 4. Generalized Lloyd Algorithms
Self-organized criticality and the self-organizing map
 PHYSICAL REVIEW E, VOLUME 63, 036130 Self-organized criticality and the self-organizing map John A. Flanagan Neural Networks Research Center, Helsinki University of Technology, P.O. Box 5400, FIN-02015
Effects of Interactive Function Forms and Refractoryperiod in a Self-Organized Critical Model Based on Neural Networks
 Commun. Theor. Phys. (Beijing, China) 42 (2004) pp. 121 125 c International Academic Publishers Vol. 42, No. 1, July 15, 2004 Effects of Interactive Function Forms and Refractoryperiod in a Self-Organized
Ingo Ahrns, Jorg Bruske, Gerald Sommer. Christian Albrechts University of Kiel - Cognitive Systems Group. Preusserstr Kiel - Germany
 On-line Learning with Dynamic Cell Structures Ingo Ahrns, Jorg Bruske, Gerald Sommer Christian Albrechts University of Kiel - Cognitive Systems Group Preusserstr. 1-9 - 24118 Kiel - Germany Phone: ++49
GOVERNMENT MAPPING WORKSHOP RECOVER Edmonton s Urban Wellness Plan Mapping Workshop December 4, 2017
 GOVERNMENT MAPPING WORKSHOP 12.4.17 RECOVER Edmonton s Urban Wellness Plan Mapping Workshop December 4, 2017 In July of 2017, City Council directed administration to develop RECOVER, Edmonton s Urban Wellness
4.5 Comparison of weather data from the Remote Automated Weather Station network and the North American Regional Reanalysis
 4.5 Comparison of weather data from the Remote Automated Weather Station network and the North American Regional Reanalysis Beth L. Hall and Timothy. J. Brown DRI, Reno, NV ABSTRACT. The North American
Using space-time visual analytic methods for exploring the dynamics of ethnic groups' residential patterns
 Using space-time visual analytic methods for exploring the dynamics of ethnic groups' residential patterns Itzhak Omer u *, Peter Bak b and Tobias Schreck c "Department ojgeography &!-hunan Environment,
Neural Network to Control Output of Hidden Node According to Input Patterns
 American Journal of Intelligent Systems 24, 4(5): 96-23 DOI:.5923/j.ajis.2445.2 Neural Network to Control Output of Hidden Node According to Input Patterns Takafumi Sasakawa, Jun Sawamoto 2,*, Hidekazu
Visual Analytics for Transportation: State of the Art and Further Research Directions
 Visual Analytics for Transportation: State of the Art and Further Research Directions Gennady Andrienko, Natalia Andrienko, Wei Chen, Ross Maciejewski, and Ye Zhao Abstract Many cities and countries are
4/18/2006 Olga N. Krankina, OSU
 (Northern Eurasia Landcover Dynamics Analysis) Monitoring and validating the distribution and change in land cover across Northern Eurasia Objectives Characterize land cover and its change across boreal
Regional cooperation: evidence from European cooperative innovation networks
 Regional cooperation: evidence from European cooperative innovation networks Sara Amoroso Alex Coad Nicola Grassano European Commission, JRC, B.3 September 29, 2016 Motivation of the study Regional innovation
A Three-dimensional Physiologically Realistic Model of the Retina
 A Three-dimensional Physiologically Realistic Model of the Retina Michael Tadross, Cameron Whitehouse, Melissa Hornstein, Vicky Eng and Evangelia Micheli-Tzanakou Department of Biomedical Engineering 617
Some Personal Perspectives on Demand Forecasting Past, Present, Future
 Some Personal Perspectives on Demand Forecasting Past, Present, Future Hans Levenbach, PhD Delphus, Inc. INFORMS Luncheon Penn Club, NYC Presentation Overview Introduction Demand Analysis and Forecasting
Developing a network of tourism operations involved in conservation monitoring and wildlife research
 Developing a network of tourism operations involved in conservation monitoring and wildlife research Ronda Green and Peter Wood Wildlife Tourism Australia Workshop 2013 There is a vision of a network of
Making a GIS Intelligent: CommonGIS Project View
 Making a GIS Intelligent: CommonGIS Project View Gennady L. Andrienko, Natalia V. Andrienko GMD - German National Research Center for Information Technology Schloss Birlinghoven, Sankt-Augustin, 53754
This lab exercise will try to answer these questions using spatial statistics in a geographic information system (GIS) context.
 context.") by Introduction Problem Do the patterns of forest fires change over time? Do forest fires occur in clusters, and do the clusters change over time? Is this information useful in fighting forest fires? This
by Introduction Problem Do the patterns of forest fires change over time? Do forest fires occur in clusters, and do the clusters change over time? Is this information useful in fighting forest fires? This
Visualisation of Spatial Data
 Visualisation of Spatial Data VU Visual Data Science Johanna Schmidt WS 2018/19 2 Visual Data Science Introduction to Visualisation Basics of Information Visualisation Charts and Techniques Introduction
Argo data management November 2nd, 2005 Ref : cordo/dti-rap/ Version 1.1 ARGO DATA MANAGEMENT REPORT FRENCH DAC
 Argo data management November 2nd, 2005 Ref : cordo/dti-rap/05-145 Version 1.1 ARGO DATA MANAGEMENT REPORT FRENCH DAC 2 Argo National Data Management Report of France November 2005 Introduction This document
EuroGEOSS for Drought - Linking the European Drought Observatory to global and local scales
 EuroGEOSS for Drought - Linking the European Drought Observatory to global and local scales Barbara Hofer, Stefan Niemeyer, EC-JRC INSPIRE Conference 2010 Cracow June 24, 2010 Drought Relevance Droughts
Mapping and Analysis for Spatial Social Science
 Mapping and Analysis for Spatial Social Science Luc Anselin Spatial Analysis Laboratory Dept. Agricultural and Consumer Economics University of Illinois, Urbana-Champaign http://sal.agecon.uiuc.edu Outline
Scuola di Calcolo Scientifico con MATLAB (SCSM) 2017 Palermo 31 Luglio - 4 Agosto 2017
 2017 Palermo 31 Luglio - 4 Agosto 2017") Scuola di Calcolo Scientifico con MATLAB (SCSM) 2017 Palermo 31 Luglio - 4 Agosto 2017 www.u4learn.it Ing. Giuseppe La Tona Sommario Machine Learning definition Machine Learning Problems Artificial Neural
Scuola di Calcolo Scientifico con MATLAB (SCSM) 2017 Palermo 31 Luglio - 4 Agosto 2017 www.u4learn.it Ing. Giuseppe La Tona Sommario Machine Learning definition Machine Learning Problems Artificial Neural
VISUAL ANALYTICS APPROACH FOR CONSIDERING UNCERTAINTY INFORMATION IN CHANGE ANALYSIS PROCESSES
 VISUAL ANALYTICS APPROACH FOR CONSIDERING UNCERTAINTY INFORMATION IN CHANGE ANALYSIS PROCESSES J. Schiewe HafenCity University Hamburg, Lab for Geoinformatics and Geovisualization, Hebebrandstr. 1, 22297
Lecture 3 GIS outputs. Dr. Zhang Spring, 2017
 Lecture 3 GIS outputs Dr. Zhang Spring, 2017 Model of the course Using and making maps Navigating GIS maps Map design Working with spatial data Geoprocessing Spatial data infrastructure Digitizing File
Application of Clustering to Earth Science Data: Progress and Challenges
 Application of Clustering to Earth Science Data: Progress and Challenges Michael Steinbach Shyam Boriah Vipin Kumar University of Minnesota Pang-Ning Tan Michigan State University Christopher Potter NASA
Spatiotemporal Analysis of Urban Traffic Accidents: A Case Study of Tehran City, Iran
 Spatiotemporal Analysis of Urban Traffic Accidents: A Case Study of Tehran City, Iran January 2018 Niloofar HAJI MIRZA AGHASI Spatiotemporal Analysis of Urban Traffic Accidents: A Case Study of Tehran
ECML PKDD Discovery Challenges 2017
 ECML PKDD Discovery Challenges 2017 Roberto Corizzo 1 and Dino Ienco 2 1 Department of Computer Science, University of Bari Aldo Moro, Bari, Italy roberto.corizzo@uniba.it 2 Irstea, UMR TETIS, Univ. Montpellier,
Exploring interregional trade networks in Europe: Towards a new tool for supporting regional strategies for smart specialisation
 Exploring interregional trade networks in Europe: Towards a new tool for supporting regional strategies for smart specialisation Carlo Gianelle and Ignacio González Vázquez S3 Platform JRC-IPTS European
The Relevance of Cartography. Dubai 2015, Georg Gartner
 The Relevance of Cartography Dubai 2015, Georg Gartner Where are we? Data! Data? We are not short of data Technologies! Technologies? We are not short of technologies Data-driven and technology-driven
INTRODUCTION. In March 1998, the tender for project CT.98.EP.04 was awarded to the Department of Medicines Management, Keele University, UK.
 INTRODUCTION In many areas of Europe patterns of drug use are changing. The mechanisms of diffusion are diverse: introduction of new practices by new users, tourism and migration, cross-border contact,
Exploratory Hierarchical Clustering for Management Zone Delineation in Precision Agriculture
 Exploratory Hierarchical Clustering for Management Zone Delineation in Precision Agriculture Georg Ruß, Rudolf Kruse Otto-von-Guericke-Universität Magdeburg, Germany {russ,kruse}@iws.cs.uni-magdeburg.de
Alternative Visualization of Large Geospatial Datasets
 The Cartographic Journal Vol. 41 No. 3 pp. 217 228 December 2004 The British Cartographic Society 2004 REFEREED PAPER Alternative Visualization of Large Geospatial Datasets Etien L. Koua and Menno-Jan
The UN discusses Global Geospatial Information Management
 The UN discusses Global Geospatial Information Management Just like statistics, every country must have authoritative, trusted, maintained, definitive mapping data Professor Paul Cheung, Director, United
y(n) Time Series Data
 Time Series Data") Recurrent SOM with Local Linear Models in Time Series Prediction Timo Koskela, Markus Varsta, Jukka Heikkonen, and Kimmo Kaski Helsinki University of Technology Laboratory of Computational Engineering
Recurrent SOM with Local Linear Models in Time Series Prediction Timo Koskela, Markus Varsta, Jukka Heikkonen, and Kimmo Kaski Helsinki University of Technology Laboratory of Computational Engineering
A case study for self-organized criticality and complexity in forest landscape ecology
 Chapter 1 A case study for self-organized criticality and complexity in forest landscape ecology Janine Bolliger Swiss Federal Research Institute (WSL) Zürcherstrasse 111; CH-8903 Birmendsdorf, Switzerland
Mapping collective human activity in an urban environment based on mobile phone data
 Mapping collective human activity in an urban environment based on mobile phone data Sagl G., Delmelle E.M., Delmelle E.C. January 2014. Keywords: urban dynamics, mobile phone, geovisual analytics, geocomputation,
Protein Complex Identification by Supervised Graph Clustering
 Protein Complex Identification by Supervised Graph Clustering Yanjun Qi 1, Fernanda Balem 2, Christos Faloutsos 1, Judith Klein- Seetharaman 1,2, Ziv Bar-Joseph 1 1 School of Computer Science, Carnegie
Structure-Activity Modeling - QSAR. Uwe Koch
 Structure-Activity Modeling - QSAR Uwe Koch QSAR Assumption: QSAR attempts to quantify the relationship between activity and molecular strcucture by correlating descriptors with properties Biological activity
WEB application for the analysis of spatio-temporal data
 EXTERNAL SCIENTIFIC REPORT APPROVED: 17 October 2016 WEB application for the analysis of spatio-temporal data Abstract Machteld Varewyck (Open Analytics NV), Tobias Verbeke (Open Analytics NV) In specific
Anomaly Detection. Jing Gao. SUNY Buffalo
 Anomaly Detection Jing Gao SUNY Buffalo 1 Anomaly Detection Anomalies the set of objects are considerably dissimilar from the remainder of the data occur relatively infrequently when they do occur, their
Research Group Cartography
 Research Group Cartography Research Group Cartography Towards supporting wayfinding LBS components 1. Mobile devices 2. Communication Network 3. Positioning Component 4. Service and Application Provider
Self Organizing Maps. We are drowning in information and starving for knowledge. A New Approach for Integrated Analysis of Geological Data.
 Radiometrics Processed Landsat TM Self Organizing Maps A New Approach for Integrated Analysis of Geological Data. We are drowning in information and starving for knowledge. Rutherford D. Roger Stephen.Fraser@csiro.au
Disaster Mitigation Competence Centre Project Meeting Coordinator: Simon Lin
 Disaster Mitigation Competence Centre Project Meeting Coordinator: Simon Lin April 26, 2018 Agenda Introduction (Simon Lin) From Previous Meeting on March 17, 2015 (Eric Yen) Progress Report (Eric Yen)
Treemaps and Choropleth Maps Applied to Regional Hierarchical Statistical Data
 Treemaps and Choropleth Maps Applied to Regional Hierarchical Statistical Data Mikael Jern, Jakob Rogstadius, Tobias Åström NCVA National Center for Visual Analytics, Linkoping University, Sweden mikael.jern@itn.liu.se,
Stochastic Generative Hashing
 Stochastic Generative Hashing B. Dai 1, R. Guo 2, S. Kumar 2, N. He 3 and L. Song 1 1 Georgia Institute of Technology, 2 Google Research, NYC, 3 University of Illinois at Urbana-Champaign Discussion by
Self-organizing Neural Networks
 Bachelor project Self-organizing Neural Networks Advisor: Klaus Meer Jacob Aae Mikkelsen 19 10 76 31. December 2006 Abstract In the first part of this report, a brief introduction to neural networks in