Spatial Pattern Analysis: Mapping Trends and Clusters
|
|
|
- Dylan Woods
- 6 years ago
- Views:
Transcription


1 2013 Esri International User Conference July 8 12, 2013 San Diego, California Technical Workshop Spatial Pattern Analysis: Mapping Trends and Clusters Lauren Rosenshein Bennett Brett Rose


2 Presentation Outline DESCRIBE spatial patterns MINIMIZE subjectivity DISCOVER spatial clusters DEMOS Understanding Distributions Exploring patterns Crime in DC Multi-dimensional data analysis
 directly into their mathematics They")
3 What are Spatial Statistics in ArcGIS? A set of exploratory methods and techniques Specifically developed for use with geographic data - They incorporate space (area, length, proximity, orientation) directly into their mathematics They describe and model: - Spatial Distributions - Spatial Patterns - Spatial Processes - Spatial Relationships Spatial al statistics extend what the eyes and mind do intuitively to assess spatial al patterns, trends and relationships ps.


4 Why use spatial statistics? Spatial Statistics help us assess: Patterns Relationships Trends L&L Car Rental How we present our results (colors, class breaks, symbols ) can either enhance or obscure communication. L&L Car Rental
5 DESCRIBE spatial patterns


6 Extracting Information from Data


7 Making sense of our data


 - Spatial distribution (standard")
8 Describing Spatial Data Whenever we look at data, we immediately want to understand: - Mean - Standard Deviations - Whenever we look at spatial data, we think about the same things: - Centrality (mean) - Spatial distribution (standard deviations) - 8


9 Describing Spatial Data Questions - Which site is most accessible? - Where is the population center and how it is changing over time? - Which gang territories have the broadest spatial distribution, and do they overlap? - Is there a directional trend in the spatial distribution of social unrest? Is it changing over time? 9


10 Directional distribution Normal distribution 99% 95% 68% 1 = 68% of features Mean + 2 = 95% of features 3 = 99% of features

11 Demo Social Media Analysis
12 MINIMIZING subjectivity
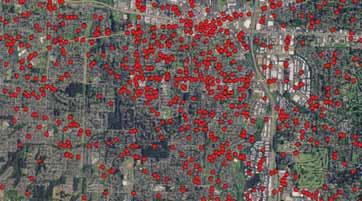
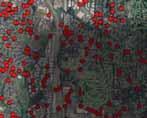
13 Points on a map Crime in Lincoln, Nebraska How intense is the clustering? Where are the hot spots?


14 The subjectivity of visual pattern analysis Crime density surfaces Where are the hot spots? Where are the clusters?
15 Maps can lie Crime density surfaces Standard deviations Quantile Where are the hot spots? Where are the clusters?

16 Demo Minimizing Subjectivity: Hot Spot Analysis


17 Inferential statistics Are these crime just random acts? What is the chance that the patterns we see are the result of random processes? Is it just bad luck? Armed Conflict in Africa Crime in Lincoln, Nebraska


18 Inferential statistics The tools tell us how likely it is that the pattern is random - p-values - z-scores Armed Conflict in Africa Crime in Lincoln, Nebraska

19 What are p-values? What are z-scores? Probability theory p-values are probabilities z-scores are standard deviations How would you interpret a z-score of 2.58, with a p-value of 0.01? Given the z-score of 2.58, there is less than 1% likelihood that this cluster of high values could be the result of random chance z-scores can be mapped to specific p-values - p-value 0.01 = z-score +/ p-value 0.05 = z-score +/ p-value 0.10 = z-score +/-1.65
20 DISCOVER spatial clusters


21 Mapping Spatial Clusters Mapping spatial clusters - Hot and cold spots - Spatial outliers - Similar features Where are the 911 call hot spots? Which countries face similar challenges? Which homes sold for more than expected?
22 Mapping Spatial Clusters Questions Tools Examples Where are the hot spots? Where are the cold spots? How intense is the clustering? Hot Spot Analysis Cluster and Outlier Analysis Where are the sharpest boundaries between affluence and poverty? Where are biological diversity and habitat quality highest? Where are the spatial outliers? How can resources be most effectively deployed? Cluster and Outlier Analysis Hot Spot Analysis Where do we find anomalous spending patterns in Los Angeles? Where do we see unexpectedly high rates of diabetes? Where are kitchen fires a higher-than-expected proportion of residential fires? Which locations are farthest from the problem? Which features are most alike? What does the spatial fabric of the data look like? Hot Spot Analysis Grouping Analysis Where should evacuation sites be located? Which crimes in the database are most similar to the one just committed? Which disease incidents are likely part of the same outbreak?


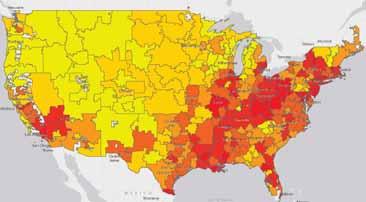
23 Cluster and Outlier Analysis of Voting Patterns Percentage of Obama and McCain votes.

 Use the.")
24 Space-Time Cluster Analysis Defining the space-time window Create the space-time weights matrix file (.swm) Use the.swm to perform cluster analyses
25 Space-time vs Time Snapshots Time-slices can disconnect related features Space-time relationships are relative to each feature s date stamp

26 Space-Time Cluster Analysis Visualization Default symbology at 10.1 is a 2D display To see the temporal patterns: - Animate the results or - Use 3D symbols in ArcGlobe or ArcScene

27 Grouping Analysis Group 1: low income, low education, high unemployment, high crime Group 2: middle values for all variables Group 3: higher income and education, lower unemployment and crime Multi-dimensional data analysis simplifies complex data

28 Demo Grouping Analysis

29 Grouping Analysis Group HH Resilience Climate Governance Pop Density 1 Best Moderate Moderate Low 2 Moderate Worst Worst Moderate 3 Worst Moderate Best Moderate 4 Moderate Best Moderate Worst
30 Resources for learning more QUESTIONS? - Short videos - Articles and blogs - Online documentation - Supplementary model and script tools - Hot spot, Regression, and ModelBuilder tutorials - LBennett@Esri.com BRose@Esri.com
Spatial Pattern Analysis: Mapping Trends and Clusters. Lauren M. Scott, PhD Lauren Rosenshein Bennett, MS
 Spatial Pattern Analysis: Mapping Trends and Clusters Lauren M. Scott, PhD Lauren Rosenshein Bennett, MS Presentation Outline Spatial statistics overview Describing spatial patterns Quantifying spatial
Spatial Pattern Analysis: Mapping Trends and Clusters
 Esri International User Conference San Diego, California Technical Workshops July 24, 2012 Spatial Pattern Analysis: Mapping Trends and Clusters Lauren M. Scott, PhD Lauren Rosenshein Bennett, MS Presentation
Objectives Define spatial statistics Introduce you to some of the core spatial statistics tools available in ArcGIS 9.3 Present a variety of example a
 Introduction to Spatial Statistics Opportunities for Education Lauren M. Scott, PhD Mark V. Janikas, PhD Lauren Rosenshein Jorge Ruiz-Valdepeña 1 Objectives Define spatial statistics Introduce you to some
Modeling Spatial Relationships Using Regression Analysis
 Esri International User Conference San Diego, California Technical Workshops July 24, 2012 Modeling Spatial Relationships Using Regression Analysis Lauren M. Scott, PhD Lauren Rosenshein Bennett, MS Answering
Modeling Spatial Relationships using Regression Analysis
 Esri International User Conference San Diego, CA Technical Workshops July 2011 Modeling Spatial Relationships using Regression Analysis Lauren M. Scott, PhD Lauren Rosenshein, MS Mark V. Janikas, PhD Answering
Modeling Spatial Relationships Using Regression Analysis. Lauren M. Scott, PhD Lauren Rosenshein Bennett, MS
 Modeling Spatial Relationships Using Regression Analysis Lauren M. Scott, PhD Lauren Rosenshein Bennett, MS Workshop Overview Answering why? questions Introduce regression analysis - What it is and why
Finding Hot Spots in ArcGIS Online: Minimizing the Subjectivity of Visual Analysis. Nicholas M. Giner Esri Parrish S.
 Finding Hot Spots in ArcGIS Online: Minimizing the Subjectivity of Visual Analysis Nicholas M. Giner Esri Parrish S. Henderson - FBI Agenda The subjectivity of maps What is Hot Spot Analysis? What is Outlier
Finding Hot Spots in ArcGIS Online: Minimizing the Subjectivity of Visual Analysis. Nicholas M. Giner Esri Parrish S.
 Finding Hot Spots in ArcGIS Online: Minimizing the Subjectivity of Visual Analysis Nicholas M. Giner Esri Parrish S. Henderson FBI Agenda The subjectivity of maps What is Hot Spot Analysis? Why do Hot
Lecture 4. Spatial Statistics
 Lecture 4 Spatial Statistics Lecture 4 Outline Statistics in GIS Spatial Metrics Cell Statistics Neighborhood Functions Neighborhood and Zonal Statistics Mapping Density (Density surfaces) Hot Spot Analysis
ArcGIS Online Analytics. Mike Flanagan
 ArcGIS Online Analytics Mike Flanagan MFlanagan@esri.com Agenda Introduction to ArcGIS Online Spatial Analysis ArcGIS Online Spatial Analysis Workflow Demos and Examples Wrap-up Q&A ArcGIS A complete web
GIS Test Drive What a Geographic Information System Is and What it Can Do. Alison Davis-Holland
 GIS Test Drive What a Geographic Information System Is and What it Can Do Alison Davis-Holland adavisholland@gmail.com WHO AM I? Geospatial Analyst M.S. in Geographic and Cartographic Sciences Use GIS
Introduction to Spatial Analysis in ArcGIS Online. Jian Lange, Vicki Lynn Cove
 Introduction to Spatial Analysis in ArcGIS Online Jian Lange, Vicki Lynn Cove Topics Introducing ArcGIS Online Spatial Analysis ArcGIS Online Spatial Analysis Workflow Demos and examples - Using ArcGIS
In matrix algebra notation, a linear model is written as
 DM3 Calculation of health disparity Indices Using Data Mining and the SAS Bridge to ESRI Mussie Tesfamicael, University of Louisville, Louisville, KY Abstract Socioeconomic indices are strongly believed
An Overview of Solving Spatial Problems Using ArcGIS
 Esri International User Conference San Diego, CA Technical Workshops An Overview of Solving Spatial Problems Using ArcGIS Linda Beale, Jian Lange July 12 th, 2011 Real World Example Using Spatial Analysis
Lecture 1 Introduction to GIS. Dr. Zhang Spring, 2017
 Lecture 1 Introduction to GIS Dr. Zhang Spring, 2017 Topics of the course Using and making maps Navigating GIS Map design Working with spatial data Geoprocessing Spatial data infrastructure Digitizing
ArcGIS Pro: Analysis and Geoprocessing. Nicholas M. Giner Esri Christopher Gabris Blue Raster
 ArcGIS Pro: Analysis and Geoprocessing Nicholas M. Giner Esri Christopher Gabris Blue Raster Agenda What is Analysis and Geoprocessing? Analysis in ArcGIS Pro - 2D (Spatial xy) - 3D (Elevation - z) - 4D
Concepts and Applications of Kriging
 2013 Esri International User Conference July 8 12, 2013 San Diego, California Technical Workshop Concepts and Applications of Kriging Eric Krause Konstantin Krivoruchko Outline Intro to interpolation Exploratory
Effective Use of Geographic Maps
 Effective Use of Geographic Maps Purpose This tool provides guidelines and tips on how to effectively use geographic maps to communicate research findings. Format This tool provides guidance on geographic
Concepts and Applications of Kriging
 Esri International User Conference San Diego, California Technical Workshops July 24, 2012 Concepts and Applications of Kriging Konstantin Krivoruchko Eric Krause Outline Intro to interpolation Exploratory
The Changing Landscape of Land Administration
 The Changing Landscape of Land Administration B r e n t J o n e s P E, PLS E s r i World s Largest Media Company No Journalists No Content Producers No Photographers World s Largest Hospitality Company
Arcmap Manual Esri 10 READ ONLINE
 Arcmap Manual Esri 10 READ ONLINE Esri Store: Browsing ArcPad 10.2.2 - ArcPad is mobile field mapping and data collection software designed for GIS professionals. It includes advanced GIS and GPS capabilities
Lecture 3 GIS outputs. Dr. Zhang Spring, 2017
 Lecture 3 GIS outputs Dr. Zhang Spring, 2017 Model of the course Using and making maps Navigating GIS maps Map design Working with spatial data Geoprocessing Spatial data infrastructure Digitizing File
Software requirements * :
 Title: Product Type: Developer: Target audience: Format: Software requirements * : Using GRACE to evaluate change in Greenland s ice sheet Part I: Download, import and map GRACE data Part II: View and
Using Spatial Statistics Social Service Applications Public Safety and Public Health
 Using Spatial Statistics Social Service Applications Public Safety and Public Health Lauren Rosenshein 1 Regression analysis Regression analysis allows you to model, examine, and explore spatial relationships,
Dr Arulsivanathan Naidoo Statistics South Africa 18 October 2017
 ESRI User Conference 2017 Space Time Pattern Mining Analysis of Matric Pass Rates in Cape Town Schools Dr Arulsivanathan Naidoo Statistics South Africa 18 October 2017 Choose one of the following Leadership
GED 554 IT & GIS. Lecture 6 Exercise 5. May 10, 2013
 GED 554 IT & GIS Lecture 6 Exercise 5 May 10, 2013 Free GIS data sources ******************* Mapping numerical data & Symbolization ******************* Exercise: Making maps for presentation GIS DATA SOFTWARE
Concepts and Applications of Kriging. Eric Krause
 Concepts and Applications of Kriging Eric Krause Sessions of note Tuesday ArcGIS Geostatistical Analyst - An Introduction 8:30-9:45 Room 14 A Concepts and Applications of Kriging 10:15-11:30 Room 15 A
Integrating Open-Source Statistical Packages with ArcGIS
 Esri International User Conference San Diego, California Technical Workshops 7-25-12 Integrating Open-Source Statistical Packages with ArcGIS Mark V. Janikas, Ph. D. Xing Kang Outline Introduction to Spatial
Arcmap Manual Esri 10 READ ONLINE
 Arcmap Manual Esri 10 READ ONLINE If searching for a book Arcmap manual esri 10 in pdf form, then you have come on to the loyal site. We present the utter release of this book in PDF, doc, DjVu, epub,
ArcGIS Pro Q&A Session. NWGIS Conference, October 11, 2017 With John Sharrard, Esri GIS Solutions Engineer
 ArcGIS Pro Q&A Session NWGIS Conference, October 11, 2017 With John Sharrard, Esri GIS Solutions Engineer jsharrard@esri.com ArcGIS Desktop The applications ArcGIS Pro ArcMap ArcCatalog ArcScene ArcGlobe
Migrating Defense Workflows from ArcMap to ArcGIS Pro. Renee Bernstein and Jared Sellers
 Migrating Defense Workflows from ArcMap to ArcGIS Pro Renee Bernstein and Jared Sellers ArcGIS Desktop Desktop Web Device ArcMap ArcCatalog ArcScene ArcGlobe ArcGIS Pro portal Server Online Content and
Spatial Analysis I. Spatial data analysis Spatial analysis and inference
 Spatial Analysis I Spatial data analysis Spatial analysis and inference Roadmap Outline: What is spatial analysis? Spatial Joins Step 1: Analysis of attributes Step 2: Preparing for analyses: working with
Geospatial Analysis of Job-Housing Mismatch Using ArcGIS and Python
 Geospatial Analysis of Job-Housing Mismatch Using ArcGIS and Python 2016 ESRI User Conference June 29, 2016 San Diego, CA Jung Seo, Frank Wen, Simon Choi and Tom Vo, Research & Analysis Southern California
Implications for the Sharing Economy
 Locational Big Data and Analytics: Implications for the Sharing Economy AMCIS 2017 SIGGIS Workshop Brian N. Hilton, Ph.D. Associate Professor Director, Advanced GIS Lab Center for Information Systems and
Concepts and Applications of Kriging. Eric Krause Konstantin Krivoruchko
 Concepts and Applications of Kriging Eric Krause Konstantin Krivoruchko Outline Introduction to interpolation Exploratory spatial data analysis (ESDA) Using the Geostatistical Wizard Validating interpolation
Performing Advanced Cartography with Esri Production Mapping
 Esri International User Conference San Diego, California Technical Workshops July 25, 2012 Performing Advanced Cartography with Esri Production Mapping Tania Pal & Madhura Phaterpekar Agenda Outline generic
Physical Geography Lab Activity #15
 Physical Geography Lab Activity #15 Due date Name Choropleth Maps COR Objective 1 & 7, SLOs 1 & 3 15.1. Introduction Up until this point we have used maps to find locations on the Earth. While they are
Map Makeovers: How to Make Your Map Great!
 Esri International User Conference San Diego, CA Technical Workshops Map Makeovers: How to Make Your Map Great! Charlie Frye, Esri, Redlands, Jim Herries, Esri, Redlands Session Goals Demonstrate cartographic
Big Data Discovery and Visualisation Insights for ArcGIS
 Big Data Discovery and Visualisation Insights for ArcGIS Create Enrich - Collaborate Lee Kum Cheong GIS CONVERSATIONS At Esri, we believe people can do amazing things with applied geography. GIS CONVERSATIONS
Working with Temporal Data in ArcGIS
 Working with Temporal Data in ArcGIS By Aileen Buckley, Esri Research Cartographer Time is an important dimension in many types of geospatial visualizations and analyses. The temporal aspect adds when
CAS GE 365 Introduction to Geographical Information Systems. The Applications of GIS are endless
 Spring 2007 CAS GE 365 Introduction to Geographical Information Systems Boston University Department of Geography and Environment The Applications of GIS are endless images from www.esri.com CAS GE 365
Crime Analysis. GIS Solutions for Intelligence-Led Policing
 Crime Analysis GIS Solutions for Intelligence-Led Policing Applying GIS Technology to Crime Analysis Know Your Community Analyze Your Crime Use Your Advantage GIS aids crime analysis by Identifying and
Cartographic Adaptations of the GAIA Visualization Method for Spatial Decision Support
 International MCDA Workshop on PROMETHEE: Research and Case Studies Cartographic Adaptations of the GAIA Visualization Method for Spatial Decision Support Karim LIDOUH January 22, 2014 Context Spatial
DP Project Development Pvt. Ltd.
 Dear Sir/Madam, Greetings!!! Thanks for contacting DP Project Development for your training requirement. DP Project Development is leading professional training provider in GIS technologies and GIS application
Introduction to Coastal GIS
 Introduction to Coastal GIS Event was held on Tues, 1/8/13 - Thurs, 1/10/13 Time: 9:00 am to 5:00 pm Location: Roger Williams University, Bristol, RI Audience: The intended audiences for this course are
ArcGIS for Desktop. ArcGIS for Desktop is the primary authoring tool for the ArcGIS platform.
 ArcGIS for Desktop ArcGIS for Desktop ArcGIS for Desktop is the primary authoring tool for the ArcGIS platform. Beyond showing your data as points on a map, ArcGIS for Desktop gives you the power to manage
CS : Spatial Data Modeling and Analysis. Geovisualization
 CS260-002: Spatial Data Modeling and Analysis Geovisualization Visual Perception Learning Styles & Personality Types: Visual, Auditory, Kinesthetic Cholera cases in the London epidemic of 1854 Cholera
Demographic characteristics of the School of International Studies 9 th Grade class and their success their first semester.
 Project Tutorial 1. Topic Demographic characteristics of the School of International Studies 9 th Grade class and their success their first semester. 2. Research Question/Problem For the 9 th Grade class
Esri Maps for Office
 2013 Europe, Middle East, and Africa User Conference October 23-25, 2013 Munich, Germany Maps for Office Tony Howser Technical Product Manager Agenda Location Analytics Maps for Office 2.1.2 Road Ahead
Everything is related to everything else, but near things are more related than distant things.
 SPATIAL ANALYSIS DR. TRIS ERYANDO, MA Everything is related to everything else, but near things are more related than distant things. (attributed to Tobler) WHAT IS SPATIAL DATA? 4 main types event data,
Application of the Getis-Ord Gi* statistic (Hot Spot Analysis) to seafloor organisms
 to seafloor organisms") Application of the Getis-Ord Gi* statistic (Hot Spot Analysis) to seafloor organisms Diana Watters Research Fisheries Biologist Habitat Ecology Team Santa Cruz, CA Southwest Fisheries Science Center Fisheries
Application of the Getis-Ord Gi* statistic (Hot Spot Analysis) to seafloor organisms Diana Watters Research Fisheries Biologist Habitat Ecology Team Santa Cruz, CA Southwest Fisheries Science Center Fisheries
Outline. ArcGIS? ArcMap? I Understanding ArcMap. ArcMap GIS & GWR GEOGRAPHICALLY WEIGHTED REGRESSION. (Brief) Overview of ArcMap
 Overview of ArcMap") GEOGRAPHICALLY WEIGHTED REGRESSION Outline GWR 3.0 Software for GWR (Brief) Overview of ArcMap Displaying GWR results in ArcMap stewart.fotheringham@nuim.ie http://ncg.nuim.ie ncg.nuim.ie/gwr/ ArcGIS?
GEOGRAPHICALLY WEIGHTED REGRESSION Outline GWR 3.0 Software for GWR (Brief) Overview of ArcMap Displaying GWR results in ArcMap stewart.fotheringham@nuim.ie http://ncg.nuim.ie ncg.nuim.ie/gwr/ ArcGIS?
Are You Maximizing The Value Of All Your Data?
 Are You Maximizing The Value Of All Your Data? Using The SAS Bridge for ESRI With ArcGIS Business Analyst In A Retail Market Analysis SAS and ESRI: Bringing GIS Mapping and SAS Data Together Presented
DANIEL WILSON AND BEN CONKLIN. Integrating AI with Foundation Intelligence for Actionable Intelligence
 DANIEL WILSON AND BEN CONKLIN Integrating AI with Foundation Intelligence for Actionable Intelligence INTEGRATING AI WITH FOUNDATION INTELLIGENCE FOR ACTIONABLE INTELLIGENCE in an arms race for artificial
Outline. Introduction to SpaceStat and ESTDA. ESTDA & SpaceStat. Learning Objectives. Space-Time Intelligence System. Space-Time Intelligence System
 Outline I Data Preparation Introduction to SpaceStat and ESTDA II Introduction to ESTDA and SpaceStat III Introduction to time-dynamic regression ESTDA ESTDA & SpaceStat Learning Objectives Activities
Geovisualization. Luc Anselin. Copyright 2016 by Luc Anselin, All Rights Reserved
 Geovisualization Luc Anselin http://spatial.uchicago.edu from EDA to ESDA from mapping to geovisualization mapping basics multivariate EDA primer From EDA to ESDA Exploratory Data Analysis (EDA) reaction
June 19 Huntsville, Alabama 1
 June 19 Huntsville, Alabama 1 Real-Time Geospatial Data: The Fusion of PI and ArcGIS Enabling Smarter Facilities Management OSIsoft and Esri Mapping and Location Analytics Platform Supporting Your Use
Introduction To Raster Based GIS Dr. Zhang GISC 1421 Fall 2016, 10/19
 Introduction To Raster Based GIS Dr. Zhang GISC 1421 Fall 2016, 10/19 Model of the course Using and making maps Navigating GIS maps Map design Working with spatial data Geoprocessing Spatial data infrastructure
A.1 Spatial Statistics in ArcGIS
 A.1 Spatial Statistics in ArcGIS Lauren M. Scott and Mark V. Janikas A.1.1 Introduction With over a million software users worldwide, and installations at over 5,000 universities, Environmental Systems
ESRI GUIDE TO GIS ANALYSIS
 page 1 / 5 page 2 / 5 esri guide to gis pdf ESRI Shapefile Technical Description J-7855 March 1998 2 SDE, ARC/INFO, PC ARC/INFO, Data Automation Kit (DAK ), and ArcCAD software provide shape-to-coverage
Regression Analysis of 911 call frequency in Portland, OR Urban Areas in Relation to Call Center Vicinity Elyse Maurer March 13, 2015
 Regression Analysis of 911 call frequency in Portland, OR Urban Areas in Relation to Call Center Vicinity Elyse Maurer March 13, 2015 Introduction: Using the Linear Regression and Geographically Weighted
Cluster Analysis using SaTScan
 Cluster Analysis using SaTScan Summary 1. Statistical methods for spatial epidemiology 2. Cluster Detection What is a cluster? Few issues 3. Spatial and spatio-temporal Scan Statistic Methods Probability
Esri Production Mapping: Map Automation & Advanced Cartography MADHURA PHATERPEKAR JOE SHEFFIELD
 Esri Production Mapping: Map Automation & Advanced Cartography MADHURA PHATERPEKAR JOE SHEFFIELD Traditional Cartography What you really want Cartographic Workflow Output Cartographic Data Symbology Layout
The Pace of Change Is Accelerating Creating Many Challenges
 VISION The Pace of Change Is Accelerating Creating Many Challenges Evidence Threatening Our Natural World and Our Future as Humans Social Conflict Mass Migration Ocean Acidification Food Population Urbanization
Mapping Quality of Life with Chernoff Faces. Joseph G. Spinelli and Yu Zhou
 Mapping Quality of Life with Chernoff Faces Joseph G. Spinelli and Yu Zhou Abstract Cartographers are interested in creating multivariate symbol maps as a creative expression of spatial information. In
Spatial Data, Spatial Analysis and Spatial Data Science
 Spatial Data, Spatial Analysis and Spatial Data Science Luc Anselin http://spatial.uchicago.edu 1 spatial thinking in the social sciences spatial analysis spatial data science spatial data types and research
Cluster Analysis using SaTScan. Patrick DeLuca, M.A. APHEO 2007 Conference, Ottawa October 16 th, 2007
 Cluster Analysis using SaTScan Patrick DeLuca, M.A. APHEO 2007 Conference, Ottawa October 16 th, 2007 Outline Clusters & Cluster Detection Spatial Scan Statistic Case Study 28 September 2007 APHEO Conference
In this exercise we will learn how to use the analysis tools in ArcGIS with vector and raster data to further examine potential building sites.
 GIS Level 2 In the Introduction to GIS workshop we filtered data and visually examined it to determine where to potentially build a new mixed use facility. In order to get a low interest loan, the building
Crime Analyst Extension. Christine Charles
 Crime Analyst Extension Christine Charles ccharles@esricanada.com Agenda Why use Crime Analyst? Overview Tools Demo Interoperability With our old software it could take a police officer up to forty minutes
Calculating Conflict Density and Change over Time in Uganda using Vector Techniques
 Calculating Conflict Density and Change over Time in Uganda using Vector Techniques Created by Patrick Florance and Kyle Monahan; revised by Patrick Florance April 2, 2018. OVERVIEW... 1 SET UP... 1 SET
Sampling Distributions of the Sample Mean Pocket Pennies
 You will need 25 pennies collected from recent day-today change Some of the distributions of data that you have studied have had a roughly normal shape, but many others were not normal at all. What kind
GIST 4302/5302: Spatial Analysis and Modeling
 GIST 4302/5302: Spatial Analysis and Modeling Lecture 2: Review of Map Projections and Intro to Spatial Analysis Guofeng Cao http://thestarlab.github.io Department of Geosciences Texas Tech University
This report details analyses and methodologies used to examine and visualize the spatial and nonspatial
 Analysis Summary: Acute Myocardial Infarction and Social Determinants of Health Acute Myocardial Infarction Study Summary March 2014 Project Summary :: Purpose This report details analyses and methodologies
ENV208/ENV508 Applied GIS. Week 1: What is GIS?
 ENV208/ENV508 Applied GIS Week 1: What is GIS? 1 WHAT IS GIS? A GIS integrates hardware, software, and data for capturing, managing, analyzing, and displaying all forms of geographically referenced information.
Agenda. What can GIS do? Use of Geographical Information Systems (GIS) in Health Care. What is Geographical Information Systems (GIS)?
 in Health Care. What is Geographical Information Systems (GIS)?") For: Presenter: Use of Geographical Information Systems (GIS) in Health Care Center for Global Development Naoru Koizumi, PhD, Assistant Professor School of Public Policy, George Mason University Agenda
For: Presenter: Use of Geographical Information Systems (GIS) in Health Care Center for Global Development Naoru Koizumi, PhD, Assistant Professor School of Public Policy, George Mason University Agenda
Approaches to Spatial Analysis. Flora Vale, Linda Beale, Mark Harrower, Clint Brown Esri Redlands
 Approaches to Spatial Analysis Flora Vale, Linda Beale, Mark Harrower, Clint Brown Esri Redlands Analysis (noun) Detailed examination of the elements or structure of something, as a basis for discussion,
from
 8Map Generalization and Classification Our human and natural environments are complex and full of detail. Maps work by strategically reducing detail and grouping phenomena together. Driven by your intent,
Neighborhood social characteristics and chronic disease outcomes: does the geographic scale of neighborhood matter? Malia Jones
 Neighborhood social characteristics and chronic disease outcomes: does the geographic scale of neighborhood matter? Malia Jones Prepared for consideration for PAA 2013 Short Abstract Empirical research
ArcGIS & Extensions - Synergy of GIS tools. Synergy. Analyze & Visualize
 Using ArcGIS Extensions to Analyze and Visualize data Colin Childs 1 Topics Objectives Synergy Analysis & Visualization ArcGIS Analysis environments Geoprocessing tools Extensions ArcMap The analysis Process
Mapping Your Educational Research: Putting Spatial Concepts into Practice with GIS. Mark Hogrebe Washington University in St.
 Mapping Your Educational Research: Putting Spatial Concepts into Practice with GIS Mapping Your Educational Research: Putting Spatial Concepts into Practice with GIS Mark Hogrebe Washington University
Working with ArcGIS: Classification
 Working with ArcGIS: Classification 2 Abbreviations D-click R-click TOC Double Click Right Click Table of Content Introduction The benefit from the use of geographic information system (GIS) software is
ArcGIS Platform For NSOs
 ArcGIS Platform For NSOs Applying GIS and Spatial Thinking to Official Statistics Esri UC 2014 Demo Theater Applying GIS at the NSO Generic Statistical Business Process Model (GSBPM) 1 Specify Needs 2
SCHOOL OF ENGINEERING AND TECHNOLOGY COMPUTER LAB
 PHASE 1_6 TH SESSION ARCGIS TRAINING AT KU GIS LABS: INTRODUCTION TO GIS: EXPLORING ARCCATALOG AND ARCGIS TOOLS 6 TH SESSION REPORT: 3 RD -5 TH SEPTEMBER 2014 SCHOOL OF ENGINEERING AND TECHNOLOGY COMPUTER
Spatial Statistical Analysis of burglary Crime in Chennai City Promoters Apartments: A CASE STUDY
 Spatial Statistical Analysis of burglary Crime in Chennai City Promoters Apartments: A CASE STUDY M.Vijaya Kumar Assistant Professor K.S.R.College of Engineering Tiruchengode Dr.C.Chandrasekar Associate
Exploratory Spatial Data Analysis and GeoDa
 Exploratory Spatial Data Analysis and GeoDa Luc Anselin Spatial Analysis Laboratory Dept. Agricultural and Consumer Economics University of Illinois, Urbana-Champaign http://sal.agecon.uiuc.edu Outline
Spatial Analysis with ArcGIS Pro STUDENT EDITION
 Spatial Analysis with ArcGIS Pro STUDENT EDITION Copyright 2018 Esri All rights reserved. Course version 2.0. Version release date November 2018. Printed in the United States of America. The information
Introduction to ArcGIS Maps for Office. Greg Ponto Scott Ball
 Introduction to ArcGIS Maps for Office Greg Ponto Scott Ball Agenda What is Maps for Office? Platform overview What are Apps for the Office? ArcGIS Maps for Office features - Visualization - Geoenrichment
Working with ArcGIS Online
 Esri International User Conference San Diego, CA Technical Workshops July 12, 2011 Working with ArcGIS Online Bern Szukalski, Deane Kensok Topics for this Session ArcGIS Online Overview ArcGIS Online Content
1. Regressions and Regression Models. 2. Model Example. EEP/IAS Introductory Applied Econometrics Fall Erin Kelley Section Handout 1
 1. Regressions and Regression Models Simply put, economists use regression models to study the relationship between two variables. If Y and X are two variables, representing some population, we are interested
Analyzing the Geospatial Rates of the Primary Care Physician Labor Supply in the Contiguous United States
 Analyzing the Geospatial Rates of the Primary Care Physician Labor Supply in the Contiguous United States By Russ Frith Advisor: Dr. Raid Amin University of W. Florida Capstone Project in Statistics April,
Your web browser (Safari 7) is out of date. For more security, comfort and. the best experience on this site: Update your browser Ignore
 is out of date. For more security, comfort and. the best experience on this site: Update your browser Ignore") Your web browser (Safari 7) is out of date. For more security, comfort and Activityengage the best experience on this site: Update your browser Ignore Introduction to GIS What is a geographic information
Your web browser (Safari 7) is out of date. For more security, comfort and Activityengage the best experience on this site: Update your browser Ignore Introduction to GIS What is a geographic information
How GIS Can Help With Tribal Safety Planning
 How GIS Can Help With Tribal Safety Planning Thomas A. Horan, PhD Brian Hilton, PhD Arman Majidi, MAIS Center for Information Systems and Technology Claremont Graduate University Goals & Objectives This
NEW YORK DEPARTMENT OF SANITATION. Spatial Analysis of Complaints
 NEW YORK DEPARTMENT OF SANITATION Spatial Analysis of Complaints Spatial Information Design Lab Columbia University Graduate School of Architecture, Planning and Preservation November 2007 Title New York
Esri UC2013. Technical Workshop.
 Esri International User Conference San Diego, California Technical Workshops July 9, 2013 CAD: Introduction to using CAD Data in ArcGIS Jeff Reinhart & Phil Sanchez Agenda Overview of ArcGIS CAD Support
What is GIS and How Can It Help Me?
 esri European User Conference Madrid 2011 What is GIS and How Can It Help Me? Jaime Nieves Ignacio Vázquez esri spain «Knowing where things are, and why, is essential to rational decision making.» Jack
Among various open-source GIS programs, QGIS can be the best suitable option which can be used across partners for reasons outlined below.
 Comparison of Geographic Information Systems (GIS) software As of January 2018, WHO has reached an agreement with ESRI (an international supplier of GIS software) for an unlimited use of ArcGIS Desktop
Introducing spatial measurements and statistics
 1 Introducing spatial measurements and statistics Spatial measurements and statistics allow you to quantify patterns and relationships. That makes it easier to compare sets of features and to track changes
GIST 4302/5302: Spatial Analysis and Modeling Lecture 2: Review of Map Projections and Intro to Spatial Analysis
 GIST 4302/5302: Spatial Analysis and Modeling Lecture 2: Review of Map Projections and Intro to Spatial Analysis Guofeng Cao http://www.spatial.ttu.edu Department of Geosciences Texas Tech University guofeng.cao@ttu.edu
Mapping the most and the least
 Mapping the most and the least Why do you make a map To communicate information at a glance To explore the data to see what patterns and retionships you can find To develop hypothesis (will be topic of
Lesson Plan 2 - Middle and High School Land Use and Land Cover Introduction. Understanding Land Use and Land Cover using Google Earth
 Understanding Land Use and Land Cover using Google Earth Image an image is a representation of reality. It can be a sketch, a painting, a photograph, or some other graphic representation such as satellite