Everything is related to everything else, but near things are more related than distant things.
|
|
|
- Austin Hines
- 5 years ago
- Views:
Transcription
1 SPATIAL ANALYSIS
2 DR. TRIS ERYANDO, MA Everything is related to everything else, but near things are more related than distant things. (attributed to Tobler)
3 WHAT IS SPATIAL DATA? 4 main types event data, spatially continuous data, zonal data, spatial interaction data Most frequently used in social sciences is zonal data Data aggregated to a set of areal units (counties, MSAs, census blocks, ZIP codes, watersheds, etc.) Variables measured over the set of units Examples: Census, REIS, County and City Databook, etc.
4 THEORETICAL REASONS FOR SPATIAL ANALYSIS It tells us something more about what we re studying Is there an unmeasured process that affects the phenomenon? Does this process manifest itself in space? Examples: interaction processes, diffusion, historical or ethnic legacy, programmatic effects
5 EXAMPLES OF RESEARCH USING SPATIAL DATA ANALYSIS (SDA) Epidemiology (environmental exposure research) Criminology (crime patterns) Education (neighborhood effects on attainment) Diffusion/adoption (technologies) Social movements (trade unions, demonstrations) Market analysis (housing and land price variation) Spillover effects (economic spillovers of universities) Regional studies (regional income variation & inequality) Demography (segregation patterns) Political science (election studies)
6 WHEN DO YOU NEED TO DO SDA? Is there a theoretical reason to suspect differences across space? Differences in phenomena (variable values) Differences in relationships between phenomena (covariances) Are you using data with spatial referent? If yes to both, it is a good idea to at least explore any potential spatial effects Exploration will tell you more about the subject you re studying
7 GOALS OF SDA To identify spatial effects and their causes To appropriately measure spatial effects To incorporate spatial effects into models To improve our knowledge of the process and how it occurs over space All of these goals require both theory and methods
8 EXPLORATORY SPATIAL DATA ANALYSIS Start with questions about your theory and data: Are there likely to be spatial processes at work (diffusion, interaction, etc.)? Do your data units match the process? (Messner et al. reading) Visually and statistically explore your data Run basic descriptive statistics Map variables Look for patterns, outliers Look for spatial effects (large-scale variation, localized clusters)
9 FIRE OCCURRENCE PREDICTION MODEL UTILIZATION IN THE DKI JAKARTA PROVINCE- INDONESIA
10 BACKGROUND DKI Jakarta, Indonesia, is one of the most common areas of fire disaster. From January 2013 to April 2014, there were 921 fire cases occurred. With 175 billion dollars of material loss. This means that on average, 58 times a fire occurs every month or two fires a day. Fire preparedness activities require information related to the location of fire Objective: to prevent and estimate the risk of fire, with a statistical approach to predictive models of fire.
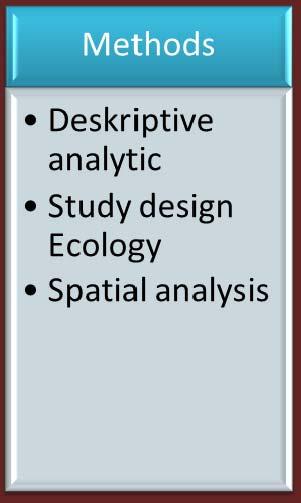
11 METHODS This study is an observational study of Exploratory Spatial Data Analysis (ESDA). The analysis used a spatial autocorrelation and Local Indicators of Spatial Association (LISA) The data used are secondary data results in 2012/2013 fire incident reports conducted by the Fire and Disaster Management in Jakarta)
12 RESULTS AND DISCUSSION

13 EXPLORATORY SPATIAL DATA ANALYSIS (ESDA) This section describes the results of the spatial analysis of the spread of fires in Jakarta and some of the factors that influence the spread of spatial data From Table, the spatial analysis of the spread of fires in Jakarta, showed Morannya index value = 0.12 (p<0.05), in the range 0 and 1, it can be concluded that resulting autocorrelation is positive spatial autocorrelation. Positive autocorrelation indicates the location or nearby villages have similar values and the incidence of fires in Jakarta tends to cluster.

14 the value of its Moran s Index shows all the variable has a value of positive spatial autocorrelation. Indicates positive autocorrelation nearby location have similar values, \the incidence of fires in Jakarta is tends to cluster. While the value of P-value fires at night is not significant. That is means that there is no difference in the form of the spread of fires at night.
 and the Low- Low (LL), which means it is likely to have a positive spatial")
15 LISA CLUSTER MAP the LISA cluster map shows that the relationship between the time of the fire incident. For some variables showed that most areas are not significant, only a few places that show the value of the High-High (HH) and the Low- Low (LL), which means it is likely to have a positive spatial autocorrelation value and the Regional high-high also shows areas that have a high observation value surrounded by regions with high observed values.
16 CONCLUSION. Fire in Jakarta most often occur at night, there is a dense residential area and is the main cause of the electrical installation problems. During this travel time to the fire location is quite short with an average of about 5 minutes after notification, yet handling over 30 minutes. The analysis of the spatial spread of fires in Jakarta, showed the value of the Moran index was 0.12 (p <0.05), and the incidence of fires in Jakarta tend to cluster
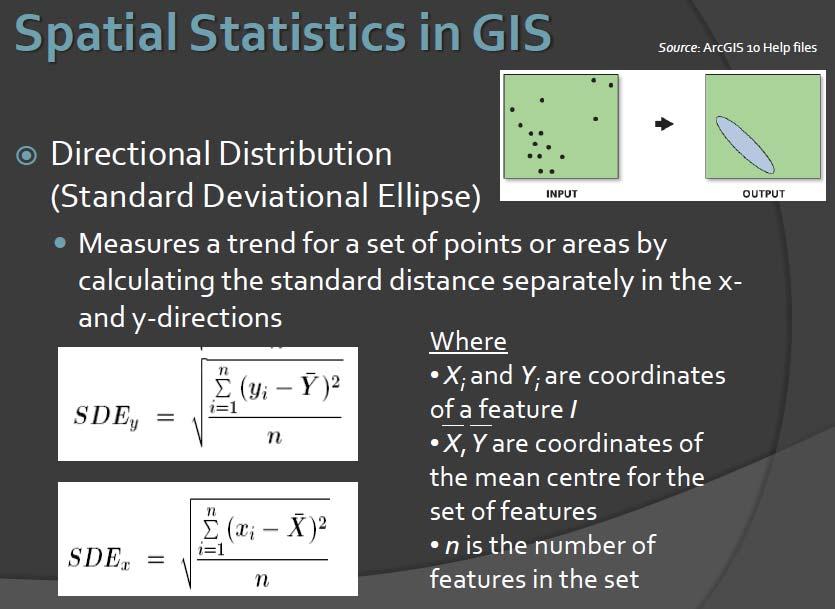
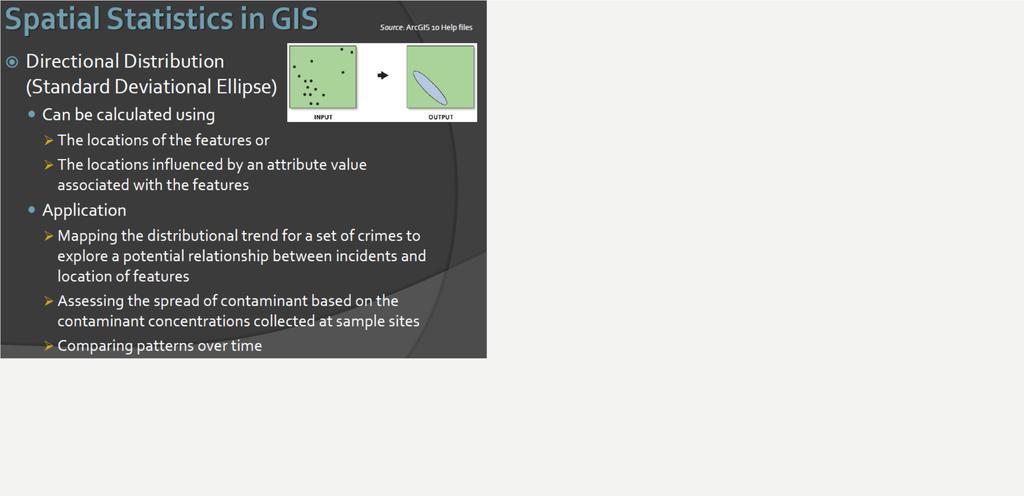
17 STANDARD DEVIATIONAL MODEL (SDE) FOR THE ANALYSIS OF DENGUE FEVER CASE IN BANJAR CITY, CIAMIS DISTRICT
18 BACKGROUND Dengue Fever Disease is still regarded as an endemic disease in Banjar City. Information is still required to map dengue fever case distribution, mean center of case distribution, and the direction of dengue fever case dispersion in order to support the surveillance program in the relation to the vast area of the dengue fever disease control program. The objective of the research is to obtain information regarding the area of dengue fever disease distribution in Banjar City by utilizing the Standard Deviational Ellipse (SDE)
19 METHOD The research is an observational study with Explanatory Spatial Data Analysis (ESDA). ESDA method of calculating the spatial aspects of using spatial analysis tools that Geographic Information Systems (GIS)* Data analysis uses SDE model with the scope of the entire sub district area in Banjar City. The data analyzed is dengue fever case from the period of , as many as 315 cases


20 SDE (Standard Deviation Ellipse) derived from a bivariate distribution. There are two interesting points about the distribution of point location in space of two dimensions: (1) centralization (central tendency) and (2) the spread (dispersion). Central tendency and dispersion is the mean center refers to the spread of the mean center of the ellipse bounded
21
22

23 RESULT AND DISCUSION In 2007 there were 14 cases of dengue incidence in Banjar, which spread over the northern part of Banjar. 14 cases are divided into two main groups are separated by a hills and rivers. The first group/kelompok (9 cases of DHF) is located further than the second group (5 cases of DHF).

24 In 2012 there were 44 cases of dengue incidence in Banjar, which are mostly in the central part of the west to the town of Banjar, and a small spread in the northern and eastern part of Banjar
25 CONCLUSION The SDE model can be used to discover dispersion patterns and directions of dengue fever cases, therefore dengue fever disease control program can be conducted based on local-specific information, in order to support health decision
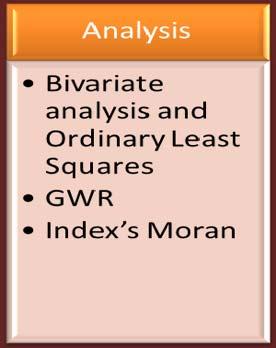
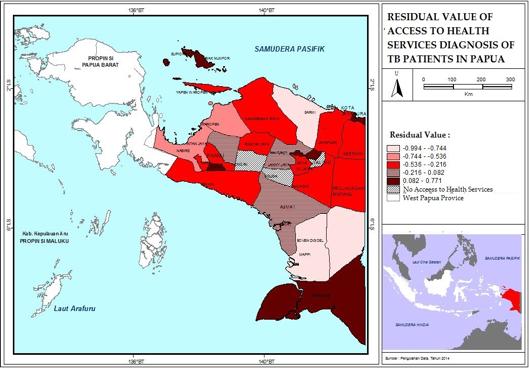
26 SPATIAL ACCESSIBILITY MODEL OF HEALTH CARE FOR TB PATIENTS IN WEST JAVA AND PAPUA PROVINCES, INDONESIA
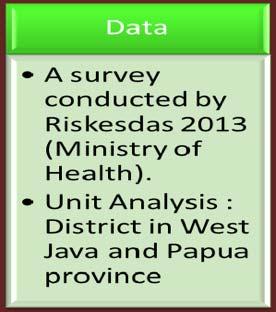
27 Tuberculosis is one of the major health problems in developing countries. According to analysis conducted by Riskesdas 2013, the two highest pulmonary tuberculosis are are West Java (0.7%) and Papua (0.6 %). The aim of this study is a model of spatial access to health cares diagnosis of Tuberculosis patients in West Java province and the province of Papua and determine the pattern of access to health cares for TB patients.
28
29 RESULTS
30
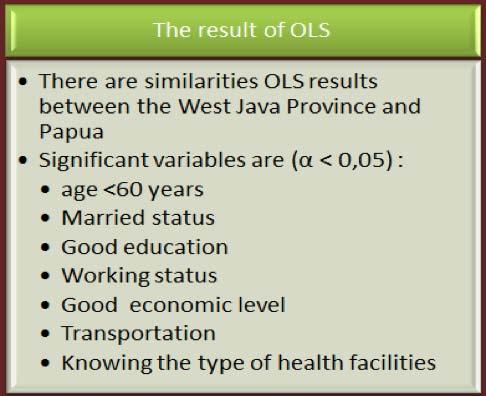
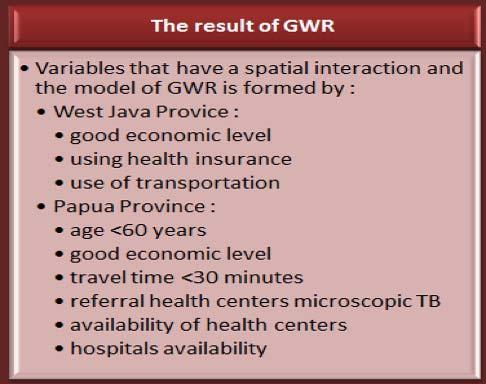
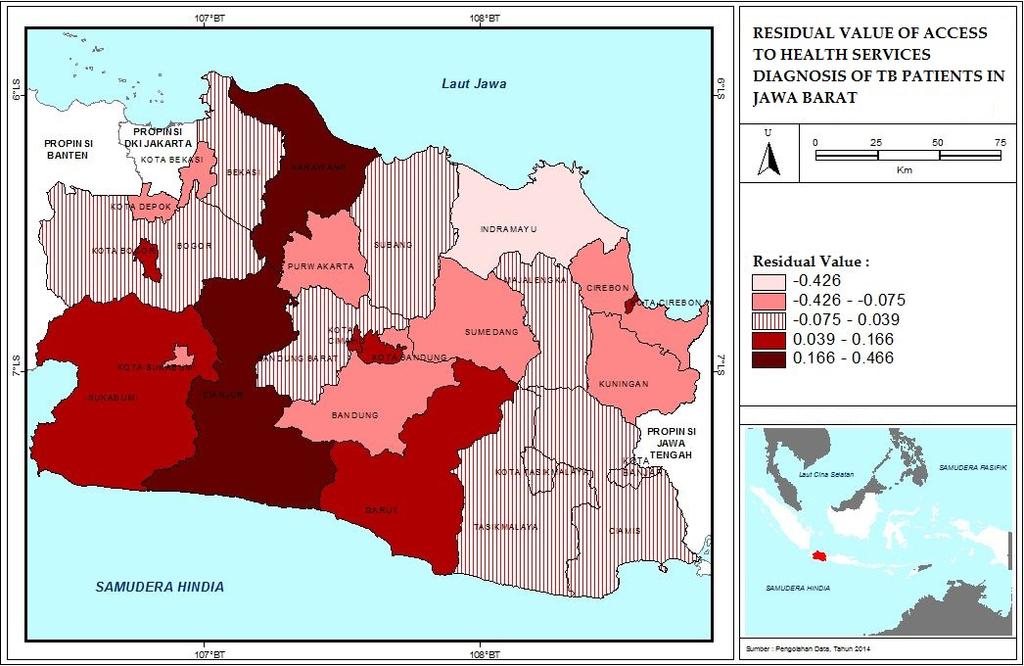
31 Based on the value of the index s Moran, access to health cares in the province of West Java showed a pattern that spreads and have the same characteristics at a nearby location. Meanwhile, in the province of Papua showing patterns clustered and there s no spatial interaction.
32 CONCLUSIONS Access to health care of patients the diagnosis is still very low, it is proved that the diagnosis of TB patients who do access health cares in the province of West Java, only 63.23%, while in Papua province is only 45.77%. There s a Differences in spatial model of access to health cares diagnosis of TB patient in the province of West Java and Papua. Access to health cares should be provided by the government so that people can easily get the health cares.

33 ACKNOWLEDGE THE HEAD OF RESEARCH AND DEVELOPMENT OF THE MINISTRY OF HEALTH, RESEARCH AND DEVELOPMENT LOKA CIAMIS, WEST JAVA. THE HEAD OF SECTION AND THE STAFFS WHO HAVE GIVEN THE SUPPORTING DATA TO CONDUCT THE RESEARCH. AND DRPM UI.
Spatial Analysis 1. Introduction
 Spatial Analysis 1 Introduction Geo-referenced Data (not any data) x, y coordinates (e.g., lat., long.) ------------------------------------------------------ - Table of Data: Obs. # x y Variables -------------------------------------
Luc Anselin Spatial Analysis Laboratory Dept. Agricultural and Consumer Economics University of Illinois, Urbana-Champaign
 GIS and Spatial Analysis Luc Anselin Spatial Analysis Laboratory Dept. Agricultural and Consumer Economics University of Illinois, Urbana-Champaign http://sal.agecon.uiuc.edu Outline GIS and Spatial Analysis
Urban GIS for Health Metrics
 Urban GIS for Health Metrics Dajun Dai Department of Geosciences, Georgia State University Atlanta, Georgia, United States Presented at International Conference on Urban Health, March 5 th, 2014 People,
SPACE Workshop NSF NCGIA CSISS UCGIS SDSU. Aldstadt, Getis, Jankowski, Rey, Weeks SDSU F. Goodchild, M. Goodchild, Janelle, Rebich UCSB
 SPACE Workshop NSF NCGIA CSISS UCGIS SDSU Aldstadt, Getis, Jankowski, Rey, Weeks SDSU F. Goodchild, M. Goodchild, Janelle, Rebich UCSB August 2-8, 2004 San Diego State University Some Examples of Spatial
Nature of Spatial Data. Outline. Spatial Is Special
 Nature of Spatial Data Outline Spatial is special Bad news: the pitfalls of spatial data Good news: the potentials of spatial data Spatial Is Special Are spatial data special? Why spatial data require
Temporal and spatial mapping of hand, foot and mouth disease in Sarawak, Malaysia
 Geospatial Health 8(2), 2014, pp. 503-507 Temporal and spatial mapping of hand, foot and mouth disease in Sarawak, Malaysia Noraishah M. Sham 1, Isthrinayagy Krishnarajah 1,2, Noor Akma Ibrahim 1,2, Munn-Sann
Types of spatial data. The Nature of Geographic Data. Types of spatial data. Spatial Autocorrelation. Continuous spatial data: geostatistics
 The Nature of Geographic Data Types of spatial data Continuous spatial data: geostatistics Samples may be taken at intervals, but the spatial process is continuous e.g. soil quality Discrete data Irregular:
In matrix algebra notation, a linear model is written as
 DM3 Calculation of health disparity Indices Using Data Mining and the SAS Bridge to ESRI Mussie Tesfamicael, University of Louisville, Louisville, KY Abstract Socioeconomic indices are strongly believed
Exploratory Spatial Data Analysis (ESDA)
") Exploratory Spatial Data Analysis (ESDA) VANGHR s method of ESDA follows a typical geospatial framework of selecting variables, exploring spatial patterns, and regression analysis. The primary software
Exploratory Spatial Data Analysis (ESDA) VANGHR s method of ESDA follows a typical geospatial framework of selecting variables, exploring spatial patterns, and regression analysis. The primary software
Spatial Pattern Analysis: Mapping Trends and Clusters
 Esri International User Conference San Diego, California Technical Workshops July 24, 2012 Spatial Pattern Analysis: Mapping Trends and Clusters Lauren M. Scott, PhD Lauren Rosenshein Bennett, MS Presentation
Michael Harrigan Office hours: Fridays 2:00-4:00pm Holden Hall
 Announcement New Teaching Assistant Michael Harrigan Office hours: Fridays 2:00-4:00pm Holden Hall 209 Email: michael.harrigan@ttu.edu Guofeng Cao, Texas Tech GIST4302/5302, Lecture 2: Review of Map Projection
Running head: GEOGRAPHICALLY WEIGHTED REGRESSION 1. Geographically Weighted Regression. Chelsey-Ann Cu GEOB 479 L2A. University of British Columbia
 Running head: GEOGRAPHICALLY WEIGHTED REGRESSION 1 Geographically Weighted Regression Chelsey-Ann Cu 32482135 GEOB 479 L2A University of British Columbia Dr. Brian Klinkenberg 9 February 2018 GEOGRAPHICALLY
Finding Hot Spots in ArcGIS Online: Minimizing the Subjectivity of Visual Analysis. Nicholas M. Giner Esri Parrish S.
 Finding Hot Spots in ArcGIS Online: Minimizing the Subjectivity of Visual Analysis Nicholas M. Giner Esri Parrish S. Henderson FBI Agenda The subjectivity of maps What is Hot Spot Analysis? Why do Hot
Guilty of committing ecological fallacy?
 GIS: Guilty of committing ecological fallacy? David W. Wong Professor Geography and GeoInformation Science George Mason University dwong2@gmu.edu Ecological Fallacy (EF) Many slightly different definitions
Spatial Pattern Analysis: Mapping Trends and Clusters. Lauren M. Scott, PhD Lauren Rosenshein Bennett, MS
 Spatial Pattern Analysis: Mapping Trends and Clusters Lauren M. Scott, PhD Lauren Rosenshein Bennett, MS Presentation Outline Spatial statistics overview Describing spatial patterns Quantifying spatial
KAAF- GE_Notes GIS APPLICATIONS LECTURE 3
 GIS APPLICATIONS LECTURE 3 SPATIAL AUTOCORRELATION. First law of geography: everything is related to everything else, but near things are more related than distant things Waldo Tobler Check who is sitting
Lecture 3: Exploratory Spatial Data Analysis (ESDA) Prof. Eduardo A. Haddad
 Prof. Eduardo A. Haddad") Lecture 3: Exploratory Spatial Data Analysis (ESDA) Prof. Eduardo A. Haddad Key message Spatial dependence First Law of Geography (Waldo Tobler): Everything is related to everything else, but near things
Lecture 3: Exploratory Spatial Data Analysis (ESDA) Prof. Eduardo A. Haddad Key message Spatial dependence First Law of Geography (Waldo Tobler): Everything is related to everything else, but near things
EXPLORATORY SPATIAL DATA ANALYSIS OF BUILDING ENERGY IN URBAN ENVIRONMENTS. Food Machinery and Equipment, Tianjin , China
 EXPLORATORY SPATIAL DATA ANALYSIS OF BUILDING ENERGY IN URBAN ENVIRONMENTS Wei Tian 1,2, Lai Wei 1,2, Pieter de Wilde 3, Song Yang 1,2, QingXin Meng 1 1 College of Mechanical Engineering, Tianjin University
Lecture 3: Exploratory Spatial Data Analysis (ESDA) Prof. Eduardo A. Haddad
 Prof. Eduardo A. Haddad") Lecture 3: Exploratory Spatial Data Analysis (ESDA) Prof. Eduardo A. Haddad Key message Spatial dependence First Law of Geography (Waldo Tobler): Everything is related to everything else, but near things
Lecture 3: Exploratory Spatial Data Analysis (ESDA) Prof. Eduardo A. Haddad Key message Spatial dependence First Law of Geography (Waldo Tobler): Everything is related to everything else, but near things
Spatial Data, Spatial Analysis and Spatial Data Science
 Spatial Data, Spatial Analysis and Spatial Data Science Luc Anselin http://spatial.uchicago.edu 1 spatial thinking in the social sciences spatial analysis spatial data science spatial data types and research
Finding Hot Spots in ArcGIS Online: Minimizing the Subjectivity of Visual Analysis. Nicholas M. Giner Esri Parrish S.
 Finding Hot Spots in ArcGIS Online: Minimizing the Subjectivity of Visual Analysis Nicholas M. Giner Esri Parrish S. Henderson - FBI Agenda The subjectivity of maps What is Hot Spot Analysis? What is Outlier
Using GIS to Brief New York City Public Officials after September 11
 Using GIS to Brief New York City Public Officials after September 11 Presented by Zvia Segal Naphtali, Ph.D. and Leonard M. Naphtali, Ph.D. Presented at the ESRI International Health GIS Conference, May
CRP 608 Winter 10 Class presentation February 04, Senior Research Associate Kirwan Institute for the Study of Race and Ethnicity
 CRP 608 Winter 10 Class presentation February 04, 2010 SAMIR GAMBHIR SAMIR GAMBHIR Senior Research Associate Kirwan Institute for the Study of Race and Ethnicity Background Kirwan Institute Our work Using
Introduction to Spatial Statistics and Modeling for Regional Analysis
 Introduction to Spatial Statistics and Modeling for Regional Analysis Dr. Xinyue Ye, Assistant Professor Center for Regional Development (Department of Commerce EDA University Center) & School of Earth,
World Geography. WG.1.1 Explain Earth s grid system and be able to locate places using degrees of latitude and longitude.
 Standard 1: The World in Spatial Terms Students will use maps, globes, atlases, and grid-referenced technologies, such as remote sensing, Geographic Information Systems (GIS), and Global Positioning Systems
GIS = Geographic Information Systems;
 What is GIS GIS = Geographic Information Systems; What Information are we talking about? Information about anything that has a place (e.g. locations of features, address of people) on Earth s surface,
Techniques for Science Teachers: Using GIS in Science Classrooms.
 Techniques for Science Teachers: Using GIS in Science Classrooms. After ESRI, 2008 GIS A Geographic Information System A collection of computer hardware, software, and geographic data used together for
Cluster Analysis using SaTScan
 Cluster Analysis using SaTScan Summary 1. Statistical methods for spatial epidemiology 2. Cluster Detection What is a cluster? Few issues 3. Spatial and spatio-temporal Scan Statistic Methods Probability
HAREWOOD JUNIOR SCHOOL KEY SKILLS
 HAREWOOD JUNIOR SCHOOL KEY SKILLS Geography Purpose of study A high-quality geography education should inspire in pupils a curiosity and fascination about the world and its people that will remain with
International Journal of Scientific & Engineering Research, Volume 4, Issue 9, September ISSN
 International Journal of Scientific & Engineering Research, Volume 4, Issue 9, September-2013 1001 Towards Guinea worm Eradication in Savelugu-Nanton District, Ghana: A Spatio-Temporal Approach. 1 Laari
Applying Health Outcome Data to Improve Health Equity
 Applying Health Outcome Data to Improve Health Equity Devon Williford, MPH, Health GIS Specialist Lorraine Dixon-Jones, Policy Analyst CDPHE Health Equity and Environmental Justice Collaborative Mile High
Links between socio-economic and ethnic segregation at different spatial scales: a comparison between The Netherlands and Belgium
 Links between socio-economic and ethnic segregation at different spatial scales: a comparison between The Netherlands and Belgium Bart Sleutjes₁ & Rafael Costa₂ ₁ Netherlands Interdisciplinary Demographic
Where Do Overweight Women In Ghana Live? Answers From Exploratory Spatial Data Analysis
 Where Do Overweight Women In Ghana Live? Answers From Exploratory Spatial Data Analysis Abstract Recent findings in the health literature indicate that health outcomes including low birth weight, obesity
GIST 4302/5302: Spatial Analysis and Modeling Lecture 2: Review of Map Projections and Intro to Spatial Analysis
 GIST 4302/5302: Spatial Analysis and Modeling Lecture 2: Review of Map Projections and Intro to Spatial Analysis Guofeng Cao http://www.spatial.ttu.edu Department of Geosciences Texas Tech University guofeng.cao@ttu.edu
Nature s Art Village
 Nature s Art Village Educational Field Trip Programs Guide To: College, Career & Civic Life C3 Framework For Social Studies State Standards Grades 3 through 5 All That Glitters Children journey back in
GIST 4302/5302: Spatial Analysis and Modeling
 GIST 4302/5302: Spatial Analysis and Modeling Lecture 2: Review of Map Projections and Intro to Spatial Analysis Guofeng Cao http://thestarlab.github.io Department of Geosciences Texas Tech University
Spatial segregation and socioeconomic inequalities in health in major Brazilian cities. An ESRC pathfinder project
 Spatial segregation and socioeconomic inequalities in health in major Brazilian cities An ESRC pathfinder project Income per head and life-expectancy: rich & poor countries Source: Wilkinson & Pickett,
GIS CONFERENCE MAKING PLACE MATTER Decoding Health Data with Spatial Statistics
 esri HEALTH AND HUMAN SERVICES GIS CONFERENCE MAKING PLACE MATTER Decoding Health Data with Spatial Statistics Flora Vale Jenora D Acosta Wait a minute Wait a minute Where is Lauren?? Wait a minute Where
SPATIAL HUMAN CAPITAL INTERACTION PATTERN TO INDONESIAN ECONOMIC GROWTH
 International Journal of Civil Engineering and Technology (IJCIET) Volume 9, Issue 1, January 2018, pp. 713 727, Article ID: IJCIET_09_01_069 Available online at http://www.iaeme.com/ijciet/issues.asp?jtype=ijciet&vtype=9&itype=1
1Department of Demography and Organization Studies, University of Texas at San Antonio, One UTSA Circle, San Antonio, TX
 Well, it depends on where you're born: A practical application of geographically weighted regression to the study of infant mortality in the U.S. P. Johnelle Sparks and Corey S. Sparks 1 Introduction Infant
Lecture 8. Spatial Estimation
 Lecture 8 Spatial Estimation Lecture Outline Spatial Estimation Spatial Interpolation Spatial Prediction Sampling Spatial Interpolation Methods Spatial Prediction Methods Interpolating Raster Surfaces
Course Introduction III
 GEOG 47 Cultural Geography Course Introduction III Prof. Anthony Grande Hunter College-CUNY Underlining Themes of Cultural Geography Every chapter and topic covered will make reference to one or more of
Notes On: Do Television and Radio Destroy Social Capital? Evidence from Indonesian Village (Olken 2009)
") Notes On: Do Television and Radio Destroy Social Capital? Evidence from Indonesian Village (Olken 2009) Increasing interest in phenomenon social capital variety of social interactions, networks, and groups
Notes On: Do Television and Radio Destroy Social Capital? Evidence from Indonesian Village (Olken 2009) Increasing interest in phenomenon social capital variety of social interactions, networks, and groups
Temporal and Spatial Autocorrelation Statistics of Dengue Fever
 Temporal and Spatial Autocorrelation Statistics of Dengue Fever Kanchana Nakhapakorn a and Supet Jirakajohnkool b a Faculty of Environment and Resource Studies, Mahidol University, Salaya, Nakhonpathom
THE 3D SIMULATION INFORMATION SYSTEM FOR ASSESSING THE FLOODING LOST IN KEELUNG RIVER BASIN
 THE 3D SIMULATION INFORMATION SYSTEM FOR ASSESSING THE FLOODING LOST IN KEELUNG RIVER BASIN Kuo-Chung Wen *, Tsung-Hsing Huang ** * Associate Professor, Chinese Culture University, Taipei **Master, Chinese
A Case Study of Regional Dynamics of China 中国区域动态案例研究
 A Case Study of Regional Dynamics of China 中国区域动态案例研究 Shuming Bao Spatial Data Center & China Data Center University of Michigan 1:00 PM - 2:00 PM, Tue, Feb 6, 2018 EST USA A Case Study of Regional Dynamics
The Effect of Mamuju Arterial Road (MAR) Development To Change In Land Use
 Development To Change In Land Use") American Journal of Engineering Research (AJER) e-issn: 2320-0847 p-issn : 2320-0936 Volume-7, Issue-2, pp-89-93 www.ajer.org Research Paper w w w. a j e r. o r g Open Access The Effect of Mamuju Arterial
American Journal of Engineering Research (AJER) e-issn: 2320-0847 p-issn : 2320-0936 Volume-7, Issue-2, pp-89-93 www.ajer.org Research Paper w w w. a j e r. o r g Open Access The Effect of Mamuju Arterial
HUMAN CAPITAL CATEGORY INTERACTION PATTERN TO ECONOMIC GROWTH OF ASEAN MEMBER COUNTRIES IN 2015 BY USING GEODA GEO-INFORMATION TECHNOLOGY DATA
 International Journal of Civil Engineering and Technology (IJCIET) Volume 8, Issue 11, November 2017, pp. 889 900, Article ID: IJCIET_08_11_089 Available online at http://http://www.iaeme.com/ijciet/issues.asp?jtype=ijciet&vtype=8&itype=11
GEOG 3340: Introduction to Human Geography Research
 GEOG 3340: Introduction to Human Geography Research Lecture 1: Course Overview Guofeng Cao www.myweb.ttu.edu/gucao Department of Geosciences Texas Tech University guofeng.cao@ttu.edu Fall 2015 Course Description
INDIANA ACADEMIC STANDARDS FOR SOCIAL STUDIES, WORLD GEOGRAPHY. PAGE(S) WHERE TAUGHT (If submission is not a book, cite appropriate location(s))
 WHERE TAUGHT (If submission is not a book, cite appropriate location(s))") Prentice Hall: The Cultural Landscape, An Introduction to Human Geography 2002 Indiana Academic Standards for Social Studies, World Geography (Grades 9-12) STANDARD 1: THE WORLD IN SPATIAL TERMS Students
Prentice Hall: The Cultural Landscape, An Introduction to Human Geography 2002 Indiana Academic Standards for Social Studies, World Geography (Grades 9-12) STANDARD 1: THE WORLD IN SPATIAL TERMS Students
A Framework for the Study of Urban Health. Abdullah Baqui, DrPH, MPH, MBBS Johns Hopkins University
 This work is licensed under a Creative Commons Attribution-NonCommercial-ShareAlike License. Your use of this material constitutes acceptance of that license and the conditions of use of materials on this
Climate and Health Vulnerability & Adaptation Assessment Profile Manaus - Brazil
 Climate and Health Vulnerability & Adaptation Assessment Profile Manaus - Brazil Christovam Barcellos (ICICT/Fiocruz) Diego Xavier Silva (ICICT/Fiocruz) Rita Bacuri (CPqLMD/Fiocruz) Assessment Objectives
Outline. Geographic Information Analysis & Spatial Data. Spatial Analysis is a Key Term. Lecture #1
 Geographic Information Analysis & Spatial Data Lecture #1 Outline Introduction Spatial Data Types: Objects vs. Fields Scale of Attribute Measures GIS and Spatial Analysis Spatial Analysis is a Key Term
Medical GIS: New Uses of Mapping Technology in Public Health. Peter Hayward, PhD Department of Geography SUNY College at Oneonta
 Medical GIS: New Uses of Mapping Technology in Public Health Peter Hayward, PhD Department of Geography SUNY College at Oneonta Invited research seminar presentation at Bassett Healthcare. Cooperstown,
Lecture 4. Spatial Statistics
 Lecture 4 Spatial Statistics Lecture 4 Outline Statistics in GIS Spatial Metrics Cell Statistics Neighborhood Functions Neighborhood and Zonal Statistics Mapping Density (Density surfaces) Hot Spot Analysis
Exploratory Spatial Data Analysis of Regional Economic Disparities in Beijing during the Preparation Period of the 2008 Olympic Games
 Exploratory Spatial Data Analysis of Regional Economic Disparities in Beijing during the Preparation Period of the 2008 Olympic Games Xiaoyi Ma, Tao Pei Thursday, May 27, 2010 The State Key Laboratory
A Micro-Spatial Analysis of Violent Crime
 A Micro-Spatial Analysis of Violent Crime The Experience of a Small Southern City Isaac T. Van Patten Radford University Levels of Measurement Macro-spatial analysis Crime at the state, regional, or national
Measuring community health outcomes: New approaches for public health services research
 Research Brief March 2015 Measuring community health outcomes: New approaches for public health services research P ublic Health agencies are increasingly asked to do more with less. Tough economic times
INTRODUCTION TO HUMAN GEOGRAPHY. Chapter 1
 INTRODUCTION TO HUMAN GEOGRAPHY Chapter 1 What Is Human Geography? The study of How people make places How we organize space and society How we interact with each other in places and across space How we
The Spatial Dimension of Urbanization in Indonesia
 The Spatial Dimension of Urbanization in Indonesia Andrea Civelli Univ. of Arkansas Arya Gaduh Univ. of Arkansas May 2015 VERY PRELIMINARY - PLEASE DO NOT CITE Abstract We use the newly-released World
Risk Identification using Hazus
 Risk Identification using Hazus City of Boston, Suffolk County, MA Dave Shortman, GISP, CFM 6/21/2016 Agenda Objective Project Location Hazus Overview Hazus Level 2 Risk Assessment Comparison and Reporting
GIS Spatial Statistics for Public Opinion Survey Response Rates
 GIS Spatial Statistics for Public Opinion Survey Response Rates July 22, 2015 Timothy Michalowski Senior Statistical GIS Analyst Abt SRBI - New York, NY t.michalowski@srbi.com www.srbi.com Introduction
Understanding Your Community A Guide to Data
 Understanding Your Community A Guide to Data Alex Lea September 2013 Research and Insight Team LeicestershireCounty Council Understanding Geographies Important to understand the various geographies that
Sample size and Sampling strategy
 Sample size and Sampling strategy Dr. Abdul Sattar Programme Officer, Assessment & Analysis Do you agree that Sample should be a certain proportion of population??? Formula for sample N = p 1 p Z2 C 2
Word Cards. 2 map. 1 geographic representation. a description or portrayal of the Earth or parts of the Earth. a visual representation of an area
 Name: Date: Hour: Word Cards 1 geographic representation a description or portrayal of the Earth or parts of the Earth Example: A map is a representation of an actual location or place. 2 map a visual
Chapter 2: Studying Geography, Economics, and Citizenship
 Chapter 2: Studying Geography, Economics, and Citizenship Lesson 2.1 Studying Geography I. Displaying the Earth s Surface A. A globe of the Earth best shows the sizes of continents and the shapes of landmasses
Spatial-Temporal Analytics with Students Data to recommend optimum regions to stay
 Spatial-Temporal Analytics with Students Data to recommend optimum regions to stay By ARUN KUMAR BALASUBRAMANIAN (A0163264H) DEVI VIJAYAKUMAR (A0163403R) RAGHU ADITYA (A0163260N) SHARVINA PAWASKAR (A0163302W)
CSISS Tools and Spatial Analysis Software
 CSISS Tools and Spatial Analysis Software June 5, 2006 Stephen A. Matthews Associate Professor of Sociology & Anthropology, Geography and Demography Director of the Geographic Information Analysis Core
Lecture 5 Geostatistics
 Lecture 5 Geostatistics Lecture Outline Spatial Estimation Spatial Interpolation Spatial Prediction Sampling Spatial Interpolation Methods Spatial Prediction Methods Interpolating Raster Surfaces with
The Case for Space in the Social Sciences
 The Case for Space in the Social Sciences Don Janelle Center for Spatially Integrated Social Science University of California, Santa Barbara Roundtable on Geographical Voices and Geographical Analysis
A Spatial Econometric Approach to Model the Growth of Tourism Flows to China Cities
 April 15, 2010 AAG 2010 Conference, Washington DC A Spatial Econometric Approach to Model the Growth of Tourism Flows to China Cities Yang Yang University of Florida Kevin. K.F. Wong The Hong Kong Polytechnic
An Introduction to the South Carolina Atlas
 An Introduction to the South Carolina Atlas Daniel E. Stone Pinewood Preparatory School dstone@pinewoodprep.com Overview This lesson is designed to serve as an introduction to the new South Carolina Atlas.
Alleghany County Schools Curriculum Guide GRADE/COURSE: World Geography
 GRADE/COURSE: World 2013-14 GRADING PERIOD: 1 st Six Weeks Time Frame Unit/SOLs SOL # Strand Resource Assessment 8 days* The student will use maps, globes, satellite images, photographs, or diagrams to
Welcome. C o n n e c t i n g
 Welcome C o n n e c t i n g YOU D i s c i p l i n e s Why is This Meeting......So Important Now? OUR WORLD Is Increasingly Challenged The Evidence Is Clear We Need Better Understanding and More Collaboration
Academic Standards for Geography
 Academic Standards for June 1, 2009 FINAL Elementary Standards Grades 3-8 Pennsylvania Department of Education These standards are offered as a voluntary resource for Pennsylvania s schools and await action
Frontier and Remote (FAR) Area Codes: A Preliminary View of Upcoming Changes John Cromartie Economic Research Service, USDA
 Area Codes: A Preliminary View of Upcoming Changes John Cromartie Economic Research Service, USDA") National Center for Frontier Communities webinar, January 27, 2015 Frontier and Remote (FAR) Area Codes: A Preliminary View of Upcoming Changes John Cromartie Economic Research Service, USDA The views
National Center for Frontier Communities webinar, January 27, 2015 Frontier and Remote (FAR) Area Codes: A Preliminary View of Upcoming Changes John Cromartie Economic Research Service, USDA The views
Applications of GIS in Health Research. West Nile virus
 Applications of GIS in Health Research West Nile virus Outline Part 1. Applications of GIS in Health research or spatial epidemiology Disease Mapping Cluster Detection Spatial Exposure Assessment Assessment
INTRODUCTION. In March 1998, the tender for project CT.98.EP.04 was awarded to the Department of Medicines Management, Keele University, UK.
 INTRODUCTION In many areas of Europe patterns of drug use are changing. The mechanisms of diffusion are diverse: introduction of new practices by new users, tourism and migration, cross-border contact,
GIS in Locating and Explaining Conflict Hotspots in Nepal
 GIS in Locating and Explaining Conflict Hotspots in Nepal Lila Kumar Khatiwada Notre Dame Initiative for Global Development 1 Outline Brief background Use of GIS in conflict study Data source Findings
GIS Test Drive What a Geographic Information System Is and What it Can Do. Alison Davis-Holland
 GIS Test Drive What a Geographic Information System Is and What it Can Do Alison Davis-Holland adavisholland@gmail.com WHO AM I? Geospatial Analyst M.S. in Geographic and Cartographic Sciences Use GIS
By Geri Flanary To accompany AP Human Geography: A Study Guide 3 rd edition By Ethel Wood
 Session 1 By Geri Flanary To accompany AP Human Geography: A Study Guide 3 rd edition By Ethel Wood WHAT IS DEMOGRAPHY? It is the scientific or statistical study of population. It comes from the Greek
BIG IDEAS. Area of Learning: SOCIAL STUDIES Urban Studies Grade 12. Learning Standards. Curricular Competencies
 Area of Learning: SOCIAL STUDIES Urban Studies Grade 12 BIG IDEAS Urbanization is a critical force that shapes both human life and the planet. The historical development of cities has been shaped by geographic,
GIS for ChEs Introduction to Geographic Information Systems
 GIS for ChEs Introduction to Geographic Information Systems AIChE Webinar John Cirucci 1 GIS for ChEs Introduction to Geographic Information Systems What is GIS? Tools and Methods Applications Examples
What is Human Geography? HUMAN GEOGRAPHY. Human Geography. Human Geography 5/18/2015. Example of Differences: Hurricane Katrina
 What is Human Geography? Geography is the science of place and space. Geographers ask: Where are things located? Why things are located where they are? How places differ from one another? How people interact
Outline. 15. Descriptive Summary, Design, and Inference. Descriptive summaries. Data mining. The centroid
 Outline 15. Descriptive Summary, Design, and Inference Geographic Information Systems and Science SECOND EDITION Paul A. Longley, Michael F. Goodchild, David J. Maguire, David W. Rhind 2005 John Wiley
SPATIAL ANALYSIS. Transformation. Cartogram Central. 14 & 15. Query, Measurement, Transformation, Descriptive Summary, Design, and Inference
 14 & 15. Query, Measurement, Transformation, Descriptive Summary, Design, and Inference Geographic Information Systems and Science SECOND EDITION Paul A. Longley, Michael F. Goodchild, David J. Maguire,
from
 8Map Generalization and Classification Our human and natural environments are complex and full of detail. Maps work by strategically reducing detail and grouping phenomena together. Driven by your intent,
Spatial Organization of Data and Data Extraction from Maptitude
 Spatial Organization of Data and Data Extraction from Maptitude N. P. Taliceo Geospatial Information Sciences The University of Texas at Dallas UT Dallas GIS Workshop Richardson, TX March 30 31, 2018 1/
Interactive GIS in Veterinary Epidemiology Technology & Application in a Veterinary Diagnostic Lab
 Interactive GIS in Veterinary Epidemiology Technology & Application in a Veterinary Diagnostic Lab Basics GIS = Geographic Information System A GIS integrates hardware, software and data for capturing,
Food Security Monitoring Bulletin. INDONESIA Special Focus: Estimating Impact of Disasters on Market Access
 Food Security Monitoring Bulletin INDONESIA Special Focus: Estimating Impact of Disasters on Market Access Volume 10, May 2018 CLIMATE AND FOOD SECURITY January - April 2018 More floods and landslides
Crime Analysis. GIS Solutions for Intelligence-Led Policing
 Crime Analysis GIS Solutions for Intelligence-Led Policing Applying GIS Technology to Crime Analysis Know Your Community Analyze Your Crime Use Your Advantage GIS aids crime analysis by Identifying and
This report details analyses and methodologies used to examine and visualize the spatial and nonspatial
 Analysis Summary: Acute Myocardial Infarction and Social Determinants of Health Acute Myocardial Infarction Study Summary March 2014 Project Summary :: Purpose This report details analyses and methodologies
What s special about spatial data?
 What s special about spatial data? Road map Geographic Information analysis The need to develop spatial thinking Some fundamental geographic concepts (PBCS) What are the effects of space? Spatial autocorrelation
Procedia - Social and Behavioral Sciences 227 ( 2016 ) 45 51
 45 51") Available online at www.sciencedirect.com ScienceDirect Procedia - Social and Behavioral Sciences 227 ( 2016 ) 45 51 CITIES 2015 International Conference, Intelligent Planning Towards Smart Cities, CITIES
Available online at www.sciencedirect.com ScienceDirect Procedia - Social and Behavioral Sciences 227 ( 2016 ) 45 51 CITIES 2015 International Conference, Intelligent Planning Towards Smart Cities, CITIES
International Court of Justice World Trade Organization Migration and its affects How & why people change the environment
 Social Issues Unit 2 Population Grade 9 Time for Completion: 12 class period State Standard: The student uses a working knowledge and understanding of the spatial organization of Earth s surface and relationships
Geographical Information System (GIS)-based maps for monitoring of entomological risk factors affecting transmission of chikungunya in Sri Lanka
-based maps for monitoring of entomological risk factors affecting transmission of chikungunya in Sri Lanka") Geographical Information System (GIS)-based maps for monitoring of entomological risk factors affecting transmission of chikungunya in Sri Lanka M.D. Hapugoda 1, N.K. Gunewardena 1, P.H.D. Kusumawathie
Geographical Information System (GIS)-based maps for monitoring of entomological risk factors affecting transmission of chikungunya in Sri Lanka M.D. Hapugoda 1, N.K. Gunewardena 1, P.H.D. Kusumawathie
Bishkek City Development Agency. Urban Planning Bishkek
 Bishkek City Development Agency Urban Planning Bishkek Bishkek City Development Agency Official name City budget Population Area GRP Import value Export value External trade turnover Foreign direct investments
Your web browser (Safari 7) is out of date. For more security, comfort and the best experience on this site: Update your browser Ignore
 is out of date. For more security, comfort and the best experience on this site: Update your browser Ignore") Your web browser (Safari 7) is out of date. For more security, comfort and the best experience on this site: Update your browser Ignore GIS ( GEO GRAPHIC INFO RMATIO N SYSTEM) geospatial information system
Your web browser (Safari 7) is out of date. For more security, comfort and the best experience on this site: Update your browser Ignore GIS ( GEO GRAPHIC INFO RMATIO N SYSTEM) geospatial information system
CHAPTER 3 POPULATION AND CULTURE SECTION 1: THE STUDY OF HUMAN GEOGRAPHY
 CHAPTER 3 POPULATION AND CULTURE SECTION 1: THE STUDY OF HUMAN GEOGRAPHY THE STUDY OF HUMAN GEOGRAPHY Human geography includes many topics Language Religion Customs Economics Political Systems One particular
Purpose Study conducted to determine the needs of the health care workforce related to GIS use, incorporation and training.
 GIS and Health Care: Educational Needs Assessment Cindy Gotz, MPH, CHES Janice Frates, Ph.D. Suzanne Wechsler, Ph.D. Departments of Health Care Administration & Geography California State University Long