Modeling Spatial Relationships Using Regression Analysis. Lauren M. Scott, PhD Lauren Rosenshein Bennett, MS
|
|
|
- Moris Stone
- 5 years ago
- Views:
Transcription


1 Modeling Spatial Relationships Using Regression Analysis Lauren M. Scott, PhD Lauren Rosenshein Bennett, MS

2 Workshop Overview Answering why? questions Introduce regression analysis - What it is and why you care - Example applications Work through solving a real problem using regression - Finding a properly specified OLS model - The 6 things you must check! - Exploring regional variation using GWR - What if? scenarios - Identifying opportunities for tailored remediation Modeling variations in per capita Medicare spending


 100 80 60 40 20 0 0")
3 What is Regression analysis? Model, examine, and explore spatial relationships Better understand the factors behind observed spatial patterns Predict outcomes based on that understanding Ordinary ry Least Square (OLS) Geographically ly Weighted ed Regression (GWR R) Observed Values Predicted Values
: - Are there places where people persistently die young?")

4 What s the big deal? Pattern analysis (without regression): - Are there places where people persistently die young? - Where are test scores consistently high? - Where are 911 emergency call hot spots? Regression analysis: - Why are people persistently dying young? - What factors contribute to consistently high test scores? - Which variables effectively predict 911 emergency call volumes?
: Variables you believe cause or explain the dependent variable (e.g., income, vandalism, number of households).")
5 Regression analysis terms and concepts Dependent variable (Y): What you are trying to model or predict (e.g., residential burglary). Explanatory variables (X): Variables you believe cause or explain the dependent variable (e.g., income, vandalism, number of households). Coefficients (β): Values, computed by the regression tool, reflecting the relationship between explanatory variables and the dependent variable. Residuals (ε): The portion of the dependent variable that isn t explained by the model; the model under- and over-predictions.

6 Regression model coefficients Coefficient sign (+/-) and magnitude reflect each explanatory variable s relationship to the dependent variable Intercept INCOME VANDALISM HOUSEHOLDS LOWER CITY The asterisk * indicates the explanatory variable is statistically significant
7 Why use regression? Explore correlations - Does higher Medicare spending translate to better health or to better quality health care? Predict unknown values - How many claims for heat related illnesses can we expect given current weather forecasts? Understand key factors - Why are people are dying young in South Dakota?


")
8 Explore Correlations Crime Analysis - Are you more likely to be robbed in a rich or poor neighborhood? - Do we see more crime in neighborhoods where there is more vandalism ( Broken Window theory) or less vandalism?


9 Predictive Modeling Property values - If we have data for recent home sales, can we predict home values? Demand for services - If we know the number of 911 calls is a function of population, education, and jobs, can we use population projections to predict future demand?
10 Understand Key Factors Natural Resource Management - What are the most important habitat characteristics for an endangered animal? Education - What are the key factors contributing to consistently high test scores? Public Health - What variables most effectively explain high rates of childhood obesity?


11 OLS Regression Lauren Rosenshein Bennett


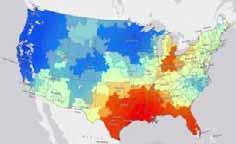
12 OLS analysis Why is Medicare Spending so High in the south? Are people just sicker there? e? The HCC index explained 66% of the variation in the per capita costs dependent variable: Adjusted R-Squared [2]: However, significant spatial autocorrelation among model residuals s indicates important explanatory variables are missing from the model.


 Use")
13 Build a multivariate regression model Explore variable relationships using the scatterplot matrix Consult theory and field experts Look for spatial variables Run OLS (this is iterative) Use Exploratory Regression
14 Our best OLS model Per capita Medicare costs as a function of: - Dehydration Admissions - Hospital Beds - Imaging Events - Evaluation and Management Costs - Distance to Houston This model tells 86% of the story and the over and under predictions aren t clustered! But are we done?

15 Check OLS results 1 Coefficients have the expected sign. 2 No redundancy among explanatory variables. 3 Coefficients are statistically significant. 4 Residuals are normally distributed. d. 5 Residuals are not spatially autocorrelated. 6 Strong Adjusted R-Square value.
16 1. Coefficient signs Coefficients should have the expected signs. Imaging Events per 1000 people + PQI10: Dehydration Admissions + Distance to Houston

17 2. Coefficient significance Look for statistically significant explanatory variables. Coefficients for all of the explanatory variables are statistically significant at the 0.05 level Since the Koenker test is statistically significant, we can only trust the robust coefficient probabilities
18 Check for variable redundancy Multicollinearity: - Term used to describe the phenomenon when two or more of the variables in your model are highly correlated. Variance inflation factor (VIF): - Detects the severity of multicollinearity. - Explanatory variables with a VIF greater than 7.5 should be removed one by one.
19 3. Multicollinearity Find a set of explanatory variables that have low VIF values. In a strong model, each explanatory variable gets at a different aspect of the dependent variable. As a rule of thumb, VIF values should be smaller than 7.5.


20 Checking for model bias The residuals of a good model should be normally distributed with a mean of zero The Jarque-Bera test checks model bias

21 4. Model bias When the Jarque-Bera test is statistically significant: - The model is biased - Results are not reliable - Sometimes this indicates a key variable is missing from the model

22 5. Model performance Compare models by looking for the lowest AIC value. - As long as the dependent variable remains fixed, the AIC value for different OLS/GWR models are comparable Look for a model with a high Adjusted R-Squared value.


23 6. Spatial Autocorrelation Statistically significant clustering of under and over predictions. Random spatial pattern ter of under and over predictions ns.


24 Online help is helpful! The 6 checks: Coefficients have the expected sign. Coefficients are statistically significant. No redundancy among explanatory variables. Residuals are normally distributed. Residuals are not spatially autocorrelated. Strong Adjusted R 2 (good model performance)

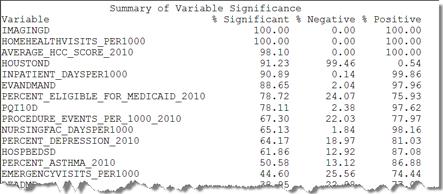
25 Also Helpful: Exploratory Regression
 will improve")
26 Are we done? A statistically significant Koenker OLS diagnostic is often evidence that Geographically Weighted Regresion (GWR) will improve model results GWR allows you to explore geographic variation which can help you tailor effective remediation efforts.

27 Global vs. local regression models OLS - Global regression model - One equation, calibrated using data from all features - Relationships are fixed GWR - Local regression model - One equation for every feature, calibrated using data from nearby features - Relationships are allowed to vary across the study area For each explanatory variable, able GWR creates a coefficient surface showing you where relationships are strongest st.


28 Exploring Regional Variation Lauren Rosenshein Bennett, MS


29 Running GWR GWR is a local spatial regression model Modeled relationships are allowed to vary GWR variables are the same as OLS, except: Do not include spatial regime (dummy) variables Do not include variables with little value variation
30 Defining local GWR constructs an equation for each feature Coefficients are estimated using nearby feature values GWR requires a definition for nearby
31 Defining local GWR requires a definition for nearby Kernel type Fixed: Nearby is determined by a fixed distance band Adaptive: Nearby is determined by a fixed number of neighbors Bandwidth method AIC or Cross Validation (CV): GWR will find the optimal distance or optimal number of neighbors Bandwidth parameter: Userprovided distance or userprovided number of neighbors
32 Interpreting GWR results Compare GWR R2 and AICc values to OLS R2 and AICc values - The better model has a lower AICc and a high R2. Model predictions, residuals, standard errors, coefficients, and condition numbers are written to the output feature class.
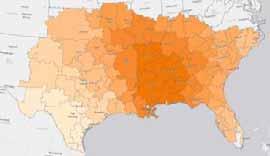
33 Mapped Output Residual maps show model under- and over-predictions. They shouldn t be clustered. Coefficient maps show how modeled relationships vary across the study area.


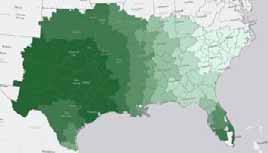
34 Mapped Output Maps of Local R 2 values show where the model is performing best To see variation in model stability: apply graduated color rendering to Condition Numbers

35 GWR prediction Calibrate the GWR model using known values for the dependent variable ab and all of the explanatory variables es. Observed Modeled Predicted Provide a feature class of prediction locations containing values for all of the explanatory variables. GWR will create an output feature class with the computed predictions ns.
36 Resources for learning more - Short videos - Articles and blogs - Online documentation - Supplementary model and script tools - Hot spot, Regression, and ModelBuilder tutorials resources.arcgis.com QUESTIONS? LBennett@Esri.com LScott@Esri.com
Modeling Spatial Relationships Using Regression Analysis
 Esri International User Conference San Diego, California Technical Workshops July 24, 2012 Modeling Spatial Relationships Using Regression Analysis Lauren M. Scott, PhD Lauren Rosenshein Bennett, MS Answering
Modeling Spatial Relationships using Regression Analysis
 Esri International User Conference San Diego, CA Technical Workshops July 2011 Modeling Spatial Relationships using Regression Analysis Lauren M. Scott, PhD Lauren Rosenshein, MS Mark V. Janikas, PhD Answering
Using Spatial Statistics Social Service Applications Public Safety and Public Health
 Using Spatial Statistics Social Service Applications Public Safety and Public Health Lauren Rosenshein 1 Regression analysis Regression analysis allows you to model, examine, and explore spatial relationships,
GIS Analysis: Spatial Statistics for Public Health: Lauren M. Scott, PhD; Mark V. Janikas, PhD
 Some Slides to Go Along with the Demo Hot spot analysis of average age of death Section B DEMO: Mortality Data Analysis 2 Some Slides to Go Along with the Demo Do Economic Factors Alone Explain Early Death?
A GEOSTATISTICAL APPROACH TO PREDICTING A PHYSICAL VARIABLE THROUGH A CONTINUOUS SURFACE
 Katherine E. Williams University of Denver GEOG3010 Geogrpahic Information Analysis April 28, 2011 A GEOSTATISTICAL APPROACH TO PREDICTING A PHYSICAL VARIABLE THROUGH A CONTINUOUS SURFACE Overview Data
Exploratory Spatial Data Analysis (ESDA)
") Exploratory Spatial Data Analysis (ESDA) VANGHR s method of ESDA follows a typical geospatial framework of selecting variables, exploring spatial patterns, and regression analysis. The primary software
Exploratory Spatial Data Analysis (ESDA) VANGHR s method of ESDA follows a typical geospatial framework of selecting variables, exploring spatial patterns, and regression analysis. The primary software
Spatial Pattern Analysis: Mapping Trends and Clusters
 Esri International User Conference San Diego, California Technical Workshops July 24, 2012 Spatial Pattern Analysis: Mapping Trends and Clusters Lauren M. Scott, PhD Lauren Rosenshein Bennett, MS Presentation
Spatial Pattern Analysis: Mapping Trends and Clusters. Lauren M. Scott, PhD Lauren Rosenshein Bennett, MS
 Spatial Pattern Analysis: Mapping Trends and Clusters Lauren M. Scott, PhD Lauren Rosenshein Bennett, MS Presentation Outline Spatial statistics overview Describing spatial patterns Quantifying spatial
Summary of OLS Results - Model Variables
 Summary of OLS Results - Model Variables Variable Coefficient [a] StdError t-statistic Probability [b] Robust_SE Robust_t Robust_Pr [b] VIF [c] Intercept 12.722048 1.710679 7.436839 0.000000* 2.159436
Spatial Pattern Analysis: Mapping Trends and Clusters
 2013 Esri International User Conference July 8 12, 2013 San Diego, California Technical Workshop Spatial Pattern Analysis: Mapping Trends and Clusters Lauren Rosenshein Bennett Brett Rose Presentation
Regression Analysis. A statistical procedure used to find relations among a set of variables.
 Regression Analysis A statistical procedure used to find relations among a set of variables. Understanding relations Mapping data enables us to examine (describe) where things occur (e.g., areas where
Objectives Define spatial statistics Introduce you to some of the core spatial statistics tools available in ArcGIS 9.3 Present a variety of example a
 Introduction to Spatial Statistics Opportunities for Education Lauren M. Scott, PhD Mark V. Janikas, PhD Lauren Rosenshein Jorge Ruiz-Valdepeña 1 Objectives Define spatial statistics Introduce you to some
LECTURE 10. Introduction to Econometrics. Multicollinearity & Heteroskedasticity
 LECTURE 10 Introduction to Econometrics Multicollinearity & Heteroskedasticity November 22, 2016 1 / 23 ON PREVIOUS LECTURES We discussed the specification of a regression equation Specification consists
This report details analyses and methodologies used to examine and visualize the spatial and nonspatial
 Analysis Summary: Acute Myocardial Infarction and Social Determinants of Health Acute Myocardial Infarction Study Summary March 2014 Project Summary :: Purpose This report details analyses and methodologies
GeoDa-GWR Results: GeoDa-GWR Output (portion only): Program began at 4/8/2016 4:40:38 PM
: Program began at 4/8/2016 4:40:38 PM") New Mexico Health Insurance Coverage, 2009-2013 Exploratory, Ordinary Least Squares, and Geographically Weighted Regression Using GeoDa-GWR, R, and QGIS Larry Spear 4/13/2016 (Draft) A dataset consisting
New Mexico Health Insurance Coverage, 2009-2013 Exploratory, Ordinary Least Squares, and Geographically Weighted Regression Using GeoDa-GWR, R, and QGIS Larry Spear 4/13/2016 (Draft) A dataset consisting
Models for Count and Binary Data. Poisson and Logistic GWR Models. 24/07/2008 GWR Workshop 1
 Models for Count and Binary Data Poisson and Logistic GWR Models 24/07/2008 GWR Workshop 1 Outline I: Modelling counts Poisson regression II: Modelling binary events Logistic Regression III: Poisson Regression
Statistics: A review. Why statistics?
 Statistics: A review Why statistics? What statistical concepts should we know? Why statistics? To summarize, to explore, to look for relations, to predict What kinds of data exist? Nominal, Ordinal, Interval
Regression Analysis of 911 call frequency in Portland, OR Urban Areas in Relation to Call Center Vicinity Elyse Maurer March 13, 2015
 Regression Analysis of 911 call frequency in Portland, OR Urban Areas in Relation to Call Center Vicinity Elyse Maurer March 13, 2015 Introduction: Using the Linear Regression and Geographically Weighted
ESRI 2008 Health GIS Conference
 ESRI 2008 Health GIS Conference An Exploration of Geographically Weighted Regression on Spatial Non- Stationarity and Principal Component Extraction of Determinative Information from Robust Datasets A
Gis Based Analysis of Supply and Forecasting Piped Water Demand in Nairobi
 International Journal of Engineering Science Invention ISSN (Online): 2319 6734, ISSN (Print): 2319 6726 Volume 4 Issue 2 February 2015 PP.01-11 Gis Based Analysis of Supply and Forecasting Piped Water
1. Regressions and Regression Models. 2. Model Example. EEP/IAS Introductory Applied Econometrics Fall Erin Kelley Section Handout 1
 1. Regressions and Regression Models Simply put, economists use regression models to study the relationship between two variables. If Y and X are two variables, representing some population, we are interested
Running head: GEOGRAPHICALLY WEIGHTED REGRESSION 1. Geographically Weighted Regression. Chelsey-Ann Cu GEOB 479 L2A. University of British Columbia
 Running head: GEOGRAPHICALLY WEIGHTED REGRESSION 1 Geographically Weighted Regression Chelsey-Ann Cu 32482135 GEOB 479 L2A University of British Columbia Dr. Brian Klinkenberg 9 February 2018 GEOGRAPHICALLY
The prediction of house price
 000 001 002 003 004 005 006 007 008 009 010 011 012 013 014 015 016 017 018 019 020 021 022 023 024 025 026 027 028 029 030 031 032 033 034 035 036 037 038 039 040 041 042 043 044 045 046 047 048 049 050
ECON 497 Midterm Spring
 ECON 497 Midterm Spring 2009 1 ECON 497: Economic Research and Forecasting Name: Spring 2009 Bellas Midterm You have three hours and twenty minutes to complete this exam. Answer all questions and explain
Introduction. Part I: Quick run through of ESDA checklist on our data
 CSDE GIS Workshop Series Spatial Regression Chris Fowler csfowler@uw.edu Introduction The goal of these exercises is to give you a chance to put the concepts we have just discussed into practice. Keep
PhD/MA Econometrics Examination. January, 2015 PART A. (Answer any TWO from Part A)
") PhD/MA Econometrics Examination January, 2015 Total Time: 8 hours MA students are required to answer from A and B. PhD students are required to answer from A, B, and C. PART A (Answer any TWO from Part
PhD/MA Econometrics Examination January, 2015 Total Time: 8 hours MA students are required to answer from A and B. PhD students are required to answer from A, B, and C. PART A (Answer any TWO from Part
The Simple Linear Regression Model
 The Simple Linear Regression Model Lesson 3 Ryan Safner 1 1 Department of Economics Hood College ECON 480 - Econometrics Fall 2017 Ryan Safner (Hood College) ECON 480 - Lesson 3 Fall 2017 1 / 77 Bivariate
Regression Analysis. BUS 735: Business Decision Making and Research. Learn how to detect relationships between ordinal and categorical variables.
 Regression Analysis BUS 735: Business Decision Making and Research 1 Goals of this section Specific goals Learn how to detect relationships between ordinal and categorical variables. Learn how to estimate
CRP 272 Introduction To Regression Analysis
 CRP 272 Introduction To Regression Analysis 30 Relationships Among Two Variables: Interpretations One variable is used to explain another variable X Variable Independent Variable Explaining Variable Exogenous
Evaluating sustainable transportation offers through housing price: a comparative analysis of Nantes urban and periurban/rural areas (France)
") Evaluating sustainable transportation offers through housing price: a comparative analysis of Nantes urban and periurban/rural areas (France) Julie Bulteau, UVSQ-CEARC-OVSQ Thierry Feuillet, Université
Evaluating sustainable transportation offers through housing price: a comparative analysis of Nantes urban and periurban/rural areas (France) Julie Bulteau, UVSQ-CEARC-OVSQ Thierry Feuillet, Université
Lecture 4. Spatial Statistics
 Lecture 4 Spatial Statistics Lecture 4 Outline Statistics in GIS Spatial Metrics Cell Statistics Neighborhood Functions Neighborhood and Zonal Statistics Mapping Density (Density surfaces) Hot Spot Analysis
In matrix algebra notation, a linear model is written as
 DM3 Calculation of health disparity Indices Using Data Mining and the SAS Bridge to ESRI Mussie Tesfamicael, University of Louisville, Louisville, KY Abstract Socioeconomic indices are strongly believed
Spatial Variation in Infant Mortality with Geographically Weighted Poisson Regression (GWPR) Approach
 Approach") Spatial Variation in Infant Mortality with Geographically Weighted Poisson Regression (GWPR) Approach Kristina Pestaria Sinaga, Manuntun Hutahaean 2, Petrus Gea 3 1, 2, 3 University of Sumatera Utara,
Spatial Variation in Infant Mortality with Geographically Weighted Poisson Regression (GWPR) Approach Kristina Pestaria Sinaga, Manuntun Hutahaean 2, Petrus Gea 3 1, 2, 3 University of Sumatera Utara,
Dr Arulsivanathan Naidoo Statistics South Africa 18 October 2017
 ESRI User Conference 2017 Space Time Pattern Mining Analysis of Matric Pass Rates in Cape Town Schools Dr Arulsivanathan Naidoo Statistics South Africa 18 October 2017 Choose one of the following Leadership
ACE 564 Spring Lecture 8. Violations of Basic Assumptions I: Multicollinearity and Non-Sample Information. by Professor Scott H.
 ACE 564 Spring 2006 Lecture 8 Violations of Basic Assumptions I: Multicollinearity and Non-Sample Information by Professor Scott H. Irwin Readings: Griffiths, Hill and Judge. "Collinear Economic Variables,
Using Spatial Statistics and Geostatistical Analyst as Educational Tools
 Using Spatial Statistics and Geostatistical Analyst as Educational Tools By Konrad Dramowicz Centre of Geographic Sciences Lawrencetown, Nova Scotia, Canada ESRI User Conference, San Diego, California
Unless provided with information to the contrary, assume for each question below that the Classical Linear Model assumptions hold.
 Economics 345: Applied Econometrics Section A01 University of Victoria Midterm Examination #2 Version 1 SOLUTIONS Spring 2015 Instructor: Martin Farnham Unless provided with information to the contrary,
Steps in Regression Analysis
 MGMG 522 : Session #2 Learning to Use Regression Analysis & The Classical Model (Ch. 3 & 4) 2-1 Steps in Regression Analysis 1. Review the literature and develop the theoretical model 2. Specify the model:
GeoDa and Spatial Regression Modeling
 GeoDa and Spatial Regression Modeling June 9, 2006 Stephen A. Matthews Associate Professor of Sociology & Anthropology, Geography and Demography Director of the Geographic Information Analysis Core Population
Modeling the Ecology of Urban Inequality in Space and Time
 Modeling the Ecology of Urban Inequality in Space and Time Corina Graif PhD Candidate, Department Of Sociology Harvard University Presentation for the Workshop on Spatial and Temporal Modeling, Center
ECNS 561 Multiple Regression Analysis
 ECNS 561 Multiple Regression Analysis Model with Two Independent Variables Consider the following model Crime i = β 0 + β 1 Educ i + β 2 [what else would we like to control for?] + ε i Here, we are taking
Practice exam questions
 Practice exam questions Nathaniel Higgins nhiggins@jhu.edu, nhiggins@ers.usda.gov 1. The following question is based on the model y = β 0 + β 1 x 1 + β 2 x 2 + β 3 x 3 + u. Discuss the following two hypotheses.
PBAF 528 Week 8. B. Regression Residuals These properties have implications for the residuals of the regression.
 PBAF 528 Week 8 What are some problems with our model? Regression models are used to represent relationships between a dependent variable and one or more predictors. In order to make inference from the
Spatial Data Mining. Regression and Classification Techniques
 Spatial Data Mining Regression and Classification Techniques 1 Spatial Regression and Classisfication Discrete class labels (left) vs. continues quantities (right) measured at locations (2D for geographic
A geographically weighted regression
 The Spatial Distribution of Poverty A geographically weighted regression by Introduction Problem How can we explore the spatial distribution of poverty and determine its correlates? This exercise examines
APPLICATION OF GEOGRAPHICALLY WEIGHTED REGRESSION ANALYSIS TO LAKE-SEDIMENT DATA FROM AN AREA OF THE CANADIAN SHIELD IN SASKATCHEWAN AND ALBERTA
 APPLICATION OF GEOGRAPHICALLY WEIGHTED REGRESSION ANALYSIS TO LAKE-SEDIMENT DATA FROM AN AREA OF THE CANADIAN SHIELD IN SASKATCHEWAN AND ALBERTA Nadia Yavorskaya 1, Stephen Amor 2 1 450 Bonner Av., Winnipeg,
ECON 497: Lecture Notes 10 Page 1 of 1
 ECON 497: Lecture Notes 10 Page 1 of 1 Metropolitan State University ECON 497: Research and Forecasting Lecture Notes 10 Heteroskedasticity Studenmund Chapter 10 We'll start with a quote from Studenmund:
Introduction to Econometrics
 Introduction to Econometrics T H I R D E D I T I O N Global Edition James H. Stock Harvard University Mark W. Watson Princeton University Boston Columbus Indianapolis New York San Francisco Upper Saddle
ECON 497: Lecture 4 Page 1 of 1
 ECON 497: Lecture 4 Page 1 of 1 Metropolitan State University ECON 497: Research and Forecasting Lecture Notes 4 The Classical Model: Assumptions and Violations Studenmund Chapter 4 Ordinary least squares
Modeling the Spatial Effects on Demand Estimation of Americans with Disabilities Act Paratransit Services
 Modeling the Spatial Effects on Demand Estimation of Americans with Disabilities Act Paratransit Services Pei-Fen Kuo, Chung-Wei Shen, and Luca Quadrifoglio A reliable method for predicting paratransit
Simple Regression Model (Assumptions)
") Simple Regression Model (Assumptions) Lecture 18 Reading: Sections 18.1, 18., Logarithms in Regression Analysis with Asiaphoria, 19.6 19.8 (Optional: Normal probability plot pp. 607-8) 1 Height son, inches
Simple Regression Model (Assumptions) Lecture 18 Reading: Sections 18.1, 18., Logarithms in Regression Analysis with Asiaphoria, 19.6 19.8 (Optional: Normal probability plot pp. 607-8) 1 Height son, inches
Multilevel modeling and panel data analysis in educational research (Case study: National examination data senior high school in West Java)
") Multilevel modeling and panel data analysis in educational research (Case study: National examination data senior high school in West Java) Pepi Zulvia, Anang Kurnia, and Agus M. Soleh Citation: AIP Conference
Multilevel modeling and panel data analysis in educational research (Case study: National examination data senior high school in West Java) Pepi Zulvia, Anang Kurnia, and Agus M. Soleh Citation: AIP Conference
Regression Analysis. BUS 735: Business Decision Making and Research
 Regression Analysis BUS 735: Business Decision Making and Research 1 Goals and Agenda Goals of this section Specific goals Learn how to detect relationships between ordinal and categorical variables. Learn
Regression of Inflation on Percent M3 Change
 ECON 497 Final Exam Page of ECON 497: Economic Research and Forecasting Name: Spring 2006 Bellas Final Exam Return this exam to me by midnight on Thursday, April 27. It may be e-mailed to me. It may be
14.32 Final : Spring 2001
 14.32 Final : Spring 2001 Please read the entire exam before you begin. You have 3 hours. No books or notes should be used. Calculators are allowed. There are 105 points. Good luck! A. True/False/Sometimes
Introduction to statistical modeling
 Introduction to statistical modeling Illustrated with XLSTAT Jean Paul Maalouf webinar@xlstat.com linkedin.com/in/jean-paul-maalouf November 30, 2016 www.xlstat.com 1 PLAN XLSTAT: who are we? Statistics:
INTRODUCTION TO MULTILEVEL MODELLING FOR REPEATED MEASURES DATA. Belfast 9 th June to 10 th June, 2011
 INTRODUCTION TO MULTILEVEL MODELLING FOR REPEATED MEASURES DATA Belfast 9 th June to 10 th June, 2011 Dr James J Brown Southampton Statistical Sciences Research Institute (UoS) ADMIN Research Centre (IoE
Iris Wang.
 Chapter 10: Multicollinearity Iris Wang iris.wang@kau.se Econometric problems Multicollinearity What does it mean? A high degree of correlation amongst the explanatory variables What are its consequences?
The multiple regression model; Indicator variables as regressors
 The multiple regression model; Indicator variables as regressors Ragnar Nymoen University of Oslo 28 February 2013 1 / 21 This lecture (#12): Based on the econometric model specification from Lecture 9
Nature of Spatial Data. Outline. Spatial Is Special
 Nature of Spatial Data Outline Spatial is special Bad news: the pitfalls of spatial data Good news: the potentials of spatial data Spatial Is Special Are spatial data special? Why spatial data require
Heteroscedasticity 1
 Heteroscedasticity 1 Pierre Nguimkeu BUEC 333 Summer 2011 1 Based on P. Lavergne, Lectures notes Outline Pure Versus Impure Heteroscedasticity Consequences and Detection Remedies Pure Heteroscedasticity
Multicollinearity occurs when two or more predictors in the model are correlated and provide redundant information about the response.
 Multicollinearity Read Section 7.5 in textbook. Multicollinearity occurs when two or more predictors in the model are correlated and provide redundant information about the response. Example of multicollinear
CHAPTER 6: SPECIFICATION VARIABLES
 Recall, we had the following six assumptions required for the Gauss-Markov Theorem: 1. The regression model is linear, correctly specified, and has an additive error term. 2. The error term has a zero
Transit Service Gap Technical Documentation
 Transit Service Gap Technical Documentation Introduction This document is an accompaniment to the AllTransit TM transit gap methods document. It is a detailed explanation of the process used to develop
Lecture 4: Multivariate Regression, Part 2
 Lecture 4: Multivariate Regression, Part 2 Gauss-Markov Assumptions 1) Linear in Parameters: Y X X X i 0 1 1 2 2 k k 2) Random Sampling: we have a random sample from the population that follows the above
Eco 391, J. Sandford, spring 2013 April 5, Midterm 3 4/5/2013
 Midterm 3 4/5/2013 Instructions: You may use a calculator, and one sheet of notes. You will never be penalized for showing work, but if what is asked for can be computed directly, points awarded will depend
Business Statistics. Lecture 9: Simple Regression
 Business Statistics Lecture 9: Simple Regression 1 On to Model Building! Up to now, class was about descriptive and inferential statistics Numerical and graphical summaries of data Confidence intervals
Classification & Regression. Multicollinearity Intro to Nominal Data
 Multicollinearity Intro to Nominal Let s Start With A Question y = β 0 + β 1 x 1 +β 2 x 2 y = Anxiety Level x 1 = heart rate x 2 = recorded pulse Since we can all agree heart rate and pulse are related,
Ch 7: Dummy (binary, indicator) variables
 variables") Ch 7: Dummy (binary, indicator) variables :Examples Dummy variable are used to indicate the presence or absence of a characteristic. For example, define female i 1 if obs i is female 0 otherwise or male
Ch 7: Dummy (binary, indicator) variables :Examples Dummy variable are used to indicate the presence or absence of a characteristic. For example, define female i 1 if obs i is female 0 otherwise or male
Correlation and Regression Bangkok, 14-18, Sept. 2015
 Analysing and Understanding Learning Assessment for Evidence-based Policy Making Correlation and Regression Bangkok, 14-18, Sept. 2015 Australian Council for Educational Research Correlation The strength
Wooldridge, Introductory Econometrics, 3d ed. Chapter 9: More on specification and data problems
 Wooldridge, Introductory Econometrics, 3d ed. Chapter 9: More on specification and data problems Functional form misspecification We may have a model that is correctly specified, in terms of including
LECTURE 11. Introduction to Econometrics. Autocorrelation
 LECTURE 11 Introduction to Econometrics Autocorrelation November 29, 2016 1 / 24 ON PREVIOUS LECTURES We discussed the specification of a regression equation Specification consists of choosing: 1. correct
Review: Second Half of Course Stat 704: Data Analysis I, Fall 2014
 Review: Second Half of Course Stat 704: Data Analysis I, Fall 2014 Tim Hanson, Ph.D. University of South Carolina T. Hanson (USC) Stat 704: Data Analysis I, Fall 2014 1 / 13 Chapter 8: Polynomials & Interactions
Measuring community health outcomes: New approaches for public health services research
 Research Brief March 2015 Measuring community health outcomes: New approaches for public health services research P ublic Health agencies are increasingly asked to do more with less. Tough economic times
The flu example from last class is actually one of our most common transformations called the log-linear model:
 The Log-Linear Model The flu example from last class is actually one of our most common transformations called the log-linear model: ln Y = β 1 + β 2 X + ε We can use ordinary least squares to estimate
Day 4: Shrinkage Estimators
 Day 4: Shrinkage Estimators Kenneth Benoit Data Mining and Statistical Learning March 9, 2015 n versus p (aka k) Classical regression framework: n > p. Without this inequality, the OLS coefficients have
Ordinary Least Squares Regression Explained: Vartanian
 Ordinary Least Squares Regression Explained: Vartanian When to Use Ordinary Least Squares Regression Analysis A. Variable types. When you have an interval/ratio scale dependent variable.. When your independent
STANDARDS OF LEARNING CONTENT REVIEW NOTES. ALGEBRA I Part II 1 st Nine Weeks,
 STANDARDS OF LEARNING CONTENT REVIEW NOTES ALGEBRA I Part II 1 st Nine Weeks, 2016-2017 OVERVIEW Algebra I Content Review Notes are designed by the High School Mathematics Steering Committee as a resource
Sociology 593 Exam 1 February 17, 1995
 Sociology 593 Exam 1 February 17, 1995 I. True-False. (25 points) Indicate whether the following statements are true or false. If false, briefly explain why. 1. A researcher regressed Y on. When he plotted
Shaping Your Neighbourhood
 Shaping Your Neighbourhood Building a Core Sustainable Neighbourhood Action Plan Nov. 25 & 26, 2006 Welcome! Peter Russell Planner, Holland Barrs Planning Group Inc. Role in this project: Work with the
CRP 608 Winter 10 Class presentation February 04, Senior Research Associate Kirwan Institute for the Study of Race and Ethnicity
 CRP 608 Winter 10 Class presentation February 04, 2010 SAMIR GAMBHIR SAMIR GAMBHIR Senior Research Associate Kirwan Institute for the Study of Race and Ethnicity Background Kirwan Institute Our work Using
Chapter 3 Multiple Regression Complete Example
 Department of Quantitative Methods & Information Systems ECON 504 Chapter 3 Multiple Regression Complete Example Spring 2013 Dr. Mohammad Zainal Review Goals After completing this lecture, you should be
Lecture 4: Multivariate Regression, Part 2
 Lecture 4: Multivariate Regression, Part 2 Gauss-Markov Assumptions 1) Linear in Parameters: Y X X X i 0 1 1 2 2 k k 2) Random Sampling: we have a random sample from the population that follows the above
Regression Analysis and Forecasting Prof. Shalabh Department of Mathematics and Statistics Indian Institute of Technology-Kanpur
 Regression Analysis and Forecasting Prof. Shalabh Department of Mathematics and Statistics Indian Institute of Technology-Kanpur Lecture 10 Software Implementation in Simple Linear Regression Model using
REED TUTORIALS (Pty) LTD ECS3706 EXAM PACK
 LTD ECS3706 EXAM PACK") REED TUTORIALS (Pty) LTD ECS3706 EXAM PACK 1 ECONOMETRICS STUDY PACK MAY/JUNE 2016 Question 1 (a) (i) Describing economic reality (ii) Testing hypothesis about economic theory (iii) Forecasting future
REED TUTORIALS (Pty) LTD ECS3706 EXAM PACK 1 ECONOMETRICS STUDY PACK MAY/JUNE 2016 Question 1 (a) (i) Describing economic reality (ii) Testing hypothesis about economic theory (iii) Forecasting future
Dr. Maddah ENMG 617 EM Statistics 11/28/12. Multiple Regression (3) (Chapter 15, Hines)
 (Chapter 15, Hines)") Dr. Maddah ENMG 617 EM Statistics 11/28/12 Multiple Regression (3) (Chapter 15, Hines) Problems in multiple regression: Multicollinearity This arises when the independent variables x 1, x 2,, x k, are
Dr. Maddah ENMG 617 EM Statistics 11/28/12 Multiple Regression (3) (Chapter 15, Hines) Problems in multiple regression: Multicollinearity This arises when the independent variables x 1, x 2,, x k, are
Mapping For Wellness: Then and Now
 Mapping For Wellness: Then and Now John Ritter, Ph.D. Geomatics Dept. Oregon Institute of Technology Klamath Falls, OR 97601 John.Ritter@oit.edu Sponsors 1 Objectives Understand how medical mapping can
Multiple Regression Methods
 Chapter 1: Multiple Regression Methods Hildebrand, Ott and Gray Basic Statistical Ideas for Managers Second Edition 1 Learning Objectives for Ch. 1 The Multiple Linear Regression Model How to interpret
Causal Inference with Big Data Sets
 Causal Inference with Big Data Sets Marcelo Coca Perraillon University of Colorado AMC November 2016 1 / 1 Outlone Outline Big data Causal inference in economics and statistics Regression discontinuity
Stat 500 Midterm 2 12 November 2009 page 0 of 11
 Stat 500 Midterm 2 12 November 2009 page 0 of 11 Please put your name on the back of your answer book. Do NOT put it on the front. Thanks. Do not start until I tell you to. The exam is closed book, closed
Variance component models part I
 Faculty of Health Sciences Variance component models part I Analysis of repeated measurements, 30th November 2012 Julie Lyng Forman & Lene Theil Skovgaard Department of Biostatistics, University of Copenhagen
Activity #12: More regression topics: LOWESS; polynomial, nonlinear, robust, quantile; ANOVA as regression
 Activity #12: More regression topics: LOWESS; polynomial, nonlinear, robust, quantile; ANOVA as regression Scenario: 31 counts (over a 30-second period) were recorded from a Geiger counter at a nuclear
Regression I: Mean Squared Error and Measuring Quality of Fit
 Regression I: Mean Squared Error and Measuring Quality of Fit -Applied Multivariate Analysis- Lecturer: Darren Homrighausen, PhD 1 The Setup Suppose there is a scientific problem we are interested in solving
Concepts and Applications of Kriging. Eric Krause
 Concepts and Applications of Kriging Eric Krause Sessions of note Tuesday ArcGIS Geostatistical Analyst - An Introduction 8:30-9:45 Room 14 A Concepts and Applications of Kriging 10:15-11:30 Room 15 A
multilevel modeling: concepts, applications and interpretations
 multilevel modeling: concepts, applications and interpretations lynne c. messer 27 october 2010 warning social and reproductive / perinatal epidemiologist concepts why context matters multilevel models
An overview of applied econometrics
 An overview of applied econometrics Jo Thori Lind September 4, 2011 1 Introduction This note is intended as a brief overview of what is necessary to read and understand journal articles with empirical
y response variable x 1, x 2,, x k -- a set of explanatory variables
 11. Multiple Regression and Correlation y response variable x 1, x 2,, x k -- a set of explanatory variables In this chapter, all variables are assumed to be quantitative. Chapters 12-14 show how to incorporate
A Second Course in Statistics: Regression Analysis
 FIFTH E D I T I 0 N A Second Course in Statistics: Regression Analysis WILLIAM MENDENHALL University of Florida TERRY SINCICH University of South Florida PRENTICE HALL Upper Saddle River, New Jersey 07458
Single and multiple linear regression analysis
 Single and multiple linear regression analysis Marike Cockeran 2017 Introduction Outline of the session Simple linear regression analysis SPSS example of simple linear regression analysis Additional topics
Regression Analysis Tutorial 34 LECTURE / DISCUSSION. Statistical Properties of OLS
 Regression Analysis Tutorial 34 LETURE / DISUSSION Statistical Properties of OLS Regression Analysis Tutorial 35 Statistical Properties of OLS y = " + $x + g dependent included omitted variable explanatory