Regression Analysis. A statistical procedure used to find relations among a set of variables.
|
|
|
- Sylvia Webb
- 5 years ago
- Views:
Transcription

1 Regression Analysis A statistical procedure used to find relations among a set of variables.


2 Understanding relations Mapping data enables us to examine (describe) where things occur (e.g., areas where the population is overweight, neighbourhoods with higher crime rates)


3 Understanding relations We can then ask why? What factors are associated with areas where the population is overweight, with areas that have higher crime rates? If we can begin to understand the relations amongst the factors, we can then begin to consider policy implications (moving from descriptive analyses [graphs & maps] to prescriptive considerations).

4 Understanding relations There are many different ways of developing an understanding of relations. Some of the methods include: Correlation analysis Regression analysis
5 Understanding relations Regression analysis allows you to model, examine, and explore spatial relations and can help explain the factors behind observed spatial patterns. You may want to understand what factors contribute to higher numbers of overweight people, to higher crime rates. By modeling spatial relations, however, regression analysis can also be used for prediction. Modeling the factors that contribute to obesity can help planners identify how policy could help reduce obesity rates. You might also use regression to examine the factors that relate biodiversity losses to landscape changes (Fragstats).
6 Regression analysis Ordinary Least Squares (OLS) is the best known of all regression techniques. It is also the traditional starting point for all spatial regression analyses. It provides a global model of the variable or process you are trying to understand or predict (obesity/biodiversity loss); it creates a single regression equation to represent that process. Geographically weighted regression (GWR) is one of several spatial regression techniques increasingly used in geography and other disciplines. GWR provides a local model of the variable or process you are trying to understand/predict by fitting a regression equation to every feature in the dataset.
7 Simple linear regression In regression analysis, there is a dependent variable, which is the one you are trying to explain, and one or more independent variables that are related to it. (Wiki page) You can express the relation as a linear equation, such as: y = a + bx
8 y = a + bx y is the dependent variable x is the independent variable a is a constant (i.e., the value of y when x is 0) b is the slope of the line For every increase of 1 in x, y changes by an amount equal to b
9 Ordinary least squares Regression finds the line that best fits the observations. It does this by finding the line that results in the lowest sum of squared residuals. That is, there are many lines for which the sum of the negative residuals (for points below the line) will exactly equal the sum of the positive residuals (for points above the line) (such as a horizontal line at the mean).
10 Ordinary least squares Therefore, summing just the residuals isn t useful. So, instead, regression uses the sum of the squares of the residuals. An Ordinary Least Squares (OLS) regression finds the single line that results in the lowest sum of squared residuals.

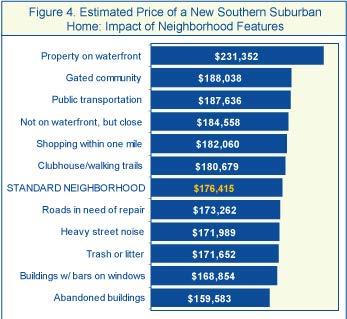
11 Multiple Regression What if there are several factors affecting the independent variable? For example, think of the price of a home as a dependent variable. Several factors contribute to the price of a home. Among them are the size (ft 2 ), the # of bedrooms, the # of bathrooms, the age of the home, if it has both central heat and air conditioning, and, of course, location (and all that that entails).


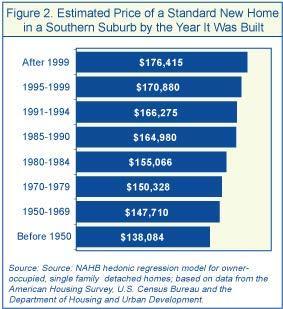
12 Home pricing A hedonic model

13 The Multiple Regression Equation Each of these factors has a separate relation with the price of a home. The equation that describes a multiple regression relation is: This equation separates each individual independent variable from the rest, allowing each to have its own coefficient describing its relation to the dependent variable. If size (ft 2 ) is one of the independent variables, and it has a coefficient of 50, then every additional square foot of space adds $50, on average, to the price of the home.
14 In a multiple regression analysis of home prices, you take data from actual homes that have sold recently. You include the selling price, as well as the values for the independent variables (square footage, # of bedrooms, etc.). The multiple regression analysis finds the coefficients for each independent variable so that they make the line that has the lowest sum of squared residuals (in n-dimensional space, where n = # of independent variables). How Do You Run a Regression?
15 How Good is the Model? One of the measures of how well the model explains the data is the r 2 value. Differences between observations that are not explained by the model remain in the error term (e). The r 2 value tells you what percent of those differences is explained by the model. An r 2 of.68 means that 68% of the variance in the observed values of the dependent variable is explained by the model, and 32% of those differences remains unexplained in the error (residual) term. Explained Unexplained 100 %

16 Some of the error is random, and no model will explain it. A prospective homebuyer might value a basement playroom more than other people because it reminds her of her grandmother s house where she played as a child. This can t be observed or measured, and these types of effects will vary randomly and unpredictably. Some variance will always remain in the error term. As long as it is random, it is of no concern. Sometimes there s no accounting for taste
 we might be able to reduce the residual.")
17 Some of the error isn t error Some of the error is best described as unexplained residual if we added additional variables (such as, for homes in Vancouver, the high school catchment that the home lies within) we might be able to reduce the residual. (See the discussion below on omitted variables.)
18 p-values and Significance Levels Each independent variable has another number attached to it in the regression results its p-value or significance level. The p-value is a percentage. It tells you how likely it is that the coefficient for that independent variable emerged by chance and does not describe a real relation.
19 p-values and Significance Levels A p-value of.05 means that there is a 5% chance that the relation emerged randomly and a 95% chance that the relationship is real. It is generally accepted practice to consider variables with a p-value of less than.05 as significant, though the only basis for this cutoff is convention.

20 Significance Levels of F There is also a significance level for the model as a whole. This is the F value. This measures the likelihood that the model as a whole describes a relation that emerged at random, rather than a real relationship. As with the p-value, the smaller the significance F value, the greater the chance that the relations in the model are real.
21 Some Things to Watch Out For Multicollinearity (where variables may add up to 100%) Omitted Variables Endogeneity (feedback amongst variables) Other effects
22 Multicollinearity Multicollinearity occurs when one or more of your independent variables are related to one another. The coefficient for each independent variable shows how much an increase of one in its value will change the dependent variable, holding all other independent variables constant. But what if you cannot hold them constant? If you have two houses that are exactly the same, and you add a bedroom to one of them, the value of the house may go up by, say, $10,000. But you have also added to its square footage. How much of that $10,000 is a result of the extra bedroom and how much is a result of the extra square footage? # bedrooms Size
23 Multicollinearity If the variables are very closely related, and/or if you have only a small number of observations, it can be difficult to separate these effects. Your regression derives the coefficients that best describe your set of data, but the independent variables may not have a valid p-value if multicollinearity is present. This is often assessed using correlation values. The Variance Inflation Factor (VIF) is used to judge how significant the multicollinearity is.
24 Multicollinearity Sometimes it may be appropriate to remove a variable that is related to others, but it may not always be appropriate. In our home value example, both the number of bedrooms and the square footage are important on their own, in addition to whatever combined effects they may have. Removing one variable may be worse than leaving it in. This does not necessarily mean that the model as a whole is problematic, but it may mean that the model should not be used to draw conclusions about the relation of individual independent variables with the dependent variable.
25 Omitted Variables If independent variables that have significant relations with the dependent variable are left out of the model, the results will not be as good as if they are included. In our home value example, any real estate agent will tell you that location is the most important variable of all. But location is hard to measure. Locations are more or less desirable based on a number of factors. Some of them, like population density or crime rate, may be measurable factors that can be included. Others, like perceived quality of the local schools, may be more difficult to quantify.? $ Value $ Rooms Size
26 Omitted Variables You must also decide what level of specificity to use. Do you use the crime rate for the neighbourhood, the postal code, the street? Is the data even available at the level of specificity you want to use? These factors can lead to omitted variable bias variance in the error term (e) that is not random and that could be explained by an independent variable that is not in the model (geography often is an omitted variable). Such bias can distort the coefficients on the other independent variables, as well as decreasing the r 2 and increasing the F. Sometimes data just isn t available, and some variables aren t measurable. There are methods for reducing the bias from omitted variables, but it can t always be completely corrected.
27 Endogeneity Regression measures the effect of changes in the independent variable on the dependent variable. Endogeneity occurs when that relation is either backwards or circular, meaning that changes in the dependent variable cause changes in the independent variable. Home value School quality
28 Endogeneity In our home value example, the perceived quality of the local school might affect home values. But the perceived quality is likely also related to the actual quality, and the actual quality is at least partially a result of funding levels. Funding levels are often related to the property tax base, or the value of local homes. So good schools increase home values, but high home values also improve schools. This circular relation, if it is strong, can bias the results of the regression. There are strategies for reducing the bias if removing the endogenous variable is not an option. Home value School quality
29 Other effects There are several other types of biases or sources of distortion that can exist in a model for a variety of reasons. Spatial autocorrelation is one significant bias that can greatly affect aspatial regression. There are tests to measure the levels of bias, and there are strategies that can be used to reduce it. Eventually, though, one may have to accept a certain amount of bias in the final model, especially when there are data limitations. In that case, the best that can be done is to describe the problem and the effects it might have when presenting the model.
 may reveal.")
30 Geographically-weighted regression In "normal" regression (e.g., OLS) we assume that the relationship we are modelling holds everywhere in the study area that is, the regression parameters are "whole-map" statistics. In many situations this is not necessarily the case, as mapping the residuals (the difference between the observed and predicted data) may reveal. GWR provides an elegant and easily grasped means of modelling such relations.
31 Geographically-weighted regression Geographically Weighted Regression (GWR) is one of several spatial regression techniques increasingly used in geography and other disciplines. GWR provides a local model of the variable or process you are trying to understand/predict by fitting a regression equation to every feature in the dataset. GWR constructs these separate equations by incorporating the dependent and explanatory variables of features falling within the bandwidth of each target feature. The shape and size of the bandwidth is dependent on user input for the Kernel type, Bandwidth method, Distance, and Number of neighbors parameters.
32 Geographically-weighted regression GWR permits the parameter estimates to vary locally; we can rewrite the (now nonspatial regression) model in a slightly different form: y(g) = b 0 (g) + b 1 (g)x 1 + b 2 (g)x 2 + e where (g) indicates that the parameters are to be estimated at a location whose coordinates are given by the vector g (e.g., [UTM easting, UTM northing ]).
33 In standard applications of regression, a dependent variable is linked to a set of independent variables with one of the main outputs of regression being the estimation of a parameter that links each independent variable to the dependent variable. A major problem with this technique when applied to spatial data is that the processes being examined are assumed to be constant over space that is, one model fits all.
34 GWR allows for the modelling of processes that vary over space. GWR results in a set of local parameter estimates for each relationship which can be mapped to produce a parameter surface across the study region. In this way, GWR provides valuable information on the nature of the processes being investigated and supersedes traditional global types of regression modelling.
35 Once we enable the regression to become local we need to consider how to localize the method: The shape and size of the bandwidth is dependent on user input for the Kernel type (Fixed or Adaptive), Bandwidth method, Distance, and/or # of neighbours parameters. GWR Considerations
36 Multilevel Modeling Broad social, economic, cultural, environmental conditions Social, family and community networks Individual behaviour Innate individual traits (age, sex, biological factors)
37 In lab 3 we will explore the use of GWR using some real data. It is a simple transformation of OLS, but nonethe-less the results can require some considerable understanding in order to describe the spatial patterns exposed. Summary
Running head: GEOGRAPHICALLY WEIGHTED REGRESSION 1. Geographically Weighted Regression. Chelsey-Ann Cu GEOB 479 L2A. University of British Columbia
 Running head: GEOGRAPHICALLY WEIGHTED REGRESSION 1 Geographically Weighted Regression Chelsey-Ann Cu 32482135 GEOB 479 L2A University of British Columbia Dr. Brian Klinkenberg 9 February 2018 GEOGRAPHICALLY
Modeling Spatial Relationships Using Regression Analysis
 Esri International User Conference San Diego, California Technical Workshops July 24, 2012 Modeling Spatial Relationships Using Regression Analysis Lauren M. Scott, PhD Lauren Rosenshein Bennett, MS Answering
Modeling Spatial Relationships Using Regression Analysis. Lauren M. Scott, PhD Lauren Rosenshein Bennett, MS
 Modeling Spatial Relationships Using Regression Analysis Lauren M. Scott, PhD Lauren Rosenshein Bennett, MS Workshop Overview Answering why? questions Introduce regression analysis - What it is and why
Using Spatial Statistics Social Service Applications Public Safety and Public Health
 Using Spatial Statistics Social Service Applications Public Safety and Public Health Lauren Rosenshein 1 Regression analysis Regression analysis allows you to model, examine, and explore spatial relationships,
Modeling Spatial Relationships using Regression Analysis
 Esri International User Conference San Diego, CA Technical Workshops July 2011 Modeling Spatial Relationships using Regression Analysis Lauren M. Scott, PhD Lauren Rosenshein, MS Mark V. Janikas, PhD Answering
ECON 497 Midterm Spring
 ECON 497 Midterm Spring 2009 1 ECON 497: Economic Research and Forecasting Name: Spring 2009 Bellas Midterm You have three hours and twenty minutes to complete this exam. Answer all questions and explain
Regression Models. Chapter 4. Introduction. Introduction. Introduction
 Chapter 4 Regression Models Quantitative Analysis for Management, Tenth Edition, by Render, Stair, and Hanna 008 Prentice-Hall, Inc. Introduction Regression analysis is a very valuable tool for a manager
Lecture 4: Multivariate Regression, Part 2
 Lecture 4: Multivariate Regression, Part 2 Gauss-Markov Assumptions 1) Linear in Parameters: Y X X X i 0 1 1 2 2 k k 2) Random Sampling: we have a random sample from the population that follows the above
2. Linear regression with multiple regressors
 2. Linear regression with multiple regressors Aim of this section: Introduction of the multiple regression model OLS estimation in multiple regression Measures-of-fit in multiple regression Assumptions
Chapter 4: Regression Models
 Sales volume of company 1 Textbook: pp. 129-164 Chapter 4: Regression Models Money spent on advertising 2 Learning Objectives After completing this chapter, students will be able to: Identify variables,
GIS Analysis: Spatial Statistics for Public Health: Lauren M. Scott, PhD; Mark V. Janikas, PhD
 Some Slides to Go Along with the Demo Hot spot analysis of average age of death Section B DEMO: Mortality Data Analysis 2 Some Slides to Go Along with the Demo Do Economic Factors Alone Explain Early Death?
1 A Non-technical Introduction to Regression
 1 A Non-technical Introduction to Regression Chapters 1 and Chapter 2 of the textbook are reviews of material you should know from your previous study (e.g. in your second year course). They cover, in
ECON 497: Lecture 4 Page 1 of 1
 ECON 497: Lecture 4 Page 1 of 1 Metropolitan State University ECON 497: Research and Forecasting Lecture Notes 4 The Classical Model: Assumptions and Violations Studenmund Chapter 4 Ordinary least squares
Lecture 4: Multivariate Regression, Part 2
 Lecture 4: Multivariate Regression, Part 2 Gauss-Markov Assumptions 1) Linear in Parameters: Y X X X i 0 1 1 2 2 k k 2) Random Sampling: we have a random sample from the population that follows the above
ECON 4230 Intermediate Econometric Theory Exam
 ECON 4230 Intermediate Econometric Theory Exam Multiple Choice (20 pts). Circle the best answer. 1. The Classical assumption of mean zero errors is satisfied if the regression model a) is linear in the
Chapter Learning Objectives. Regression Analysis. Correlation. Simple Linear Regression. Chapter 12. Simple Linear Regression
 Chapter 12 12-1 North Seattle Community College BUS21 Business Statistics Chapter 12 Learning Objectives In this chapter, you learn:! How to use regression analysis to predict the value of a dependent
Keller: Stats for Mgmt & Econ, 7th Ed July 17, 2006
 Chapter 17 Simple Linear Regression and Correlation 17.1 Regression Analysis Our problem objective is to analyze the relationship between interval variables; regression analysis is the first tool we will
Statistics: A review. Why statistics?
 Statistics: A review Why statistics? What statistical concepts should we know? Why statistics? To summarize, to explore, to look for relations, to predict What kinds of data exist? Nominal, Ordinal, Interval
A GEOSTATISTICAL APPROACH TO PREDICTING A PHYSICAL VARIABLE THROUGH A CONTINUOUS SURFACE
 Katherine E. Williams University of Denver GEOG3010 Geogrpahic Information Analysis April 28, 2011 A GEOSTATISTICAL APPROACH TO PREDICTING A PHYSICAL VARIABLE THROUGH A CONTINUOUS SURFACE Overview Data
Regression Analysis. BUS 735: Business Decision Making and Research
 Regression Analysis BUS 735: Business Decision Making and Research 1 Goals and Agenda Goals of this section Specific goals Learn how to detect relationships between ordinal and categorical variables. Learn
Regression Models. Chapter 4
 Chapter 4 Regression Models To accompany Quantitative Analysis for Management, Eleventh Edition, by Render, Stair, and Hanna Power Point slides created by Brian Peterson Introduction Regression analysis
CS 147: Computer Systems Performance Analysis
 CS 147: Computer Systems Performance Analysis Advanced Regression Techniques CS 147: Computer Systems Performance Analysis Advanced Regression Techniques 1 / 31 Overview Overview Overview Common Transformations
Basic Business Statistics 6 th Edition
 Basic Business Statistics 6 th Edition Chapter 12 Simple Linear Regression Learning Objectives In this chapter, you learn: How to use regression analysis to predict the value of a dependent variable based
Example: Forced Expiratory Volume (FEV) Program L13. Example: Forced Expiratory Volume (FEV) Example: Forced Expiratory Volume (FEV)
 Program L13. Example: Forced Expiratory Volume (FEV) Example: Forced Expiratory Volume (FEV)") Program L13 Relationships between two variables Correlation, cont d Regression Relationships between more than two variables Multiple linear regression Two numerical variables Linear or curved relationship?
Program L13 Relationships between two variables Correlation, cont d Regression Relationships between more than two variables Multiple linear regression Two numerical variables Linear or curved relationship?
Exploratory Spatial Data Analysis (ESDA)
") Exploratory Spatial Data Analysis (ESDA) VANGHR s method of ESDA follows a typical geospatial framework of selecting variables, exploring spatial patterns, and regression analysis. The primary software
Exploratory Spatial Data Analysis (ESDA) VANGHR s method of ESDA follows a typical geospatial framework of selecting variables, exploring spatial patterns, and regression analysis. The primary software
Chapter 16. Simple Linear Regression and Correlation
 Chapter 16 Simple Linear Regression and Correlation 16.1 Regression Analysis Our problem objective is to analyze the relationship between interval variables; regression analysis is the first tool we will
Statistics for Managers using Microsoft Excel 6 th Edition
 Statistics for Managers using Microsoft Excel 6 th Edition Chapter 13 Simple Linear Regression 13-1 Learning Objectives In this chapter, you learn: How to use regression analysis to predict the value of
Correlation Analysis
 Simple Regression Correlation Analysis Correlation analysis is used to measure strength of the association (linear relationship) between two variables Correlation is only concerned with strength of the
Chapter 4. Regression Models. Learning Objectives
 Chapter 4 Regression Models To accompany Quantitative Analysis for Management, Eleventh Edition, by Render, Stair, and Hanna Power Point slides created by Brian Peterson Learning Objectives After completing
Regression of Inflation on Percent M3 Change
 ECON 497 Final Exam Page of ECON 497: Economic Research and Forecasting Name: Spring 2006 Bellas Final Exam Return this exam to me by midnight on Thursday, April 27. It may be e-mailed to me. It may be
Chapter 16. Simple Linear Regression and dcorrelation
 Chapter 16 Simple Linear Regression and dcorrelation 16.1 Regression Analysis Our problem objective is to analyze the relationship between interval variables; regression analysis is the first tool we will
APPENDIX 1 BASIC STATISTICS. Summarizing Data
 1 APPENDIX 1 Figure A1.1: Normal Distribution BASIC STATISTICS The problem that we face in financial analysis today is not having too little information but too much. Making sense of large and often contradictory
Chapter 2: Studying Geography, Economics, and Citizenship
 Chapter 2: Studying Geography, Economics, and Citizenship Lesson 2.1 Studying Geography I. Displaying the Earth s Surface A. A globe of the Earth best shows the sizes of continents and the shapes of landmasses
Introduction to Regression
 Regression Introduction to Regression If two variables covary, we should be able to predict the value of one variable from another. Correlation only tells us how much two variables covary. In regression,
Chapter 5: Preferences
 Chapter 5: Preferences 5.1: Introduction In chapters 3 and 4 we considered a particular type of preferences in which all the indifference curves are parallel to each other and in which each indifference
Evaluating sustainable transportation offers through housing price: a comparative analysis of Nantes urban and periurban/rural areas (France)
") Evaluating sustainable transportation offers through housing price: a comparative analysis of Nantes urban and periurban/rural areas (France) Julie Bulteau, UVSQ-CEARC-OVSQ Thierry Feuillet, Université
Evaluating sustainable transportation offers through housing price: a comparative analysis of Nantes urban and periurban/rural areas (France) Julie Bulteau, UVSQ-CEARC-OVSQ Thierry Feuillet, Université
ECON 497: Lecture Notes 10 Page 1 of 1
 ECON 497: Lecture Notes 10 Page 1 of 1 Metropolitan State University ECON 497: Research and Forecasting Lecture Notes 10 Heteroskedasticity Studenmund Chapter 10 We'll start with a quote from Studenmund:
2 Prediction and Analysis of Variance
 2 Prediction and Analysis of Variance Reading: Chapters and 2 of Kennedy A Guide to Econometrics Achen, Christopher H. Interpreting and Using Regression (London: Sage, 982). Chapter 4 of Andy Field, Discovering
Spatial Analysis I. Spatial data analysis Spatial analysis and inference
 Spatial Analysis I Spatial data analysis Spatial analysis and inference Roadmap Outline: What is spatial analysis? Spatial Joins Step 1: Analysis of attributes Step 2: Preparing for analyses: working with
MATH 1070 Introductory Statistics Lecture notes Relationships: Correlation and Simple Regression
 MATH 1070 Introductory Statistics Lecture notes Relationships: Correlation and Simple Regression Objectives: 1. Learn the concepts of independent and dependent variables 2. Learn the concept of a scatterplot
Online Robustness Appendix to Endogenous Gentrification and Housing Price Dynamics
 Online Robustness Appendix to Endogenous Gentrification and Housing Price Dynamics Robustness Appendix to Endogenous Gentrification and Housing Price Dynamics This robustness appendix provides a variety
1 Correlation and Inference from Regression
 1 Correlation and Inference from Regression Reading: Kennedy (1998) A Guide to Econometrics, Chapters 4 and 6 Maddala, G.S. (1992) Introduction to Econometrics p. 170-177 Moore and McCabe, chapter 12 is
Simple Linear Regression Using Ordinary Least Squares
 Simple Linear Regression Using Ordinary Least Squares Purpose: To approximate a linear relationship with a line. Reason: We want to be able to predict Y using X. Definition: The Least Squares Regression
ECON 450 Development Economics
 ECON 450 Development Economics Statistics Background University of Illinois at Urbana-Champaign Summer 2017 Outline 1 Introduction 2 3 4 5 Introduction Regression analysis is one of the most important
Introduction to Regression Analysis. Dr. Devlina Chatterjee 11 th August, 2017
 Introduction to Regression Analysis Dr. Devlina Chatterjee 11 th August, 2017 What is regression analysis? Regression analysis is a statistical technique for studying linear relationships. One dependent
Midterm 1 ECO Undergraduate Econometrics
 Midterm ECO 23 - Undergraduate Econometrics Prof. Carolina Caetano INSTRUCTIONS Reading and understanding the instructions is your responsibility. Failure to comply may result in loss of points, and there
Hypothesis testing Goodness of fit Multicollinearity Prediction. Applied Statistics. Lecturer: Serena Arima
 Applied Statistics Lecturer: Serena Arima Hypothesis testing for the linear model Under the Gauss-Markov assumptions and the normality of the error terms, we saw that β N(β, σ 2 (X X ) 1 ) and hence s
q3_3 MULTIPLE CHOICE. Choose the one alternative that best completes the statement or answers the question.
 q3_3 MULTIPLE CHOICE. Choose the one alternative that best completes the statement or answers the question. Provide an appropriate response. 1) In 2007, the number of wins had a mean of 81.79 with a standard
Final Exam - Solutions
 Ecn 102 - Analysis of Economic Data University of California - Davis March 17, 2010 Instructor: John Parman Final Exam - Solutions You have until 12:30pm to complete this exam. Please remember to put your
11.433J / J Real Estate Economics Fall 2008
 MIT OpenCourseWare http://ocw.mit.edu 11.433J / 15.021J Real Estate Economics Fall 2008 For information about citing these materials or our Terms of Use, visit: http://ocw.mit.edu/terms. Recitation 3 Real
EC4051 Project and Introductory Econometrics
 EC4051 Project and Introductory Econometrics Dudley Cooke Trinity College Dublin Dudley Cooke (Trinity College Dublin) Intro to Econometrics 1 / 23 Project Guidelines Each student is required to undertake
Regression Analysis Primer DEO PowerPoint, Bureau of Labor Market Statistics
 Regression Analysis Primer DEO PowerPoint, Bureau of Labor Market Statistics September 27-30, 2017 Regression Analysis Stephen Birch, Economic Consultant LTIP Technical Lead, Projections Managing Partnership
Ridge Regression. Summary. Sample StatFolio: ridge reg.sgp. STATGRAPHICS Rev. 10/1/2014
 Ridge Regression Summary... 1 Data Input... 4 Analysis Summary... 5 Analysis Options... 6 Ridge Trace... 7 Regression Coefficients... 8 Standardized Regression Coefficients... 9 Observed versus Predicted...
Linear Regression Communication, skills, and understanding Calculator Use
 Linear Regression Communication, skills, and understanding Title, scale and label the horizontal and vertical axes Comment on the direction, shape (form), and strength of the relationship and unusual features
APPLICATION OF GEOGRAPHICALLY WEIGHTED REGRESSION ANALYSIS TO LAKE-SEDIMENT DATA FROM AN AREA OF THE CANADIAN SHIELD IN SASKATCHEWAN AND ALBERTA
 APPLICATION OF GEOGRAPHICALLY WEIGHTED REGRESSION ANALYSIS TO LAKE-SEDIMENT DATA FROM AN AREA OF THE CANADIAN SHIELD IN SASKATCHEWAN AND ALBERTA Nadia Yavorskaya 1, Stephen Amor 2 1 450 Bonner Av., Winnipeg,
Econometrics Part Three
 !1 I. Heteroskedasticity A. Definition 1. The variance of the error term is correlated with one of the explanatory variables 2. Example -- the variance of actual spending around the consumption line increases
Linear Regression is a very popular method in science and engineering. It lets you establish relationships between two or more numerical variables.
 Lab 13. Linear Regression www.nmt.edu/~olegm/382labs/lab13r.pdf Note: the things you will read or type on the computer are in the Typewriter Font. All the files mentioned can be found at www.nmt.edu/~olegm/382labs/
Evaluating Piecewise-defined Functions Sketching the Graph of a Piecewise-defined Functions
 7 Functions Concepts: The Definition of A Function Function Notation Piecewise-defined Functions Evaluating Piecewise-defined Functions Sketching the Graph of a Piecewise-defined Functions The Domain of
INTRODUCTION TO BASIC LINEAR REGRESSION MODEL
 INTRODUCTION TO BASIC LINEAR REGRESSION MODEL 13 September 2011 Yogyakarta, Indonesia Cosimo Beverelli (World Trade Organization) 1 LINEAR REGRESSION MODEL In general, regression models estimate the effect
Linear Models in Econometrics
 Linear Models in Econometrics Nicky Grant At the most fundamental level econometrics is the development of statistical techniques suited primarily to answering economic questions and testing economic theories.
WISE International Masters
 WISE International Masters ECONOMETRICS Instructor: Brett Graham INSTRUCTIONS TO STUDENTS 1 The time allowed for this examination paper is 2 hours. 2 This examination paper contains 32 questions. You are
Linear Regression with one Regressor
 1 Linear Regression with one Regressor Covering Chapters 4.1 and 4.2. We ve seen the California test score data before. Now we will try to estimate the marginal effect of STR on SCORE. To motivate these
Models for Count and Binary Data. Poisson and Logistic GWR Models. 24/07/2008 GWR Workshop 1
 Models for Count and Binary Data Poisson and Logistic GWR Models 24/07/2008 GWR Workshop 1 Outline I: Modelling counts Poisson regression II: Modelling binary events Logistic Regression III: Poisson Regression
The cover page of the Encyclopedia of Health Economics (2014) Introduction to Econometric Application in Health Economics
 Introduction to Econometric Application in Health Economics") PHPM110062 Teaching Demo The cover page of the Encyclopedia of Health Economics (2014) Introduction to Econometric Application in Health Economics Instructor: Mengcen Qian School of Public Health What
PHPM110062 Teaching Demo The cover page of the Encyclopedia of Health Economics (2014) Introduction to Econometric Application in Health Economics Instructor: Mengcen Qian School of Public Health What
Business Statistics. Chapter 14 Introduction to Linear Regression and Correlation Analysis QMIS 220. Dr. Mohammad Zainal
 Department of Quantitative Methods & Information Systems Business Statistics Chapter 14 Introduction to Linear Regression and Correlation Analysis QMIS 220 Dr. Mohammad Zainal Chapter Goals After completing
, (1) e i = ˆσ 1 h ii. c 2016, Jeffrey S. Simonoff 1
 e i = ˆσ 1 h ii. c 2016, Jeffrey S. Simonoff 1") Regression diagnostics As is true of all statistical methodologies, linear regression analysis can be a very effective way to model data, as along as the assumptions being made are true. For the regression
Regression diagnostics As is true of all statistical methodologies, linear regression analysis can be a very effective way to model data, as along as the assumptions being made are true. For the regression
Name: Date: Period: #: Chapter 1: Outline Notes What Does a Historian Do?
 Name: Date: Period: #: Chapter 1: Outline Notes What Does a Historian Do? Lesson 1.1 What is History? I. Why Study History? A. History is the study of the of the past. History considers both the way things
1. Regressions and Regression Models. 2. Model Example. EEP/IAS Introductory Applied Econometrics Fall Erin Kelley Section Handout 1
 1. Regressions and Regression Models Simply put, economists use regression models to study the relationship between two variables. If Y and X are two variables, representing some population, we are interested
 STOCKHOLM UNIVERSITY Department of Economics Course name: Empirical Methods Course code: EC40 Examiner: Lena Nekby Number of credits: 7,5 credits Date of exam: Friday, June 5, 009 Examination time: 3 hours
Identifying Graphs of Functions (Vertical Line Test) Evaluating Piecewise-defined Functions Sketching the Graph of a Piecewise-defined Functions
 Evaluating Piecewise-defined Functions Sketching the Graph of a Piecewise-defined Functions") 9 Functions Concepts: The Definition of A Function Identifying Graphs of Functions (Vertical Line Test) Function Notation Piecewise-defined Functions Evaluating Piecewise-defined Functions Sketching the
9 Functions Concepts: The Definition of A Function Identifying Graphs of Functions (Vertical Line Test) Function Notation Piecewise-defined Functions Evaluating Piecewise-defined Functions Sketching the
Interactions. Interactions. Lectures 1 & 2. Linear Relationships. y = a + bx. Slope. Intercept
 Interactions Lectures 1 & Regression Sometimes two variables appear related: > smoking and lung cancers > height and weight > years of education and income > engine size and gas mileage > GMAT scores and
Regression Analysis Tutorial 34 LECTURE / DISCUSSION. Statistical Properties of OLS
 Regression Analysis Tutorial 34 LETURE / DISUSSION Statistical Properties of OLS Regression Analysis Tutorial 35 Statistical Properties of OLS y = " + $x + g dependent included omitted variable explanatory
Violation of OLS assumption- Multicollinearity
 Violation of OLS assumption- Multicollinearity What, why and so what? Lars Forsberg Uppsala University, Department of Statistics October 17, 2014 Lars Forsberg (Uppsala University) 1110 - Multi - co -
Geographically Weighted Regression LECTURE 2 : Introduction to GWR II
 Geographically Weighted Regression LECTURE 2 : Introduction to GWR II Stewart.Fotheringham@nuim.ie http://ncg.nuim.ie/gwr A Simulation Experiment Y i = α i + β 1i X 1i + β 2i X 2i Data on X 1 and X 2 drawn
Handout 12. Endogeneity & Simultaneous Equation Models
 Handout 12. Endogeneity & Simultaneous Equation Models In which you learn about another potential source of endogeneity caused by the simultaneous determination of economic variables, and learn how to
Unless provided with information to the contrary, assume for each question below that the Classical Linear Model assumptions hold.
 Economics 345: Applied Econometrics Section A01 University of Victoria Midterm Examination #2 Version 1 SOLUTIONS Spring 2015 Instructor: Martin Farnham Unless provided with information to the contrary,
ESRI 2008 Health GIS Conference
 ESRI 2008 Health GIS Conference An Exploration of Geographically Weighted Regression on Spatial Non- Stationarity and Principal Component Extraction of Determinative Information from Robust Datasets A
Contest Quiz 3. Question Sheet. In this quiz we will review concepts of linear regression covered in lecture 2.
 Updated: November 17, 2011 Lecturer: Thilo Klein Contact: tk375@cam.ac.uk Contest Quiz 3 Question Sheet In this quiz we will review concepts of linear regression covered in lecture 2. NOTE: Please round
Classification & Regression. Multicollinearity Intro to Nominal Data
 Multicollinearity Intro to Nominal Let s Start With A Question y = β 0 + β 1 x 1 +β 2 x 2 y = Anxiety Level x 1 = heart rate x 2 = recorded pulse Since we can all agree heart rate and pulse are related,
Ordinary Least Squares (OLS): Multiple Linear Regression (MLR) Analytics What s New? Not Much!
: Multiple Linear Regression (MLR) Analytics What s New? Not Much!") Ordinary Least Squares (OLS): Multiple Linear Regression (MLR) Analytics What s New? Not Much! OLS: Comparison of SLR and MLR Analysis Interpreting Coefficients I (SRF): Marginal effects ceteris paribus
Ordinary Least Squares (OLS): Multiple Linear Regression (MLR) Analytics What s New? Not Much! OLS: Comparison of SLR and MLR Analysis Interpreting Coefficients I (SRF): Marginal effects ceteris paribus
Probability and Samples. Sampling. Point Estimates
 Probability and Samples Sampling We want the results from our sample to be true for the population and not just the sample But our sample may or may not be representative of the population Sampling error
LECTURE 15: SIMPLE LINEAR REGRESSION I
 David Youngberg BSAD 20 Montgomery College LECTURE 5: SIMPLE LINEAR REGRESSION I I. From Correlation to Regression a. Recall last class when we discussed two basic types of correlation (positive and negative).
Chapter 3: Examining Relationships
 Chapter 3: Examining Relationships Most statistical studies involve more than one variable. Often in the AP Statistics exam, you will be asked to compare two data sets by using side by side boxplots or
Regression Analysis of 911 call frequency in Portland, OR Urban Areas in Relation to Call Center Vicinity Elyse Maurer March 13, 2015
 Regression Analysis of 911 call frequency in Portland, OR Urban Areas in Relation to Call Center Vicinity Elyse Maurer March 13, 2015 Introduction: Using the Linear Regression and Geographically Weighted
Sociology 593 Exam 1 Answer Key February 17, 1995
 Sociology 593 Exam 1 Answer Key February 17, 1995 I. True-False. (5 points) Indicate whether the following statements are true or false. If false, briefly explain why. 1. A researcher regressed Y on. When
10. Alternative case influence statistics
 10. Alternative case influence statistics a. Alternative to D i : dffits i (and others) b. Alternative to studres i : externally-studentized residual c. Suggestion: use whatever is convenient with the
1 Motivation for Instrumental Variable (IV) Regression
 Regression") ECON 370: IV & 2SLS 1 Instrumental Variables Estimation and Two Stage Least Squares Econometric Methods, ECON 370 Let s get back to the thiking in terms of cross sectional (or pooled cross sectional) data
ECON 370: IV & 2SLS 1 Instrumental Variables Estimation and Two Stage Least Squares Econometric Methods, ECON 370 Let s get back to the thiking in terms of cross sectional (or pooled cross sectional) data
Study Guide AP Statistics
 Study Guide AP Statistics Name: Part 1: Multiple Choice. Circle the letter corresponding to the best answer. 1. Other things being equal, larger automobile engines are less fuel-efficient. You are planning
PhD/MA Econometrics Examination. January, 2015 PART A. (Answer any TWO from Part A)
") PhD/MA Econometrics Examination January, 2015 Total Time: 8 hours MA students are required to answer from A and B. PhD students are required to answer from A, B, and C. PART A (Answer any TWO from Part
PhD/MA Econometrics Examination January, 2015 Total Time: 8 hours MA students are required to answer from A and B. PhD students are required to answer from A, B, and C. PART A (Answer any TWO from Part
Geographically Weighted Regression and Kriging: Alternative Approaches to Interpolation A Stewart Fotheringham
 Geographically Weighted Regression and Kriging: Alternative Approaches to Interpolation A Stewart Fotheringham National Centre for Geocomputation National University of Ireland, Maynooth http://ncg.nuim.ie
Ch 13 & 14 - Regression Analysis
 Ch 3 & 4 - Regression Analysis Simple Regression Model I. Multiple Choice:. A simple regression is a regression model that contains a. only one independent variable b. only one dependent variable c. more
Chapter 2 - Lessons 1 & 2 Studying Geography, Economics
 Chapter 2 - Lessons 1 & 2 Studying Geography, Economics How does geography influence the way people live? Why do people trade? Why do people form governments? Lesson 1 - How Does Geography Influence the
Final Exam. Name: Solution:
 Final Exam. Name: Instructions. Answer all questions on the exam. Open books, open notes, but no electronic devices. The first 13 problems are worth 5 points each. The rest are worth 1 point each. HW1.
Do not copy, post, or distribute
 14 CORRELATION ANALYSIS AND LINEAR REGRESSION Assessing the Covariability of Two Quantitative Properties 14.0 LEARNING OBJECTIVES In this chapter, we discuss two related techniques for assessing a possible
MATH 1150 Chapter 2 Notation and Terminology
 MATH 1150 Chapter 2 Notation and Terminology Categorical Data The following is a dataset for 30 randomly selected adults in the U.S., showing the values of two categorical variables: whether or not the
3 Non-linearities and Dummy Variables
 3 Non-linearities and Dummy Variables Reading: Kennedy (1998) A Guide to Econometrics, Chapters 3, 5 and 6 Aim: The aim of this section is to introduce students to ways of dealing with non-linearities
The Simple Linear Regression Model
 The Simple Linear Regression Model Lesson 3 Ryan Safner 1 1 Department of Economics Hood College ECON 480 - Econometrics Fall 2017 Ryan Safner (Hood College) ECON 480 - Lesson 3 Fall 2017 1 / 77 Bivariate
REED TUTORIALS (Pty) LTD ECS3706 EXAM PACK
 LTD ECS3706 EXAM PACK") REED TUTORIALS (Pty) LTD ECS3706 EXAM PACK 1 ECONOMETRICS STUDY PACK MAY/JUNE 2016 Question 1 (a) (i) Describing economic reality (ii) Testing hypothesis about economic theory (iii) Forecasting future
REED TUTORIALS (Pty) LTD ECS3706 EXAM PACK 1 ECONOMETRICS STUDY PACK MAY/JUNE 2016 Question 1 (a) (i) Describing economic reality (ii) Testing hypothesis about economic theory (iii) Forecasting future
Multiple Regression Analysis
 Multiple Regression Analysis Where as simple linear regression has 2 variables (1 dependent, 1 independent): y ˆ = a + bx Multiple linear regression has >2 variables (1 dependent, many independent): ˆ
BIOSTATISTICS NURS 3324
 Simple Linear Regression and Correlation Introduction Previously, our attention has been focused on one variable which we designated by x. Frequently, it is desirable to learn something about the relationship