Introduction to Regression Analysis. Dr. Devlina Chatterjee 11 th August, 2017
|
|
|
- Joy Cox
- 6 years ago
- Views:
Transcription
1 Introduction to Regression Analysis Dr. Devlina Chatterjee 11 th August, 2017
2 What is regression analysis? Regression analysis is a statistical technique for studying linear relationships. One dependent variable and one or more independent variables, often called predictor variables. Regression is being used more and more in analytics research that affects many aspects of our daily lives, from how much we pay for automobile insurance to which ads appear in our social media.
3 Example of questions where regression analysis is used What is the effect of one more year of education on the income of an individual? What are the factors that indicate whether a particular individual will get a job? Can we predict how the price of a particular stock will change in the next few weeks? How will a particular policy such as change in taxes on cigarettes affect the incidence of smoking in a state? How long will a patient survive after being given a particular treatment as compared to not being given that treatment?
4 Population vs. Sample The research question may be does more education lead to more income? We want to understand the relationship between two variables (education and income) in the population We do not have data for every person in the population Look at data for a smaller sample drawn from the population If the sample is large enough and drawn randomly from the population, then we can make inferences about the population from the relationships observed in the sample The reason we can draw inferences is because of two fundamental theorems in probability: Law of Large Numbers and Central Limit Theorem.
5 Sampling Distributions Suppose that we draw all possible samples of size n from a given population. We compute a statistic (e.g., a mean, proportion, standard deviation) for each sample. The probability distribution of statistic is called a sampling distribution. The standard deviation of this statistic is called the standard error. Mean and Variance of the Sampling Distribution of is given by: E( Y) Y Var( Y) Y Y n 1. As n increases, the distribution of becomes more tightly centered around μ Y (the Law of Large Numbers) 2. Moreover, the distribution of becomes normal (the Central Limit Theorem) 2 Y

6 Law of Large Numbers The law of large numbers states that the sample mean converges to the distribution mean as the sample size increases, and is one of the fundamental theorems of probability.
7 The Central Limit Theorem The Central Limit Theorem states that the sampling distribution of the mean of any independent, random variable will be normal or nearly normal, if the sample size is large enough. Sampling distribution of Y when Y is Bernoulli, p = 0.78:
8 Simple Linear Regression We begin by supposing a general form for the relationship, known as the population regression model: where Y 0 1X1 is the dependent variable and is the independent variable. Our primary interest is to estimate and. These are estimated from a sample of data and are termed and Y X
9 Reasons for doing Regression Determining whether there is evidence that an explanatory variable belongs in a regression model (Statistical significance of a variable) Estimating the effect of an explanatory variable on the dependent variable (Effect Size magnitude of the coefficient ) Measuring the explanatory power of a model (R 2 ) Making individual predictions for individuals not in the original sample
 ( height. in. cms) Sample 1 0 105.")
10 Regression between weight and height e 1 e 3 e Sample ( height. in. metres) ( height. in. cms) Sample
11 The idea of statistical significance Someone may look at the regression results from Sample 1 and Sample 2 and see that the results are slightly different. How much confidence can we have in the values of and estimated from our first sample? We need to test the hypothesis that there is indeed a non-zero correlation between Y and X Which translates to testing the null hypotheses: 0 0 and
12 Hypothesis Testing Test inferences about population parameters using data from a sample. In order to test a hypothesis in statistics, we must perform following steps: 1. Formulate a null hypothesis and an alternative hypothesis on population parameters. X H 0 : vs. H A : X X 2. Build a statistic to test the hypothesis made. z s / n where is the sample mean and s is the sample standard deviation X 3. Define a decision rule to reject or not to reject the null hypothesis.
13 Statistical Significance p values We have to test the null hypothesis 1 0, that is there is no correlation We find the standard error associated with the estimated betas as follows: Given the estimate of and the standard error of the estimate SE( 1 ) We calculate a t-statistic for : 1 0 t SE( 1) If t statistic > 1.96, we can reject null hypothesis 1 0 with 95% confidence. The p-value associated with each variable gives the probability that we could have observed the value of or larger, if the true value of was in fact 0. Very small p-values indicate there is a very small probability of the real being 0 SE( 1) ( n 2) 1 1 ( Yi Y ) ( X 1 i i 2 X ) 2 Indicates that there is a statistically significant relationship between Y and X that is not just due to chance alone.
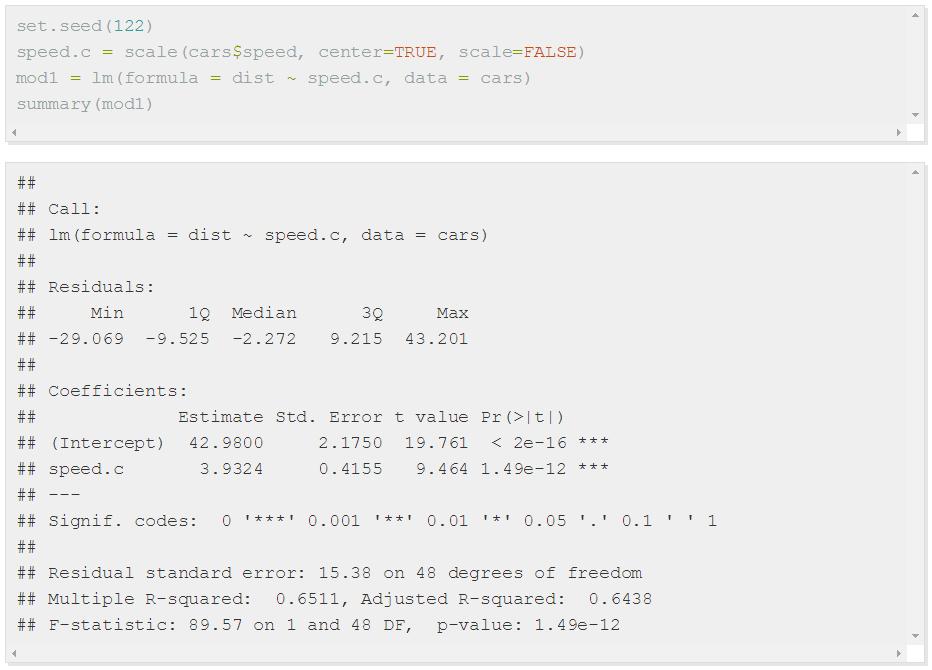
14 R output

15 Multiple Linear Regression When there are more than one explanatory variable Y X X k X k Why include more than one variable in your regression? To avoid omitted variable bias (get the most accurate estimates of ) To get a model that has higher explanatory and predictive power 1
16 Omitted variable bias Example: Effect of 1 more year of education on income of an individual. People who attain higher levels of education may often have parents who have higher incomes Children of high income parents may have access to better social connections and so get better jobs. When we regress income over education and do not include parental income as a variable, we miss this effect. We may assume that higher levels of education led to the children getting higher incomes, and arrive at biased estimates of 1 Children of poorer parents may who are as well educated may not in fact get jobs with high income. In order to test whether it was the education or the parental connections that led to higher incomes, we need to include both variables in the model More accurate estimates of the correlation between the independent variable (education) and the dependent variable (income) Thus the 1 will not suffer from omitted variable bias
17 OLS assumptions Assumption 1: Model is linear in parameters and correctly specified Assumption 2: Full Rank of Matrix X or in other words (i) # observations > # variables, (ii) no perfect multicollinearity among independent variabls Assumption 3: Explanatory Variables must be exogenous E( e i X ) 0 Assumption 4: Independent and Identically Distributed Error Terms 2 i iid(0, ) or in other words (i) observations are randomly selected, (ii) constant variance homoscedasticity (iii) no auto-correlation Assumption 5: Normal Distributed Error Terms in Population If these assumptions are made, the OLS estimators will be the BLUE (Best Linear Unbiased Estimator)
18 Different Kinds of Regression Models Generalized Linear Regression Model Type of Dependent Variable Kind of data Kind of Independent Variables Continuous Linear Regression Discrete Logit / Probit Regression Crosssectional Data Panel Data Panel Data Models 1.Entity Fixed Effects 2.Time Fixed Effects 3.Random Effects Time-series Data Time-series models 1.AR 2.MA 3.ARIMA 4.VAR 5.VECM 6.ARCH 7.GARCH Duration Data Survival analysis models 1.Cox Proportional Hazard 2.Accelerated Failure Time (AFT) models Exogenous Endogenous Instrumental Variables Regression Simultaneous Equation Models
19 Panel Data Models Panel data consists of observations on the same n entities at two or more time period, T. Example: Road accidents for all states of India recorded over 20 years Notation for panel data: (X it, Y it ) where i = 1,...,n and t = 1,...,T Balanced panel Variables are observed for each entity for all the time periods. Unbalanced panel if data is missing for one or more time period for some entities Fixed Effects Regression: controls for omitted variable bias when the omitted variables vary across entities but do not change over time. Y it = β 1 X 1,it + + β k X k,it + α i + u it Time Fixed Effects controls for omitted variable bias when the omitted variables vary over time but are constant across entities Y it = β 1 X 1,it + + β k X k,it + λ t + u it

20 Discrete Dependent Variables (Logit/ Probit) Dependent variable is not continuous but discrete Example: Will a particular individual pass an exam? Dependent variable is coded as 1 when the individual passes and 0 when the individual fails We define the dependent variable as the probability of the individual passing the exam P( Y 1 X,..., X k ) f ( 0 1X1 2X 2... X 1 k k )
21 Logit vs. Probit Logistic Regression where: Pr (Y = 1 X) = F(β 0 + β 1 X 1 ) 1 F(β 0 + β 1 X) = 1 + e (β 0+β 1 X) Probit Regression Pr (Y = 1 X) = Φ(β 0 + β 1 X) Measures of Fit for Logit and Probit The fraction correctly predicted = fraction of Y s for which the predicted probability is >50% when Y i =1, or is <50% when Yi=0. The pseudo-r 2 measures the improvement in the value of the log likelihood, relative to having no X s. The pseudo-r 2 simplifies to the R 2 in the linear model with normally distributed errors.
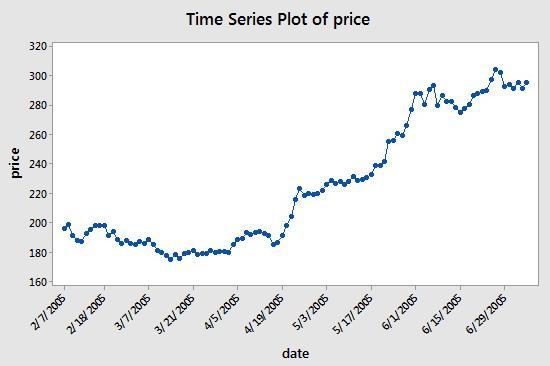
22 Time-series models Data recorded at regular intervals of time, like daily, weekly, monthly or annually Example: Want to predict price of stocks based on historical data Primary objective prediction not understanding causality Components of time-series: Trends Seasonal Movements. Cyclical Movements. Irregular Fluctuations. Dependent variable regressed on lagged values of same variable, autocorrelation Need to ensure stationarity of data i.e. the future will be like the past Stationarity q t q t t p t p t t t x x x y y y y
23
24 Time-series Models AR models Autoregressive model model based on lagged values of the same dependent variable hence auto -regressive MA models Moving average model smoothing past data ARIMA Autoregressive Integrated Moving Average model combining AR and MA components after differencing the data to make it stationary VAR Vector Autoregressive Model -Vector Auto Regressive models (VAR) are econometric models used to capture the linear interdependencies among multiple time series. VECM Vector Error Correction Model - If the variables are not covariance stationary, but their first differences are, they may be modeled with a vector error correction model, or VECM. ARCH - ARCH models are used to model financial time series with time-varying volatility, such as stock prices. GARCH - If an autoregressive moving average model (ARMA model) is assumed for the error variance, the model is a generalized autoregressive conditional heteroscedasticity (GARCH) model.
Econometrics Honor s Exam Review Session. Spring 2012 Eunice Han
 Econometrics Honor s Exam Review Session Spring 2012 Eunice Han Topics 1. OLS The Assumptions Omitted Variable Bias Conditional Mean Independence Hypothesis Testing and Confidence Intervals Homoskedasticity
Introduction to Econometrics
 Introduction to Econometrics T H I R D E D I T I O N Global Edition James H. Stock Harvard University Mark W. Watson Princeton University Boston Columbus Indianapolis New York San Francisco Upper Saddle
A Guide to Modern Econometric:
 A Guide to Modern Econometric: 4th edition Marno Verbeek Rotterdam School of Management, Erasmus University, Rotterdam B 379887 )WILEY A John Wiley & Sons, Ltd., Publication Contents Preface xiii 1 Introduction
ECONOMETRICS HONOR S EXAM REVIEW SESSION
 ECONOMETRICS HONOR S EXAM REVIEW SESSION Eunice Han ehan@fas.harvard.edu March 26 th, 2013 Harvard University Information 2 Exam: April 3 rd 3-6pm @ Emerson 105 Bring a calculator and extra pens. Notes
WISE MA/PhD Programs Econometrics Instructor: Brett Graham Spring Semester, Academic Year Exam Version: A
 WISE MA/PhD Programs Econometrics Instructor: Brett Graham Spring Semester, 2015-16 Academic Year Exam Version: A INSTRUCTIONS TO STUDENTS 1 The time allowed for this examination paper is 2 hours. 2 This
G. S. Maddala Kajal Lahiri. WILEY A John Wiley and Sons, Ltd., Publication
 G. S. Maddala Kajal Lahiri WILEY A John Wiley and Sons, Ltd., Publication TEMT Foreword Preface to the Fourth Edition xvii xix Part I Introduction and the Linear Regression Model 1 CHAPTER 1 What is Econometrics?
Christopher Dougherty London School of Economics and Political Science
 Introduction to Econometrics FIFTH EDITION Christopher Dougherty London School of Economics and Political Science OXFORD UNIVERSITY PRESS Contents INTRODU CTION 1 Why study econometrics? 1 Aim of this
WISE International Masters
 WISE International Masters ECONOMETRICS Instructor: Brett Graham INSTRUCTIONS TO STUDENTS 1 The time allowed for this examination paper is 2 hours. 2 This examination paper contains 32 questions. You are
9) Time series econometrics
 Time series econometrics") 30C00200 Econometrics 9) Time series econometrics Timo Kuosmanen Professor Management Science http://nomepre.net/index.php/timokuosmanen 1 Macroeconomic data: GDP Inflation rate Examples of time series
30C00200 Econometrics 9) Time series econometrics Timo Kuosmanen Professor Management Science http://nomepre.net/index.php/timokuosmanen 1 Macroeconomic data: GDP Inflation rate Examples of time series
Outline. Nature of the Problem. Nature of the Problem. Basic Econometrics in Transportation. Autocorrelation
 1/30 Outline Basic Econometrics in Transportation Autocorrelation Amir Samimi What is the nature of autocorrelation? What are the theoretical and practical consequences of autocorrelation? Since the assumption
Multiple Regression Analysis
 1 OUTLINE Basic Concept: Multiple Regression MULTICOLLINEARITY AUTOCORRELATION HETEROSCEDASTICITY REASEARCH IN FINANCE 2 BASIC CONCEPTS: Multiple Regression Y i = β 1 + β 2 X 1i + β 3 X 2i + β 4 X 3i +
Regression Analysis. BUS 735: Business Decision Making and Research. Learn how to detect relationships between ordinal and categorical variables.
 Regression Analysis BUS 735: Business Decision Making and Research 1 Goals of this section Specific goals Learn how to detect relationships between ordinal and categorical variables. Learn how to estimate
ECON Introductory Econometrics. Lecture 11: Binary dependent variables
 ECON4150 - Introductory Econometrics Lecture 11: Binary dependent variables Monique de Haan (moniqued@econ.uio.no) Stock and Watson Chapter 11 Lecture Outline 2 The linear probability model Nonlinear probability
Ref.: Spring SOS3003 Applied data analysis for social science Lecture note
 SOS3003 Applied data analysis for social science Lecture note 05-2010 Erling Berge Department of sociology and political science NTNU Spring 2010 Erling Berge 2010 1 Literature Regression criticism I Hamilton
Econ 423 Lecture Notes: Additional Topics in Time Series 1
 Econ 423 Lecture Notes: Additional Topics in Time Series 1 John C. Chao April 25, 2017 1 These notes are based in large part on Chapter 16 of Stock and Watson (2011). They are for instructional purposes
Econometrics. 9) Heteroscedasticity and autocorrelation
 Heteroscedasticity and autocorrelation") 30C00200 Econometrics 9) Heteroscedasticity and autocorrelation Timo Kuosmanen Professor, Ph.D. http://nomepre.net/index.php/timokuosmanen Today s topics Heteroscedasticity Possible causes Testing for
30C00200 Econometrics 9) Heteroscedasticity and autocorrelation Timo Kuosmanen Professor, Ph.D. http://nomepre.net/index.php/timokuosmanen Today s topics Heteroscedasticity Possible causes Testing for
Econometrics Summary Algebraic and Statistical Preliminaries
 Econometrics Summary Algebraic and Statistical Preliminaries Elasticity: The point elasticity of Y with respect to L is given by α = ( Y/ L)/(Y/L). The arc elasticity is given by ( Y/ L)/(Y/L), when L
388 Index Differencing test ,232 Distributed lags , 147 arithmetic lag.
 INDEX Aggregation... 104 Almon lag... 135-140,149 AR(1) process... 114-130,240,246,324-325,366,370,374 ARCH... 376-379 ARlMA... 365 Asymptotically unbiased... 13,50 Autocorrelation... 113-130, 142-150,324-325,365-369
Econometrics. Week 4. Fall Institute of Economic Studies Faculty of Social Sciences Charles University in Prague
 Econometrics Week 4 Institute of Economic Studies Faculty of Social Sciences Charles University in Prague Fall 2012 1 / 23 Recommended Reading For the today Serial correlation and heteroskedasticity in
Econ 300/QAC 201: Quantitative Methods in Economics/Applied Data Analysis. 17th Class 7/1/10
 Econ 300/QAC 201: Quantitative Methods in Economics/Applied Data Analysis 17th Class 7/1/10 The only function of economic forecasting is to make astrology look respectable. --John Kenneth Galbraith show
ECON3327: Financial Econometrics, Spring 2016
 ECON3327: Financial Econometrics, Spring 2016 Wooldridge, Introductory Econometrics (5th ed, 2012) Chapter 11: OLS with time series data Stationary and weakly dependent time series The notion of a stationary
REED TUTORIALS (Pty) LTD ECS3706 EXAM PACK
 LTD ECS3706 EXAM PACK") REED TUTORIALS (Pty) LTD ECS3706 EXAM PACK 1 ECONOMETRICS STUDY PACK MAY/JUNE 2016 Question 1 (a) (i) Describing economic reality (ii) Testing hypothesis about economic theory (iii) Forecasting future
REED TUTORIALS (Pty) LTD ECS3706 EXAM PACK 1 ECONOMETRICS STUDY PACK MAY/JUNE 2016 Question 1 (a) (i) Describing economic reality (ii) Testing hypothesis about economic theory (iii) Forecasting future
Økonomisk Kandidateksamen 2005(I) Econometrics 2 January 20, 2005
 Econometrics 2 January 20, 2005") Økonomisk Kandidateksamen 2005(I) Econometrics 2 January 20, 2005 This is a four hours closed-book exam (uden hjælpemidler). Answer all questions! The questions 1 to 4 have equal weight. Within each question,
Økonomisk Kandidateksamen 2005(I) Econometrics 2 January 20, 2005 This is a four hours closed-book exam (uden hjælpemidler). Answer all questions! The questions 1 to 4 have equal weight. Within each question,
 STOCKHOLM UNIVERSITY Department of Economics Course name: Empirical Methods Course code: EC40 Examiner: Lena Nekby Number of credits: 7,5 credits Date of exam: Saturday, May 9, 008 Examination time: 3
Multiple Regression Analysis
 1 OUTLINE Analysis of Data and Model Hypothesis Testing Dummy Variables Research in Finance 2 ANALYSIS: Types of Data Time Series data Cross-Sectional data Panel data Trend Seasonal Variation Cyclical
2 Prediction and Analysis of Variance
 2 Prediction and Analysis of Variance Reading: Chapters and 2 of Kennedy A Guide to Econometrics Achen, Christopher H. Interpreting and Using Regression (London: Sage, 982). Chapter 4 of Andy Field, Discovering
Modeling and forecasting global mean temperature time series
 Modeling and forecasting global mean temperature time series April 22, 2018 Abstract: An ARIMA time series model was developed to analyze the yearly records of the change in global annual mean surface
FinQuiz Notes
 Reading 9 A time series is any series of data that varies over time e.g. the quarterly sales for a company during the past five years or daily returns of a security. When assumptions of the regression
Empirical Market Microstructure Analysis (EMMA)
") Empirical Market Microstructure Analysis (EMMA) Lecture 3: Statistical Building Blocks and Econometric Basics Prof. Dr. Michael Stein michael.stein@vwl.uni-freiburg.de Albert-Ludwigs-University of Freiburg
Empirical Market Microstructure Analysis (EMMA) Lecture 3: Statistical Building Blocks and Econometric Basics Prof. Dr. Michael Stein michael.stein@vwl.uni-freiburg.de Albert-Ludwigs-University of Freiburg
WISE International Masters
 WISE International Masters ECONOMETRICS Instructor: Brett Graham INSTRUCTIONS TO STUDENTS 1 The time allowed for this examination paper is 2 hours. 2 This examination paper contains 32 questions. You are
PhD/MA Econometrics Examination. January, 2015 PART A. (Answer any TWO from Part A)
") PhD/MA Econometrics Examination January, 2015 Total Time: 8 hours MA students are required to answer from A and B. PhD students are required to answer from A, B, and C. PART A (Answer any TWO from Part
PhD/MA Econometrics Examination January, 2015 Total Time: 8 hours MA students are required to answer from A and B. PhD students are required to answer from A, B, and C. PART A (Answer any TWO from Part
Introduction to Eco n o m et rics
 2008 AGI-Information Management Consultants May be used for personal purporses only or by libraries associated to dandelon.com network. Introduction to Eco n o m et rics Third Edition G.S. Maddala Formerly
Glossary. The ISI glossary of statistical terms provides definitions in a number of different languages:
 Glossary The ISI glossary of statistical terms provides definitions in a number of different languages: http://isi.cbs.nl/glossary/index.htm Adjusted r 2 Adjusted R squared measures the proportion of the
Review of Econometrics
 Review of Econometrics Zheng Tian June 5th, 2017 1 The Essence of the OLS Estimation Multiple regression model involves the models as follows Y i = β 0 + β 1 X 1i + β 2 X 2i + + β k X ki + u i, i = 1,...,
Unless provided with information to the contrary, assume for each question below that the Classical Linear Model assumptions hold.
 Economics 345: Applied Econometrics Section A01 University of Victoria Midterm Examination #2 Version 1 SOLUTIONS Spring 2015 Instructor: Martin Farnham Unless provided with information to the contrary,
Økonomisk Kandidateksamen 2004 (I) Econometrics 2. Rettevejledning
 Econometrics 2. Rettevejledning") Økonomisk Kandidateksamen 2004 (I) Econometrics 2 Rettevejledning This is a closed-book exam (uden hjælpemidler). Answer all questions! The group of questions 1 to 4 have equal weight. Within each group,
Økonomisk Kandidateksamen 2004 (I) Econometrics 2 Rettevejledning This is a closed-book exam (uden hjælpemidler). Answer all questions! The group of questions 1 to 4 have equal weight. Within each group,
Environmental Econometrics
 Environmental Econometrics Syngjoo Choi Fall 2008 Environmental Econometrics (GR03) Fall 2008 1 / 37 Syllabus I This is an introductory econometrics course which assumes no prior knowledge on econometrics;
The Simple Linear Regression Model
 The Simple Linear Regression Model Lesson 3 Ryan Safner 1 1 Department of Economics Hood College ECON 480 - Econometrics Fall 2017 Ryan Safner (Hood College) ECON 480 - Lesson 3 Fall 2017 1 / 77 Bivariate
Econometrics Review questions for exam
 Econometrics Review questions for exam Nathaniel Higgins nhiggins@jhu.edu, 1. Suppose you have a model: y = β 0 x 1 + u You propose the model above and then estimate the model using OLS to obtain: ŷ =
Applied Microeconometrics (L5): Panel Data-Basics
: Panel Data-Basics") Applied Microeconometrics (L5): Panel Data-Basics Nicholas Giannakopoulos University of Patras Department of Economics ngias@upatras.gr November 10, 2015 Nicholas Giannakopoulos (UPatras) MSc Applied Economics
Applied Microeconometrics (L5): Panel Data-Basics Nicholas Giannakopoulos University of Patras Department of Economics ngias@upatras.gr November 10, 2015 Nicholas Giannakopoulos (UPatras) MSc Applied Economics
Econometrics Homework 4 Solutions
 Econometrics Homework 4 Solutions Question 1 (a) General sources of problem: measurement error in regressors, omitted variables that are correlated to the regressors, and simultaneous equation (reverse
6. Assessing studies based on multiple regression
 6. Assessing studies based on multiple regression Questions of this section: What makes a study using multiple regression (un)reliable? When does multiple regression provide a useful estimate of the causal
Economics 308: Econometrics Professor Moody
 Economics 308: Econometrics Professor Moody References on reserve: Text Moody, Basic Econometrics with Stata (BES) Pindyck and Rubinfeld, Econometric Models and Economic Forecasts (PR) Wooldridge, Jeffrey
LECTURE 5. Introduction to Econometrics. Hypothesis testing
 LECTURE 5 Introduction to Econometrics Hypothesis testing October 18, 2016 1 / 26 ON TODAY S LECTURE We are going to discuss how hypotheses about coefficients can be tested in regression models We will
ECON 4230 Intermediate Econometric Theory Exam
 ECON 4230 Intermediate Econometric Theory Exam Multiple Choice (20 pts). Circle the best answer. 1. The Classical assumption of mean zero errors is satisfied if the regression model a) is linear in the
Answers to End-of-Chapter Review the Concepts Questions
 Introduction to Econometrics (3 rd Updated Edition) by James H. Stock and Mark W. Watson Answers to End-of-Chapter Review the Concepts Questions (This version July 21, 2014) 1 Chapter 1 1.1 The experiment
Econometrics. Week 8. Fall Institute of Economic Studies Faculty of Social Sciences Charles University in Prague
 Econometrics Week 8 Institute of Economic Studies Faculty of Social Sciences Charles University in Prague Fall 2012 1 / 25 Recommended Reading For the today Instrumental Variables Estimation and Two Stage
Time Series Analysis -- An Introduction -- AMS 586
 Time Series Analysis -- An Introduction -- AMS 586 1 Objectives of time series analysis Data description Data interpretation Modeling Control Prediction & Forecasting 2 Time-Series Data Numerical data
1. Fundamental concepts
 . Fundamental concepts A time series is a sequence of data points, measured typically at successive times spaced at uniform intervals. Time series are used in such fields as statistics, signal processing
Panel Data Models. Chapter 5. Financial Econometrics. Michael Hauser WS17/18 1 / 63
 1 / 63 Panel Data Models Chapter 5 Financial Econometrics Michael Hauser WS17/18 2 / 63 Content Data structures: Times series, cross sectional, panel data, pooled data Static linear panel data models:
6. The econometrics of Financial Markets: Empirical Analysis of Financial Time Series. MA6622, Ernesto Mordecki, CityU, HK, 2006.
 6. The econometrics of Financial Markets: Empirical Analysis of Financial Time Series MA6622, Ernesto Mordecki, CityU, HK, 2006. References for Lecture 5: Quantitative Risk Management. A. McNeil, R. Frey,
Introduction to Econometrics
 Introduction to Econometrics STAT-S-301 Introduction to Time Series Regression and Forecasting (2016/2017) Lecturer: Yves Dominicy Teaching Assistant: Elise Petit 1 Introduction to Time Series Regression
Sample Exam Questions for Econometrics
 Sample Exam Questions for Econometrics 1 a) What is meant by marginalisation and conditioning in the process of model reduction within the dynamic modelling tradition? (30%) b) Having derived a model for
Chapter 11. Regression with a Binary Dependent Variable
 Chapter 11 Regression with a Binary Dependent Variable 2 Regression with a Binary Dependent Variable (SW Chapter 11) So far the dependent variable (Y) has been continuous: district-wide average test score
APPLIED TIME SERIES ECONOMETRICS
 APPLIED TIME SERIES ECONOMETRICS Edited by HELMUT LÜTKEPOHL European University Institute, Florence MARKUS KRÄTZIG Humboldt University, Berlin CAMBRIDGE UNIVERSITY PRESS Contents Preface Notation and Abbreviations
New York University Department of Economics. Applied Statistics and Econometrics G Spring 2013
 New York University Department of Economics Applied Statistics and Econometrics G31.1102 Spring 2013 Text: Econometric Analysis, 7 h Edition, by William Greene (Prentice Hall) Optional: A Guide to Modern
PhD/MA Econometrics Examination January 2012 PART A
 PhD/MA Econometrics Examination January 2012 PART A ANSWER ANY TWO QUESTIONS IN THIS SECTION NOTE: (1) The indicator function has the properties: (2) Question 1 Let, [defined as if using the indicator
Introduction to Econometrics. Regression with Panel Data
 Introduction to Econometrics The statistical analysis of economic (and related) data STATS301 Regression with Panel Data Titulaire: Christopher Bruffaerts Assistant: Lorenzo Ricci 1 Regression with Panel
Lecture-1: Introduction to Econometrics
 Lecture-1: Introduction to Econometrics 1 Definition Econometrics may be defined as 2 the science in which the tools of economic theory, mathematics and statistical inference is applied to the analysis
Linear Regression. Junhui Qian. October 27, 2014
 Linear Regression Junhui Qian October 27, 2014 Outline The Model Estimation Ordinary Least Square Method of Moments Maximum Likelihood Estimation Properties of OLS Estimator Unbiasedness Consistency Efficiency
Applied Economics. Regression with a Binary Dependent Variable. Department of Economics Universidad Carlos III de Madrid
 Applied Economics Regression with a Binary Dependent Variable Department of Economics Universidad Carlos III de Madrid See Stock and Watson (chapter 11) 1 / 28 Binary Dependent Variables: What is Different?
Time Series Analysis. James D. Hamilton PRINCETON UNIVERSITY PRESS PRINCETON, NEW JERSEY
 Time Series Analysis James D. Hamilton PRINCETON UNIVERSITY PRESS PRINCETON, NEW JERSEY & Contents PREFACE xiii 1 1.1. 1.2. Difference Equations First-Order Difference Equations 1 /?th-order Difference
Økonomisk Kandidateksamen 2004 (II) Econometrics 2 June 14, 2004
 Econometrics 2 June 14, 2004") Økonomisk Kandidateksamen 2004 (II) Econometrics 2 June 14, 2004 This is a four hours closed-book exam (uden hjælpemidler). Answer all questions! The questions 1 to 4 have equal weight. Within each question,
Økonomisk Kandidateksamen 2004 (II) Econometrics 2 June 14, 2004 This is a four hours closed-book exam (uden hjælpemidler). Answer all questions! The questions 1 to 4 have equal weight. Within each question,
Analysis. Components of a Time Series
 Module 8: Time Series Analysis 8.2 Components of a Time Series, Detection of Change Points and Trends, Time Series Models Components of a Time Series There can be several things happening simultaneously
2) For a normal distribution, the skewness and kurtosis measures are as follows: A) 1.96 and 4 B) 1 and 2 C) 0 and 3 D) 0 and 0
 For a normal distribution, the skewness and kurtosis measures are as follows: A) 1.96 and 4 B) 1 and 2 C) 0 and 3 D) 0 and 0") Introduction to Econometrics Midterm April 26, 2011 Name Student ID MULTIPLE CHOICE. Choose the one alternative that best completes the statement or answers the question. (5,000 credit for each correct
Introduction to Econometrics Midterm April 26, 2011 Name Student ID MULTIPLE CHOICE. Choose the one alternative that best completes the statement or answers the question. (5,000 credit for each correct
Contest Quiz 3. Question Sheet. In this quiz we will review concepts of linear regression covered in lecture 2.
 Updated: November 17, 2011 Lecturer: Thilo Klein Contact: tk375@cam.ac.uk Contest Quiz 3 Question Sheet In this quiz we will review concepts of linear regression covered in lecture 2. NOTE: Please round
Introduction to Econometrics
 Introduction to Econometrics STAT-S-301 Panel Data (2016/2017) Lecturer: Yves Dominicy Teaching Assistant: Elise Petit 1 Regression with Panel Data A panel dataset contains observations on multiple entities
Answer all questions from part I. Answer two question from part II.a, and one question from part II.b.
 B203: Quantitative Methods Answer all questions from part I. Answer two question from part II.a, and one question from part II.b. Part I: Compulsory Questions. Answer all questions. Each question carries
Metrics Honors Review
 Metrics Honors Review petertu@fas.harvard.edu Harvard University Department of Economics 26 March 2015 : Logistics Exam Date: Wednesday, April 8 from 3-6pm in Sever Hall 113 The exam covers material from
Final Exam. Name: Solution:
 Final Exam. Name: Instructions. Answer all questions on the exam. Open books, open notes, but no electronic devices. The first 13 problems are worth 5 points each. The rest are worth 1 point each. HW1.
at least 50 and preferably 100 observations should be available to build a proper model
 III Box-Jenkins Methods 1. Pros and Cons of ARIMA Forecasting a) need for data at least 50 and preferably 100 observations should be available to build a proper model used most frequently for hourly or
Multiple Regression. Peerapat Wongchaiwat, Ph.D.
 Peerapat Wongchaiwat, Ph.D. wongchaiwat@hotmail.com The Multiple Regression Model Examine the linear relationship between 1 dependent (Y) & 2 or more independent variables (X i ) Multiple Regression Model
Econometric Analysis of Cross Section and Panel Data
 Econometric Analysis of Cross Section and Panel Data Jeffrey M. Wooldridge / The MIT Press Cambridge, Massachusetts London, England Contents Preface Acknowledgments xvii xxiii I INTRODUCTION AND BACKGROUND
Making sense of Econometrics: Basics
 Making sense of Econometrics: Basics Lecture 4: Qualitative influences and Heteroskedasticity Egypt Scholars Economic Society November 1, 2014 Assignment & feedback enter classroom at http://b.socrative.com/login/student/
10. Time series regression and forecasting
 10. Time series regression and forecasting Key feature of this section: Analysis of data on a single entity observed at multiple points in time (time series data) Typical research questions: What is the
The Prediction of Monthly Inflation Rate in Romania 1
 Economic Insights Trends and Challenges Vol.III (LXVI) No. 2/2014 75-84 The Prediction of Monthly Inflation Rate in Romania 1 Mihaela Simionescu Institute for Economic Forecasting of the Romanian Academy,
Basic econometrics. Tutorial 3. Dipl.Kfm. Johannes Metzler
 Basic econometrics Tutorial 3 Dipl.Kfm. Introduction Some of you were asking about material to revise/prepare econometrics fundamentals. First of all, be aware that I will not be too technical, only as
Econometrics of Panel Data
 Econometrics of Panel Data Jakub Mućk Meeting # 6 Jakub Mućk Econometrics of Panel Data Meeting # 6 1 / 36 Outline 1 The First-Difference (FD) estimator 2 Dynamic panel data models 3 The Anderson and Hsiao
M(t) = 1 t. (1 t), 6 M (0) = 20 P (95. X i 110) i=1
 = 1 t. (1 t), 6 M (0) = 20 P (95. X i 110) i=1") Math 66/566 - Midterm Solutions NOTE: These solutions are for both the 66 and 566 exam. The problems are the same until questions and 5. 1. The moment generating function of a random variable X is M(t)
Math 66/566 - Midterm Solutions NOTE: These solutions are for both the 66 and 566 exam. The problems are the same until questions and 5. 1. The moment generating function of a random variable X is M(t)
Chapter 1 Introduction. What are longitudinal and panel data? Benefits and drawbacks of longitudinal data Longitudinal data models Historical notes
 Chapter 1 Introduction What are longitudinal and panel data? Benefits and drawbacks of longitudinal data Longitudinal data models Historical notes 1.1 What are longitudinal and panel data? With regression
Simultaneous Equation Models Learning Objectives Introduction Introduction (2) Introduction (3) Solving the Model structural equations
 Introduction (3) Solving the Model structural equations") Simultaneous Equation Models. Introduction: basic definitions 2. Consequences of ignoring simultaneity 3. The identification problem 4. Estimation of simultaneous equation models 5. Example: IS LM model
Simultaneous Equation Models. Introduction: basic definitions 2. Consequences of ignoring simultaneity 3. The identification problem 4. Estimation of simultaneous equation models 5. Example: IS LM model
Microeconometrics. Bernd Süssmuth. IEW Institute for Empirical Research in Economics. University of Leipzig. April 4, 2011
 Microeconometrics Bernd Süssmuth IEW Institute for Empirical Research in Economics University of Leipzig April 4, 2011 Bernd Süssmuth (University of Leipzig) Microeconometrics April 4, 2011 1 / 22 Organizational
LECTURE 10. Introduction to Econometrics. Multicollinearity & Heteroskedasticity
 LECTURE 10 Introduction to Econometrics Multicollinearity & Heteroskedasticity November 22, 2016 1 / 23 ON PREVIOUS LECTURES We discussed the specification of a regression equation Specification consists
Covers Chapter 10-12, some of 16, some of 18 in Wooldridge. Regression Analysis with Time Series Data
 Covers Chapter 10-12, some of 16, some of 18 in Wooldridge Regression Analysis with Time Series Data Obviously time series data different from cross section in terms of source of variation in x and y temporal
Final Exam - Solutions
 Ecn 102 - Analysis of Economic Data University of California - Davis March 19, 2010 Instructor: John Parman Final Exam - Solutions You have until 5:30pm to complete this exam. Please remember to put your
Lecture 1. Behavioral Models Multinomial Logit: Power and limitations. Cinzia Cirillo
 Lecture 1 Behavioral Models Multinomial Logit: Power and limitations Cinzia Cirillo 1 Overview 1. Choice Probabilities 2. Power and Limitations of Logit 1. Taste variation 2. Substitution patterns 3. Repeated
CHAPTER 6: SPECIFICATION VARIABLES
 Recall, we had the following six assumptions required for the Gauss-Markov Theorem: 1. The regression model is linear, correctly specified, and has an additive error term. 2. The error term has a zero
ECONOMETRICS FIELD EXAM Michigan State University May 9, 2008
 ECONOMETRICS FIELD EXAM Michigan State University May 9, 2008 Instructions: Answer all four (4) questions. Point totals for each question are given in parenthesis; there are 00 points possible. Within
Final Review ECON Sebastian James. (Slides prepared by Bo Jackson and Hanley Chiang)
") Final Review ECON 1123 Sebastian James (Slides prepared by Bo Jackson and Hanley Chiang) I. The Big Picture For much of this course, our aim has been to estimate the causal effect of X on Y - Causal effect:
Final Review ECON 1123 Sebastian James (Slides prepared by Bo Jackson and Hanley Chiang) I. The Big Picture For much of this course, our aim has been to estimate the causal effect of X on Y - Causal effect:
Statistics 910, #5 1. Regression Methods
 Statistics 910, #5 1 Overview Regression Methods 1. Idea: effects of dependence 2. Examples of estimation (in R) 3. Review of regression 4. Comparisons and relative efficiencies Idea Decomposition Well-known
Binary Dependent Variable. Regression with a
 Beykent University Faculty of Business and Economics Department of Economics Econometrics II Yrd.Doç.Dr. Özgür Ömer Ersin Regression with a Binary Dependent Variable (SW Chapter 11) SW Ch. 11 1/59 Regression
ISQS 5349 Spring 2013 Final Exam
 ISQS 5349 Spring 2013 Final Exam Name: General Instructions: Closed books, notes, no electronic devices. Points (out of 200) are in parentheses. Put written answers on separate paper; multiple choices
Econometrics -- Final Exam (Sample)
") Econometrics -- Final Exam (Sample) 1) The sample regression line estimated by OLS A) has an intercept that is equal to zero. B) is the same as the population regression line. C) cannot have negative and
Econometrics -- Final Exam (Sample) 1) The sample regression line estimated by OLS A) has an intercept that is equal to zero. B) is the same as the population regression line. C) cannot have negative and
Time Series and Forecasting
 Time Series and Forecasting Introduction to Forecasting n What is forecasting? n Primary Function is to Predict the Future using (time series related or other) data we have in hand n Why are we interested?
Limited Dependent Variables and Panel Data
 and Panel Data June 24 th, 2009 Structure 1 2 Many economic questions involve the explanation of binary variables, e.g.: explaining the participation of women in the labor market explaining retirement
FINANCIAL ECONOMETRICS AND EMPIRICAL FINANCE -MODULE2 Midterm Exam Solutions - March 2015
 FINANCIAL ECONOMETRICS AND EMPIRICAL FINANCE -MODULE2 Midterm Exam Solutions - March 205 Time Allowed: 60 minutes Family Name (Surname) First Name Student Number (Matr.) Please answer all questions by
Bootstrapping the Grainger Causality Test With Integrated Data
 Bootstrapping the Grainger Causality Test With Integrated Data Richard Ti n University of Reading July 26, 2006 Abstract A Monte-carlo experiment is conducted to investigate the small sample performance
Time Series Analysis. James D. Hamilton PRINCETON UNIVERSITY PRESS PRINCETON, NEW JERSEY
 Time Series Analysis James D. Hamilton PRINCETON UNIVERSITY PRESS PRINCETON, NEW JERSEY PREFACE xiii 1 Difference Equations 1.1. First-Order Difference Equations 1 1.2. pth-order Difference Equations 7
LECTURE 11. Introduction to Econometrics. Autocorrelation
 LECTURE 11 Introduction to Econometrics Autocorrelation November 29, 2016 1 / 24 ON PREVIOUS LECTURES We discussed the specification of a regression equation Specification consists of choosing: 1. correct
Contents. Part I Statistical Background and Basic Data Handling 5. List of Figures List of Tables xix
 Contents List of Figures List of Tables xix Preface Acknowledgements 1 Introduction 1 What is econometrics? 2 The stages of applied econometric work 2 Part I Statistical Background and Basic Data Handling