Spatial Data Mining. Regression and Classification Techniques
|
|
|
- Camron Douglas
- 6 years ago
- Views:
Transcription


1 Spatial Data Mining Regression and Classification Techniques 1
 measured at locations (2D for geographic applications) Build a model for predicting the measured quantity")
2 Spatial Regression and Classisfication Discrete class labels (left) vs. continues quantities (right) measured at locations (2D for geographic applications) Build a model for predicting the measured quantity at any location Additional (to spatial) attributes may exist 2


3 Geostatistics Analysis and inference of continuously-distributed variables Analysis: Describing the spatial variability of the phenomenon under study Inference: Estimating the unknown values Questions on measurements: How are they distributed? How are they related to each other? How can I infer a distribution from one sample? Water Availabilty Index Estimated Surface Estimated Uncertainty 3
, x the location vector and w the measurement If not just noise, then continuity creates smoothness of w values that can be modeled by f(x,w) Can")
4 Spatial continuity and stationarity Why prediction is possible? Continuity: Spatial close measurements are more similar than distant ones What does it mean? Model the underlying phenomenon with the model f(x,w), x the location vector and w the measurement If not just noise, then continuity creates smoothness of w values that can be modeled by f(x,w) Can all locations be modeled by a single f(x,w)? Stationarity: Measurements generated by a single distribution at all locations 4
5 Spatial Autocorrelation Continuity produces autocorrelation: correlation of a variable with itself through space First law of geography: everything is related to everything else, but near things are more related than distant things Waldo Tobler 3 possible cases: If nearby or neighboring areas are more alike, this is positive spatial autocorrelation Negative autocorrelation describes patterns in which neighboring areas are unlike Random patterns exhibit no spatial autocorrelation
6 Why to bother about spatial autocorrelation? Most statistics/data mining methods are based on the assumption that the values of observations in each sample are independent of one another Positive spatial autocorrelation may violate this, if the samples were taken from nearby areas Spatial Autocorrelation is a kind of redundancy: the measurement at a location constrains, or makes more probable, the measurement in a neighboring location Models will be biased, since measurements tend to be concentrated and there are actually fewer number of independent observations than are being assumed 6
7 Measures of autocorrelation Objectives: Measure the strength of spatial autocorrelation Test the assumption of independence or randomness Measures Moran s I Variograms other (Geary s C, Ripley s K) 7
8 Moran s I: A measure of spatial autocorrelation Compares the value of the variable at any one location with the value at all other locations Similar to correlation coefficient, it varies between 1.0 and When autocorrelation is high, the coefficient is high A high I value indicates positive autocorrelation 8
9 Symbols and Contiguity matrix N is the number of cases X i is the variable value at location i X j is the variable value at location j \bar{x} is the mean of the variable W ij is a weight applied to the comparison between location i and location j W ij is a contiguity matrix If location j is adjacent to zone i, the interaction receives a weight of 1 Another option is to make W ij a distance-based weight which is the inverse distance between locations I and j (1/d ij ) 9

10 Example: Per Capita Income in Monroe County Actual values: Moran s I: 0.66 Random values: Moran s I:
11 Local Moran s I Following Anselin s (1995) definition, a local Moran s I i may be defined as: I i = z s i 2 j w z i s are the deviations from the mean of y i s ij z j, i j I [ ] = = 11
12 Global vs. Local Moran s I: example Spatial pattern detection in China s provincial development The variable used: per capita GDP Dynamic patterns global Moran s I Specific local spatial process local Moran s I and the Moran s scatterplot 12
13 China: per capita GDP in 1978 Western Region Central Region Eastern Region Yuan ,000 Miles ,000 2,000 Kilometers
14 China: per capita GDP in 2000 Western Region Central Region Eastern Region Yuan ,000 Miles ,000 2,000 Kilometers
15 Global vs. Local Moran s I: example There is a clustering trend in China s provincial level development (represented by per capita GDP But the global Moran s I can t tell on which side does the clustering trend take place Global Moran's I Year 15
16 Local Moran s I in 1978 Western Region Central Region Eastern Region ,000 Miles Local Moran's I < ,000 2,000 Kilometers >
17 Local Moran s I in 2000 Western Region Central Region Eastern Region ,000 Miles Local Moran's I ,000 2,000 Kilometers >
18 More details to the Chine GDP example First, China s coast-interior divide persisted Interior provinces exhibit great geographical similarity in economic development and spatial contributions to the global Moran s I Second, the municipalities (Beijing, Tianjin, Shanghai) always contribute the most Shanghai s position is worth noting, it development changed the spatial pattern the most Third, Guangdong s contribution to the global index corresponds with its changing spatial behavior depicted in the Moran scatterplot Fourth, while most of the interior provinces have similar patterns, coastal provinces vary greatly Fifth, Shandong fell into the low-low quadrant, and contributed very little to the global index Sixth, Guizhou and Yunnan, two provinces in southwest China, contributed relatively highly to the global index in 2000 The poorest ones tend to form a poor cluster 18
19 Variograms Analyse the observed variation in data values by distance bands using a spatial autocorrelation-like measure, γ: Semivariance measure is most often used: d = h+δ/2 ij 1 ˆ( γ h) = ( zi zj) 2 Nh ( ) d ij = h Δ/2 2 Bands have width Δ. N(h) is the number of pairs in the band with mid-point distance h After building an experimental variogram, we need to fit a theoretical function in order to model the spatial variation 19
 Range, A 0 model C 0 Nugget Lag (distance")
20 Variograms Smallest observed separation Fitted curve sill Average semivariance for band 4 C 1 =C 0 +C (structural variance) Range, A 0 model C 0 Nugget Lag (distance band) 20
21 Variograms Model Formula (Theoretical Fit) Notes Nugget effect Linear Exponential Exp() γ( 0) = C 0 γ( h) = C1 ( h) γ( h) = C1 1 kh ( e ) Simple constant. May be added to all models. Models with a nugget will not be exact No sill. Often used in combination with other functions. May be used as a ramp, with a constant sill value set at a range, a k is a constant, often k=1 or k=3. Useful when there is a larger nugget and slow rise to the sill Spherical Sph() γ ( h) γ ( h) = = C C 1 1 3h 2, h h 3, h < 1 Useful when the nugget effect is important but small. Given as the default model in some packages. 21
22 Approaches to spatial prediction Value of the variable is predicted from nearby samples Example: concentrations of soil constituents (e.g. salts, pollutants) Example: vegetation density Each interpolator has its own assumptions: Nearest neighbor and variations: Average within a radius Average of n nearest neighbors Distance-weighted average within a radius Distance-weighted average of n nearest neighbours Optimal weighting -> Kriging 22


23 Nearest Neighbor Methods k-nn Classification: assign the class label of the majority of the k-nn k-nn Regression: assign the mean value of the k-nn 1-NN: Voronoi Diagram A common weighting scheme is to give each neighbor a weight of 1/d, where d is the distance to the neighbor 23
24 Nearest Neighbor Methods Pros: Simple, no training (lazy) Benchmark: E1-NN <= 2 EB Often as good as more sophisticated methods Per-se considerations of autocorrelation Cons: Slow classification (lazy) Prone to noise High-variance Need to determine k Cross validation Need to determine weights (for variations) 24
25 Nearest Neighbor Methods When no spatial autocorrelation (random data): CV (LOO) error is maximized for 1-NN: 25 ( ) ( ) ( ) ) ( ) ( ) ( ) ( 2 1, , Z Var Var N Z Z N E X Z X X f Z N j NN j j N j NN j j = + = = = ε ε ε ε ε


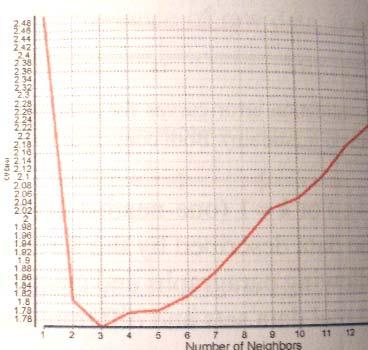
26 Nearest Neighbor Methods Random data No minimum occurs Spatial autocorrelation Minimum occurs 26


 f ( xn) + k n=")
")
27 Nearest Neighbor Methods Bias-Variance decomposition: original k=3 Err k σ x0 ) = σ ε + f ( x0) f ( xn) + k n= 1 k ( ε 2 Bias 2 Variance k=1 (hi var) k=30 (hi bias) 27
28 Optimal Weighting : Kriging Characteristics of optimality : Prediction is made as a linear combination of known data values (a weighted average) Points closer to the point to be predicted have larger weight Prediction is unbiased and exact at known points Error estimate is based only on the sample configuration, not the data values Prediction error should be as small as possible Why optimal and not optimal? optimal with respect to the chosen model! 28
29 Overview of Kriging 1. Sample, preferably at different resolutions 2. Calculate the experimental variogram 3. Model the variogram with one or more authorized functions 4. Apply the kriging system, with the variogram model of spatial dependence, at each point to be predicted Predictions are often at each point on a regular grid (e.g. a raster map) 5. Calculate the error of each prediction; this is based only on the sample point locations, no their data values. 29
30 Ordinary Kriging (OK) In OK, we model the value of variable z at location s i as the sum of a regional mean m and a spatially-correlated random component e(s i ): Z (s i ) = m +e (s i ) The regional mean m is estimated from the sample, but not as the simple average, because there is spatial dependence It is implicit in the OK system 30
31 Ordinary Kriging: Solution 31

32 Kriging usage Supported by many GIS tats/labs/arcwizzard/wizzard_demo.shtml But be aware of polemics between classic statistics vs. geostatistics spatial dependence may be assumed or be verified? Kriging in scandal: Spatial dependence between borehole grades or blasthole grades was assumed at Bre-X's Busang property More details: _climate_change.2c_mineral_exploration.2c_and_ mining 32
Lecture 5 Geostatistics
 Lecture 5 Geostatistics Lecture Outline Spatial Estimation Spatial Interpolation Spatial Prediction Sampling Spatial Interpolation Methods Spatial Prediction Methods Interpolating Raster Surfaces with
Interpolating Raster Surfaces
 Interpolating Raster Surfaces You can use interpolation to model the surface of a feature or a phenomenon all you need are sample points, an interpolation method, and an understanding of the feature or
Types of spatial data. The Nature of Geographic Data. Types of spatial data. Spatial Autocorrelation. Continuous spatial data: geostatistics
 The Nature of Geographic Data Types of spatial data Continuous spatial data: geostatistics Samples may be taken at intervals, but the spatial process is continuous e.g. soil quality Discrete data Irregular:
ENGRG Introduction to GIS
 ENGRG 59910 Introduction to GIS Michael Piasecki October 13, 2017 Lecture 06: Spatial Analysis Outline Today Concepts What is spatial interpolation Why is necessary Sample of interpolation (size and pattern)
An Introduction to Spatial Autocorrelation and Kriging
 An Introduction to Spatial Autocorrelation and Kriging Matt Robinson and Sebastian Dietrich RenR 690 Spring 2016 Tobler and Spatial Relationships Tobler s 1 st Law of Geography: Everything is related to
Nature of Spatial Data. Outline. Spatial Is Special
 Nature of Spatial Data Outline Spatial is special Bad news: the pitfalls of spatial data Good news: the potentials of spatial data Spatial Is Special Are spatial data special? Why spatial data require
Lecture 8. Spatial Estimation
 Lecture 8 Spatial Estimation Lecture Outline Spatial Estimation Spatial Interpolation Spatial Prediction Sampling Spatial Interpolation Methods Spatial Prediction Methods Interpolating Raster Surfaces
I don t have much to say here: data are often sampled this way but we more typically model them in continuous space, or on a graph
 Spatial analysis Huge topic! Key references Diggle (point patterns); Cressie (everything); Diggle and Ribeiro (geostatistics); Dormann et al (GLMMs for species presence/abundance); Haining; (Pinheiro and
Spatial analysis. Spatial descriptive analysis. Spatial inferential analysis:
 Spatial analysis Spatial descriptive analysis Point pattern analysis (minimum bounding box, mean center, weighted mean center, standard distance, nearest neighbor analysis) Spatial clustering analysis
Copyright The McGraw-Hill Companies, Inc. Permission required for reproduction or display.
 Chapter 15. SPATIAL INTERPOLATION 15.1 Elements of Spatial Interpolation 15.1.1 Control Points 15.1.2 Type of Spatial Interpolation 15.2 Global Methods 15.2.1 Trend Surface Models Box 15.1 A Worked Example
Types of Spatial Data
 Spatial Data Types of Spatial Data Point pattern Point referenced geostatistical Block referenced Raster / lattice / grid Vector / polygon Point Pattern Data Interested in the location of points, not their
11/8/2018. Spatial Interpolation & Geostatistics. Kriging Step 1
 (Z i Z j ) 2 / 2 (Z i Zj) 2 / 2 Semivariance y 11/8/2018 Spatial Interpolation & Geostatistics Kriging Step 1 Describe spatial variation with Semivariogram Lag Distance between pairs of points Lag Mean
Introduction to Spatial Statistics and Modeling for Regional Analysis
 Introduction to Spatial Statistics and Modeling for Regional Analysis Dr. Xinyue Ye, Assistant Professor Center for Regional Development (Department of Commerce EDA University Center) & School of Earth,
Lecture 3: Exploratory Spatial Data Analysis (ESDA) Prof. Eduardo A. Haddad
 Prof. Eduardo A. Haddad") Lecture 3: Exploratory Spatial Data Analysis (ESDA) Prof. Eduardo A. Haddad Key message Spatial dependence First Law of Geography (Waldo Tobler): Everything is related to everything else, but near things
Lecture 3: Exploratory Spatial Data Analysis (ESDA) Prof. Eduardo A. Haddad Key message Spatial dependence First Law of Geography (Waldo Tobler): Everything is related to everything else, but near things
On dealing with spatially correlated residuals in remote sensing and GIS
 On dealing with spatially correlated residuals in remote sensing and GIS Nicholas A. S. Hamm 1, Peter M. Atkinson and Edward J. Milton 3 School of Geography University of Southampton Southampton SO17 3AT
Luc Anselin Spatial Analysis Laboratory Dept. Agricultural and Consumer Economics University of Illinois, Urbana-Champaign
 GIS and Spatial Analysis Luc Anselin Spatial Analysis Laboratory Dept. Agricultural and Consumer Economics University of Illinois, Urbana-Champaign http://sal.agecon.uiuc.edu Outline GIS and Spatial Analysis
Lecture 3: Exploratory Spatial Data Analysis (ESDA) Prof. Eduardo A. Haddad
 Prof. Eduardo A. Haddad") Lecture 3: Exploratory Spatial Data Analysis (ESDA) Prof. Eduardo A. Haddad Key message Spatial dependence First Law of Geography (Waldo Tobler): Everything is related to everything else, but near things
Lecture 3: Exploratory Spatial Data Analysis (ESDA) Prof. Eduardo A. Haddad Key message Spatial dependence First Law of Geography (Waldo Tobler): Everything is related to everything else, but near things
An Introduction to Pattern Statistics
 An Introduction to Pattern Statistics Nearest Neighbors The CSR hypothesis Clark/Evans and modification Cuzick and Edwards and controls All events k function Weighted k function Comparative k functions
Spatial Interpolation & Geostatistics
 (Z i Z j ) 2 / 2 Spatial Interpolation & Geostatistics Lag Lag Mean Distance between pairs of points 1 y Kriging Step 1 Describe spatial variation with Semivariogram (Z i Z j ) 2 / 2 Point cloud Map 3
SPACE Workshop NSF NCGIA CSISS UCGIS SDSU. Aldstadt, Getis, Jankowski, Rey, Weeks SDSU F. Goodchild, M. Goodchild, Janelle, Rebich UCSB
 SPACE Workshop NSF NCGIA CSISS UCGIS SDSU Aldstadt, Getis, Jankowski, Rey, Weeks SDSU F. Goodchild, M. Goodchild, Janelle, Rebich UCSB August 2-8, 2004 San Diego State University Some Examples of Spatial
Chapter 1. Summer School GEOSTAT 2014, Spatio-Temporal Geostatistics,
 Chapter 1 Summer School GEOSTAT 2014, Geostatistics, 2014-06-19 sum- http://ifgi.de/graeler Institute for Geoinformatics University of Muenster 1.1 Spatial Data From a purely statistical perspective, spatial
Temporal vs. Spatial Data
 Temporal vs. Spatial Data Temporal 1 dimensional Units: day, week, month Lag: t, t-1, t-2 Durbin-Watson Spatial 2-3 dimensional Units: county, mile, region Lag: near neighbor, networks (?) Moran s I Differencing
Spatial Regression. 1. Introduction and Review. Luc Anselin. Copyright 2017 by Luc Anselin, All Rights Reserved
 Spatial Regression 1. Introduction and Review Luc Anselin http://spatial.uchicago.edu matrix algebra basics spatial econometrics - definitions pitfalls of spatial analysis spatial autocorrelation spatial
Introduction to Geostatistics
 Introduction to Geostatistics Abhi Datta 1, Sudipto Banerjee 2 and Andrew O. Finley 3 July 31, 2017 1 Department of Biostatistics, Bloomberg School of Public Health, Johns Hopkins University, Baltimore,
Spatial Analysis 1. Introduction
 Spatial Analysis 1 Introduction Geo-referenced Data (not any data) x, y coordinates (e.g., lat., long.) ------------------------------------------------------ - Table of Data: Obs. # x y Variables -------------------------------------
Michael Harrigan Office hours: Fridays 2:00-4:00pm Holden Hall
 Announcement New Teaching Assistant Michael Harrigan Office hours: Fridays 2:00-4:00pm Holden Hall 209 Email: michael.harrigan@ttu.edu Guofeng Cao, Texas Tech GIST4302/5302, Lecture 2: Review of Map Projection
Spatial Autocorrelation
 Spatial Autocorrelation Luc Anselin http://spatial.uchicago.edu spatial randomness positive and negative spatial autocorrelation spatial autocorrelation statistics spatial weights Spatial Randomness The
Geostatistics: Kriging
 Geostatistics: Kriging 8.10.2015 Konetekniikka 1, Otakaari 4, 150 10-12 Rangsima Sunila, D.Sc. Background What is Geostatitics Concepts Variogram: experimental, theoretical Anisotropy, Isotropy Lag, Sill,
Introduction. Semivariogram Cloud
 Introduction Data: set of n attribute measurements {z(s i ), i = 1,, n}, available at n sample locations {s i, i = 1,, n} Objectives: Slide 1 quantify spatial auto-correlation, or attribute dissimilarity
7 Geostatistics. Figure 7.1 Focus of geostatistics
 7 Geostatistics 7.1 Introduction Geostatistics is the part of statistics that is concerned with geo-referenced data, i.e. data that are linked to spatial coordinates. To describe the spatial variation
A GEOSTATISTICAL APPROACH TO PREDICTING A PHYSICAL VARIABLE THROUGH A CONTINUOUS SURFACE
 Katherine E. Williams University of Denver GEOG3010 Geogrpahic Information Analysis April 28, 2011 A GEOSTATISTICAL APPROACH TO PREDICTING A PHYSICAL VARIABLE THROUGH A CONTINUOUS SURFACE Overview Data
PRODUCING PROBABILITY MAPS TO ASSESS RISK OF EXCEEDING CRITICAL THRESHOLD VALUE OF SOIL EC USING GEOSTATISTICAL APPROACH
 PRODUCING PROBABILITY MAPS TO ASSESS RISK OF EXCEEDING CRITICAL THRESHOLD VALUE OF SOIL EC USING GEOSTATISTICAL APPROACH SURESH TRIPATHI Geostatistical Society of India Assumptions and Geostatistical Variogram
Soil Moisture Modeling using Geostatistical Techniques at the O Neal Ecological Reserve, Idaho
 Final Report: Forecasting Rangeland Condition with GIS in Southeastern Idaho Soil Moisture Modeling using Geostatistical Techniques at the O Neal Ecological Reserve, Idaho Jacob T. Tibbitts, Idaho State
Exploring the World of Ordinary Kriging. Dennis J. J. Walvoort. Wageningen University & Research Center Wageningen, The Netherlands
 Exploring the World of Ordinary Kriging Wageningen University & Research Center Wageningen, The Netherlands July 2004 (version 0.2) What is? What is it about? Potential Users a computer program for exploring
Exploratory Spatial Data Analysis (ESDA)
") Exploratory Spatial Data Analysis (ESDA) VANGHR s method of ESDA follows a typical geospatial framework of selecting variables, exploring spatial patterns, and regression analysis. The primary software
Exploratory Spatial Data Analysis (ESDA) VANGHR s method of ESDA follows a typical geospatial framework of selecting variables, exploring spatial patterns, and regression analysis. The primary software
Kriging Luc Anselin, All Rights Reserved
 Kriging Luc Anselin Spatial Analysis Laboratory Dept. Agricultural and Consumer Economics University of Illinois, Urbana-Champaign http://sal.agecon.uiuc.edu Outline Principles Kriging Models Spatial Interpolation
BAYESIAN MODEL FOR SPATIAL DEPENDANCE AND PREDICTION OF TUBERCULOSIS
 BAYESIAN MODEL FOR SPATIAL DEPENDANCE AND PREDICTION OF TUBERCULOSIS Srinivasan R and Venkatesan P Dept. of Statistics, National Institute for Research Tuberculosis, (Indian Council of Medical Research),
Lab #3 Background Material Quantifying Point and Gradient Patterns
 Lab #3 Background Material Quantifying Point and Gradient Patterns Dispersion metrics Dispersion indices that measure the degree of non-randomness Plot-based metrics Distance-based metrics First-order
KAAF- GE_Notes GIS APPLICATIONS LECTURE 3
 GIS APPLICATIONS LECTURE 3 SPATIAL AUTOCORRELATION. First law of geography: everything is related to everything else, but near things are more related than distant things Waldo Tobler Check who is sitting
Concepts and Applications of Kriging. Eric Krause
 Concepts and Applications of Kriging Eric Krause Sessions of note Tuesday ArcGIS Geostatistical Analyst - An Introduction 8:30-9:45 Room 14 A Concepts and Applications of Kriging 10:15-11:30 Room 15 A
Finding Hot Spots in ArcGIS Online: Minimizing the Subjectivity of Visual Analysis. Nicholas M. Giner Esri Parrish S.
 Finding Hot Spots in ArcGIS Online: Minimizing the Subjectivity of Visual Analysis Nicholas M. Giner Esri Parrish S. Henderson FBI Agenda The subjectivity of maps What is Hot Spot Analysis? Why do Hot
Optimal Interpolation
 Optimal Interpolation Optimal Interpolation and/or kriging consist in determining the BEST LINEAR ESTIMATE in the least square sense for locations xi where you have no measurements: Example 1: Collected
Spatial Data Analysis in Archaeology Anthropology 589b. Kriging Artifact Density Surfaces in ArcGIS
 Spatial Data Analysis in Archaeology Anthropology 589b Fraser D. Neiman University of Virginia 2.19.07 Spring 2007 Kriging Artifact Density Surfaces in ArcGIS 1. The ingredients. -A data file -- in.dbf
Propagation of Errors in Spatial Analysis
 Stephen F. Austin State University SFA ScholarWorks Faculty Presentations Spatial Science 2001 Propagation of Errors in Spatial Analysis Peter P. Siska I-Kuai Hung Arthur Temple College of Forestry and
Spatial Analysis 2. Spatial Autocorrelation
 Spatial Analysis 2 Spatial Autocorrelation Spatial Autocorrelation a relationship between nearby spatial units of the same variable If, for every pair of subareas i and j in the study region, the drawings
Global Spatial Autocorrelation Clustering
 Global Spatial Autocorrelation Clustering Luc Anselin http://spatial.uchicago.edu join count statistics Moran s I Moran scatter plot non-parametric spatial autocorrelation Join Count Statistics Recap -
Spatial Analysis II. Spatial data analysis Spatial analysis and inference
 Spatial Analysis II Spatial data analysis Spatial analysis and inference Roadmap Spatial Analysis I Outline: What is spatial analysis? Spatial Joins Step 1: Analysis of attributes Step 2: Preparing for
SPATIAL-TEMPORAL TECHNIQUES FOR PREDICTION AND COMPRESSION OF SOIL FERTILITY DATA
 SPATIAL-TEMPORAL TECHNIQUES FOR PREDICTION AND COMPRESSION OF SOIL FERTILITY DATA D. Pokrajac Center for Information Science and Technology Temple University Philadelphia, Pennsylvania A. Lazarevic Computer
GIST 4302/5302: Spatial Analysis and Modeling Lecture 2: Review of Map Projections and Intro to Spatial Analysis
 GIST 4302/5302: Spatial Analysis and Modeling Lecture 2: Review of Map Projections and Intro to Spatial Analysis Guofeng Cao http://www.spatial.ttu.edu Department of Geosciences Texas Tech University guofeng.cao@ttu.edu
Spatial Statistics For Real Estate Data 1
 1 Key words: spatial heterogeneity, spatial autocorrelation, spatial statistics, geostatistics, Geographical Information System SUMMARY: The paper presents spatial statistics tools in application to real
The Study of Soil Fertility Spatial Variation Feature Based on GIS and Data Mining *
 The Study of Soil Fertility Spatial Variation Feature Based on GIS and Data Mining * Chunan Li, Guifen Chen **, Guangwei Zeng, and Jiao Ye College of Information and Technology, Jilin Agricultural University,
GIST 4302/5302: Spatial Analysis and Modeling
 GIST 4302/5302: Spatial Analysis and Modeling Lecture 2: Review of Map Projections and Intro to Spatial Analysis Guofeng Cao http://thestarlab.github.io Department of Geosciences Texas Tech University
Transiogram: A spatial relationship measure for categorical data
 International Journal of Geographical Information Science Vol. 20, No. 6, July 2006, 693 699 Technical Note Transiogram: A spatial relationship measure for categorical data WEIDONG LI* Department of Geography,
What s special about spatial data?
 What s special about spatial data? Road map Geographic Information analysis The need to develop spatial thinking Some fundamental geographic concepts (PBCS) What are the effects of space? Spatial autocorrelation
Areal data. Infant mortality, Auckland NZ districts. Number of plant species in 20cm x 20 cm patches of alpine tundra. Wheat yield
 Areal data Reminder about types of data Geostatistical data: Z(s) exists everyhere, varies continuously Can accommodate sudden changes by a model for the mean E.g., soil ph, two soil types with different
Outline ESDA. Exploratory Spatial Data Analysis ESDA. Luc Anselin
 Exploratory Spatial Data Analysis ESDA Luc Anselin University of Illinois, Urbana-Champaign http://www.spacestat.com Outline ESDA Exploring Spatial Patterns Global Spatial Autocorrelation Local Spatial
Performance Analysis of Some Machine Learning Algorithms for Regression Under Varying Spatial Autocorrelation
 Performance Analysis of Some Machine Learning Algorithms for Regression Under Varying Spatial Autocorrelation Sebastian F. Santibanez Urban4M - Humboldt University of Berlin / Department of Geography 135
Influence of parameter estimation uncertainty in Kriging: Part 2 Test and case study applications
 Hydrology and Earth System Influence Sciences, of 5(), parameter 5 3 estimation (1) uncertainty EGS in Kriging: Part Test and case study applications Influence of parameter estimation uncertainty in Kriging:
Spatial analysis of a designed experiment. Uniformity trials. Blocking
 Spatial analysis of a designed experiment RA Fisher s 3 principles of experimental design randomization unbiased estimate of treatment effect replication unbiased estimate of error variance blocking =
CREATION OF DEM BY KRIGING METHOD AND EVALUATION OF THE RESULTS
 CREATION OF DEM BY KRIGING METHOD AND EVALUATION OF THE RESULTS JANA SVOBODOVÁ, PAVEL TUČEK* Jana Svobodová, Pavel Tuček: Creation of DEM by kriging method and evaluation of the results. Geomorphologia
Geostatistics in Hydrology: Kriging interpolation
 Chapter Geostatistics in Hydrology: Kriging interpolation Hydrologic properties, such as rainfall, aquifer characteristics (porosity, hydraulic conductivity, transmissivity, storage coefficient, etc.),
Index. Geostatistics for Environmental Scientists, 2nd Edition R. Webster and M. A. Oliver 2007 John Wiley & Sons, Ltd. ISBN:
 Index Akaike information criterion (AIC) 105, 290 analysis of variance 35, 44, 127 132 angular transformation 22 anisotropy 59, 99 affine or geometric 59, 100 101 anisotropy ratio 101 exploring and displaying
Geog 210C Spring 2011 Lab 6. Geostatistics in ArcMap
 Geog 210C Spring 2011 Lab 6. Geostatistics in ArcMap Overview In this lab you will think critically about the functionality of spatial interpolation, improve your kriging skills, and learn how to use several
Modeling Spatial Relationships Using Regression Analysis. Lauren M. Scott, PhD Lauren Rosenshein Bennett, MS
 Modeling Spatial Relationships Using Regression Analysis Lauren M. Scott, PhD Lauren Rosenshein Bennett, MS Workshop Overview Answering why? questions Introduce regression analysis - What it is and why
Representation of Geographic Data
 GIS 5210 Week 2 The Nature of Spatial Variation Three principles of the nature of spatial variation: proximity effects are key to understanding spatial variation issues of geographic scale and level of
Geostatistical Interpolation: Kriging and the Fukushima Data. Erik Hoel Colligium Ramazzini October 30, 2011
 Geostatistical Interpolation: Kriging and the Fukushima Data Erik Hoel Colligium Ramazzini October 30, 2011 Agenda Basics of geostatistical interpolation Fukushima radiation Database Web site Geoanalytic
Lecture 1: Introduction to Spatial Econometric
 Lecture 1: Introduction to Spatial Econometric Professor: Mauricio Sarrias Universidad Católica del Norte September 7, 2017 1 Introduction to Spatial Econometric Mandatory Reading Why do We Need Spatial
Creating and Managing a W Matrix
 Creating and Managing a W Matrix Carlos Hurtado Department of Economics University of Illinois at Urbana-Champaign hrtdmrt2@illinois.edu Junel 22th, 2016 C. Hurtado (UIUC - Economics) Spatial Econometrics
POPULAR CARTOGRAPHIC AREAL INTERPOLATION METHODS VIEWED FROM A GEOSTATISTICAL PERSPECTIVE
 CO-282 POPULAR CARTOGRAPHIC AREAL INTERPOLATION METHODS VIEWED FROM A GEOSTATISTICAL PERSPECTIVE KYRIAKIDIS P. University of California Santa Barbara, MYTILENE, GREECE ABSTRACT Cartographic areal interpolation
Data Break 8: Kriging the Meuse RiverBIOS 737 Spring 2004 p.1/27
 Data Break 8: Kriging the Meuse River BIOS 737 Spring 2004 Data Break 8: Kriging the Meuse RiverBIOS 737 Spring 2004 p.1/27 Meuse River: Reminder library(gstat) Data included in gstat library. data(meuse)
Lecture 9: Introduction to Kriging
 Lecture 9: Introduction to Kriging Math 586 Beginning remarks Kriging is a commonly used method of interpolation (prediction) for spatial data. The data are a set of observations of some variable(s) of
2/7/2018. Module 4. Spatial Statistics. Point Patterns: Nearest Neighbor. Spatial Statistics. Point Patterns: Nearest Neighbor
 Spatial Statistics Module 4 Geographers are very interested in studying, understanding, and quantifying the patterns we can see on maps Q: What kinds of map patterns can you think of? There are so many
The Nature of Geographic Data
 4 The Nature of Geographic Data OVERVIEW Elaborates on the spatial is special theme Focuses on how phenomena vary across space and the general nature of geographic variation Describes the main principles
Concepts and Applications of Kriging. Eric Krause Konstantin Krivoruchko
 Concepts and Applications of Kriging Eric Krause Konstantin Krivoruchko Outline Introduction to interpolation Exploratory spatial data analysis (ESDA) Using the Geostatistical Wizard Validating interpolation
Spatial and Environmental Statistics
 Spatial and Environmental Statistics Dale Zimmerman Department of Statistics and Actuarial Science University of Iowa January 17, 2019 Dale Zimmerman (UIOWA) Spatial and Environmental Statistics January
Comparison of rainfall distribution method
 Team 6 Comparison of rainfall distribution method In this section different methods of rainfall distribution are compared. METEO-France is the French meteorological agency, a public administrative institution
IRON ORE 2015, July 2015, Perth Australia. Danny Kentwell
 IRON ORE 2015, 13 15 July 2015, Perth Australia Danny Kentwell Overview The problem Block estimation totals with a full suite of elements/oxides do they sum to 100%? Case study 2 examples dense data and
Spatial Statistics or Why Spatial is Special?
 Spatial Statistics or Why Spatial is Special? Curdin Derungs, GISLab 20.10.2017 Seite 1 Spatial is special Spatial is special Longley et al s (2011) spatial is special -list: 20.10.2017 Seite 3 Spatial
Gridding of precipitation and air temperature observations in Belgium. Michel Journée Royal Meteorological Institute of Belgium (RMI)
") Gridding of precipitation and air temperature observations in Belgium Michel Journée Royal Meteorological Institute of Belgium (RMI) Gridding of meteorological data A variety of hydrologic, ecological,
Gridding of precipitation and air temperature observations in Belgium Michel Journée Royal Meteorological Institute of Belgium (RMI) Gridding of meteorological data A variety of hydrologic, ecological,
Sampling Scheme for 2003 General Social Survey of China
 Sampling Scheme for 2003 General Social Survey of China 1. Sampling Unit This survey uses a five-stage stratified sampling scheme with unequal probabilities. The sampling units at each stage are as follows:
Performance of W-AMOEBA and W-Contiguity matrices in Spatial Lag Model
 PROCEEDING OF 3 RD INTERNATIONAL CONFERENCE ON RESEARCH, IMPLEMENTATION AND EDUCATION OF MATHEMATICS AND SCIENCE YOGYAKARTA, 16 17 MAY 2016 Performance of W-AMOEBA and W-Contiguity matrices in Spatial
Chapter 4 - Fundamentals of spatial processes Lecture notes
 TK4150 - Intro 1 Chapter 4 - Fundamentals of spatial processes Lecture notes Odd Kolbjørnsen and Geir Storvik January 30, 2017 STK4150 - Intro 2 Spatial processes Typically correlation between nearby sites
Tricks to Creating a Resource Block Model. St John s, Newfoundland and Labrador November 4, 2015
 Tricks to Creating a Resource Block Model St John s, Newfoundland and Labrador November 4, 2015 Agenda 2 Domain Selection Top Cut (Grade Capping) Compositing Specific Gravity Variograms Block Size Search
Spatial analysis is the quantitative study of phenomena that are located in space.
 c HYON-JUNG KIM, 2016 1 Introduction Spatial analysis is the quantitative study of phenomena that are located in space. Spatial data analysis usually refers to an analysis of the observations in which
Estimation of Parameters
 CHAPTER Probability, Statistics, and Reliability for Engineers and Scientists FUNDAMENTALS OF STATISTICAL ANALYSIS Second Edition A. J. Clark School of Engineering Department of Civil and Environmental
Spatial Effects and Externalities
 Spatial Effects and Externalities Philip A. Viton November 5, Philip A. Viton CRP 66 Spatial () Externalities November 5, / 5 Introduction If you do certain things to your property for example, paint your
Investigation of Monthly Pan Evaporation in Turkey with Geostatistical Technique
 Investigation of Monthly Pan Evaporation in Turkey with Geostatistical Technique Hatice Çitakoğlu 1, Murat Çobaner 1, Tefaruk Haktanir 1, 1 Department of Civil Engineering, Erciyes University, Kayseri,
Spatial Regression Modeling
 Spatial Regression Modeling Paul Voss & Katherine Curtis The Center for Spatially Integrated Social Science Santa Barbara, CA July 12-17, 2009 Day 1 Objective Provide a solid introduction and overview
Contents. Learning Outcomes 2012/2/26. Lecture 6: Area Pattern and Spatial Autocorrelation. Dr. Bo Wu
 01//6 LSGI 1: : GIS Spatial Applications Analysis Lecture 6: Lecture Area Pattern 1: Introduction and Spatial to GIS Autocorrelation Applications Contents Lecture 6: Area Pattern and Spatial Autocorrelation
Overview of Statistical Analysis of Spatial Data
 Overview of Statistical Analysis of Spatial Data Geog 2C Introduction to Spatial Data Analysis Phaedon C. Kyriakidis www.geog.ucsb.edu/ phaedon Department of Geography University of California Santa Barbara
Analysis for Regional Differences and Influence Factor of Rural Income in China
 Modern Economy, 2012, 3, 578-583 http://dx.doi.org/10.4236/me.2012.35076 Published Online September 2012 (http://www.scirp.org/journal/me) Analysis for Regional Differences and Influence Factor of Rural
Concepts and Applications of Kriging
 Esri International User Conference San Diego, California Technical Workshops July 24, 2012 Concepts and Applications of Kriging Konstantin Krivoruchko Eric Krause Outline Intro to interpolation Exploratory
The Comparative Analysis of Spatial Structure of Ji Wheat 22 Yield Based on Different Stochastic Samplings
 The Comparative Analysis of Spatial Structure of Ji Wheat 22 Yield Based on Different Stochastic Samplings Yujian Yang * and Xueqin Tong S & T Information Engineering Technology Center of Shandong Academy
Mapping Precipitation in Switzerland with Ordinary and Indicator Kriging
 Journal of Geographic Information and Decision Analysis, vol. 2, no. 2, pp. 65-76, 1998 Mapping Precipitation in Switzerland with Ordinary and Indicator Kriging Peter M. Atkinson Department of Geography,
A Spatial Econometric Approach to Model the Growth of Tourism Flows to China Cities
 April 15, 2010 AAG 2010 Conference, Washington DC A Spatial Econometric Approach to Model the Growth of Tourism Flows to China Cities Yang Yang University of Florida Kevin. K.F. Wong The Hong Kong Polytechnic
Space-time data. Simple space-time analyses. PM10 in space. PM10 in time
 Space-time data Observations taken over space and over time Z(s, t): indexed by space, s, and time, t Here, consider geostatistical/time data Z(s, t) exists for all locations and all times May consider
University of California, Los Angeles Department of Statistics. Effect of variogram parameters on kriging weights
 University of California, Los Angeles Department of Statistics Statistics C173/C273 Instructor: Nicolas Christou Effect of variogram parameters on kriging weights We will explore in this document how the
Roger S. Bivand Edzer J. Pebesma Virgilio Gömez-Rubio. Applied Spatial Data Analysis with R. 4:1 Springer
 Roger S. Bivand Edzer J. Pebesma Virgilio Gömez-Rubio Applied Spatial Data Analysis with R 4:1 Springer Contents Preface VII 1 Hello World: Introducing Spatial Data 1 1.1 Applied Spatial Data Analysis
Universitat Autònoma de Barcelona Facultat de Filosofia i Lletres Departament de Prehistòria Doctorat en arqueologia prehistòrica
 Universitat Autònoma de Barcelona Facultat de Filosofia i Lletres Departament de Prehistòria Doctorat en arqueologia prehistòrica FROM MICRO TO MACRO SPATIAL DYNAMICS IN THE VILLAGGIO DELLE MACINE BETWEEN
Spatial Backfitting of Roller Measurement Values from a Florida Test Bed
 Spatial Backfitting of Roller Measurement Values from a Florida Test Bed Daniel K. Heersink 1, Reinhard Furrer 1, and Mike A. Mooney 2 1 Institute of Mathematics, University of Zurich, CH-8057 Zurich 2