Using Spatial Statistics and Geostatistical Analyst as Educational Tools
|
|
|
- Octavia Miller
- 5 years ago
- Views:
Transcription

1 Using Spatial Statistics and Geostatistical Analyst as Educational Tools By Konrad Dramowicz Centre of Geographic Sciences Lawrencetown, Nova Scotia, Canada ESRI User Conference, San Diego, California July 13, 2010
2 Presentation Outline Centre of Geographic Sciences Spatial Analysis and Geostatistics Course Learned skills Evolution of software tools used Student work samples Prediction, error and probability surface maps Point pattern analysis Spatial autocorrelation Hot spot analysis Measuring spatial distribution Geographically weighted regression

3 Centre of Geographic Sciences Located in Lawrencetown, Nova Scotia, Canada Population: ~ 300 Number of students: Number of COGS alumni currently working for ESRI: 50 Number of faculty: 18 ESRI software user since 1983 GIS program since 1985 New Advanced Diploma in Geographic Sciences with concentration in GIS, Remote Sensing or GIS for Business will be launched in 2010/2011
4 Spatial Analysis and Geostatistics Course The Spatial Analysis and Geostatistics course has been offered at COGS under different names since 1991 The course has been delivered as an elective for students from GIS, GIS for Business, and Remote Sensing Advanced Diploma Programs The number of course participants has varied from 3 to 12
5 Spatial Data Analysis Module Data Analysis module is mandatory for all students (30-45) taking the Advanced Diploma in Geographic Sciences program in their first term This module includes exploratory data analysis, geographically weighted regression, and some fundamental multivariate statistics in a spatial context
6 Necessary Basic Statistical Skills Using descriptive statistics Applying regression and curve fitting Understanding normal and t distributions Doing cluster analysis Comprehending statistical decision theory Significance and confidence Critical values Testing statistical hypotheses
7 Using Statistical Packages with ArcGIS The following links were the most common for ESRI users who wanted to add more statistical functionality to GIS SAS Bridge (ArcGIS) S-Plus for ArcView (ver ) In this course, IBM PASW software package (formerly known as SPSS), was used and data were passed to and from ArcGIS using an intermediate file format (*.dbf) Also, students learn how to perform statistical analysis using MS Excel (low cost solution)
8 Course Learning Outcomes The learners completing the Spatial Analysis and Geostatistics course demonstrate the ability to: Select the most appropriate tool for solving a given problem Map and interpret results Think spatially while setting model parameters and interpreting results Properly use fundamentals of statistics as a foundation for spatial analysis and geostatistics
9 Course Textbooks Mitchell Andy, The ESRI Guide to GIS Analysis; Volume 2: Spatial Measurements & Statistics, ESRI De Smith Michael J., Michael F. Goodchild, Paul A. Longley, 2009 (3 rd edition). Geospatial Analysis: A Comprehensive Guide to Principles, Techniques and Software Tools, Matador Johnston Kevin et al, Using ArcGIS Geostatistical Analyst, ESRI
10 Changes in Software Used ArcInfo Workstation ArcGIS GS+ Geostatistical Analyst IDRISI Spatial Statistics Toolset AML Python (with Tkinter) SpaceStat GeoDa / Spatial Statistics Toolset ArcView / Avenue (Wong & Lee scripts) ArcGIS / Python MapInfo / MapBasic ArcGIS / Python Hawth s Tools Fragstats

11 Main ArcGIS Tools Used in the Course Geostatistical Analyst and tools Spatial Statistics Tools
12 Recent Evolution of Geostatistical Tools Geostatistical Analyst: ArcGIS 8.1, April 2001 Geostatistical Wizard enhancements, nine new geostatistical tools: ArcGIS 9.2, September 2006 Geostatistical Analyst supported by ArcGIS Server, animated tutorial: ArcGIS 9.3, June 2008 Eleven new geoprocessing tools, improvements to the Geostatistical Analyst Wizard: ArcGIS 10.0, Fall 2010
13 Recent Evolution of Spatial Statistics Tools ArcToolbox Window with eighteen Spatial Statistics tools (10.7% of all available tools: ArcGIS 9.0, May 2004 Two more tools (including Ripley s K Function): ArcGIS 9.2, September 2006 New Geographically Weighted Regression tool: ArcGIS 9.3, June 2007 New Ordinary Least Squares tool: ArcGIS 9.3.1, May 2009 One new and eight improved tools: ArcGIS 10.0, Fall 2010
14 Geostatistics: Basic Topics Taught Regionalized variable Deterministic vs. geostatistical interpolation techniques (algorithms, examples, advantages and disadvantages) Global and local trends, neighborhood search, anisotropy Kriging methods, semivariance models, cokriging Transformations, cross-validation, bivariate distribution, detrending, declustering Gaussian simulations Prediction, error, and probability maps
15 Basic Properties of Regionalized Variable Applied for continuous spatial distribution Its nature is mixed: somewhere between deterministic and stochastic Used for modeling very complex processes
16 Major Advantages of Using Kriging Exact interpolation Standard error maps come as a derivative Allows the user to control numerous parameters
17 Controlling Kriging Parameters There are many kriging parameters to control and students are asked to control one parameter at time The optimal settings are those which minimize standard errors (root-mean-square, average standard error, or mean standardized)
18 Some Kriging Parameters to Control Kriging methods (7) Transformations (4) Semivariance models (7) Trend order (5) Anisotropy (individual values) Nugget (individual values) Number of histogram lags and their size Neighborhood search (number of neighbors, minimal number, four search shapes)

19

20 Excel Tool for Teaching Kriging

21 Critical Opinions About Geostatistics (1)
22 Critical Opinions About Geostatistics (2)
23 Student Work Samples: Prediction Surface Maps Driving time to Subways restaurants in Halifax 1 Driving time to Nova Scotia Breast Screening Program s clinics Prediction and standard error surfaces: number of houses sold per km sq in Halifax Regional Municipality in 2009 Spending on unhealthy products Number of recorded GPS locations of tourists in Kejimkujik National Park per one grid cell 1 Only one item from the list of student work samples is provided with this document. However, all of them they will be demonstrated at a time of presentation

24
25 Student Work Samples: Probability Surface Maps Percentage of woman aged receiving breast screening exceeds 20% Percentage of spending on unhealthy products exceeds 17% House prices exceeding $150,000 in Halifax Regional Municipality House prices exceeding $150,000 in Halifax Regional Municipality

26
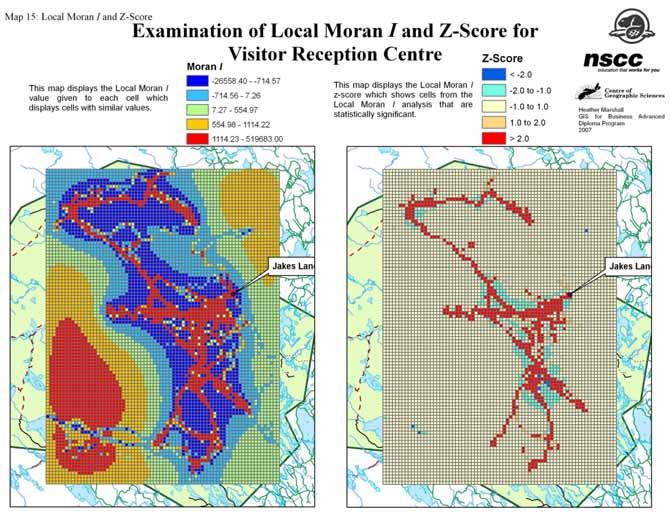
27 Spatial Analysis: Basic Topics (1) Point pattern analysis Nearest neighbor analysis (Spatial Statistics tool) Quadrat analysis (implemented by students using geoprocessing and scripting) K and L functions (Spatial Statistics tool) Spatial autocorrelation Moran (Spatial Statistics tool) Geary (ArcInfo Grid) Local Moran (Spatial Statistics tool)
28 Spatial Analysis: Basic Topics (2) G statistic General G statistic Hot spot analysis Measuring geographic distributions Mean center and central feature Standard distance and standard deviational ellipse Linear directional mean
29 Implementing Quadrat Analysis Use multiple point data sets Determine optimal quadrat size Calculate lambda (average number of points per quadrat), variance Use t statistic, various significance levels, determine point pattern Analyze relationships between quadrat size and point pattern
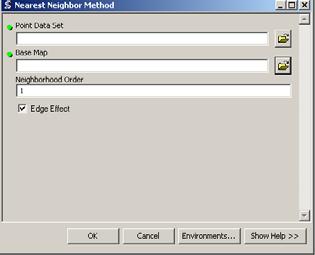
30 Enhancing Nearest Neighbor Analysis Use multiple point data sets Apply various neighborhood orders (1-6) Apply edge effect correction factor Analyze relationships between neighborhood order and z statistic Determine pattern for various significance levels

31
32 Student Work Samples: Point Pattern Analysis Spatial distribution of Nova Scotia Community College students and campuses Spatial distribution of GPS locations representing location of tourists in Kejimkujik National Park

33 Distribution of Nova Scotia Community College Students
34 Spatial Autocorrelation ArcInfo Workstation Grid commands Moran and Geary have two drawbacks: Work only for grid data Provide only values of coefficients which does not allow the user to make conclusion about the pattern (test statistics or significance levels are missing) ArcGIS does not have a tool for calculating Geary s coefficient of spatial autocorrelation c. The tool for Moran coefficient I provides an appropriate output for making conclusion about pattern
35 ArcInfo Workstation Grid Commands Moran and Geary

36 Spatial Autocorrelation (Global Moran s I) Provided values of a coefficient and test statistic Provided significance levels and corresponding critical values
37 Student Work Samples: Spatial Autocorrelation Hurricane statistics (scale intensity, damage, injuries, fatalities, mean path width) for continental USA, central USA, and Kansas Patterns on spending on eleven food categories across Nova Scotia Patterns on fishing five species (cod, haddock, yellowtail, skate, lobster) in three fishing areas (entire bank, western portions and selected areas of Georges Bank) near Nova Scotia

38 Spatial Autocorrelation of Hurricanes for Three Study Areas and Five Variables
39 Student Work Samples: Mapping Spatial Autocorrelation Clusters Clusters of Nova Scotia Community College students by Dissemination Areas Clusters of GPS locations of tourists in Kejimkujik National Park
40
41 Hot Spot Analysis Hot spot analysis is one of the most informative and visually appealed tools It is available trough such Spatial Statistics tools as Hot Spot Analysis (Getis-Ord Gi*) Cluster/Outlier Analysis with Rendering Hot Spot Analysis with Rendering Z score Rendering Results can be visualized using thematic classified maps of: Input variable Gi* values Z values
42 Student Work Samples: Hot Spot Analysis Relationships between G statistic and distance threshold Clusters of tornado in Kansas Clusters of visitors in Kejimkujik National Park Concentration of locations where tourists stopped in Kejimkujik Seaside Adjunct National Park High and low participation rates for the Nova Scotia Breast Screening Program High and low spending on healthy food categories in Nova Scotia Clusters of high and low house prices in Halifax Regional Municipality in 2009

43
44 Measuring Geographic Distributions Set of tool relatively easy to use and providing visually appealed results Extremely useful for such operations as: Determining study area Comparing spatial distributions and analyzing changes Identifying the most accessible feature or location Analyzing orientation and direction of linear features
45 Student Work Samples: Measuring Geographic Distributions Determining study area based on weighted deviational ellipse for Air Miles cardholders Directional distribution of GIS jobs in North America Mean centre and deviational ellipse: weekday vs. weekend tourists; morning, mid-day and evening tourists in Kejimkujik National Park Succession of mean center and deviational ellipses for houses sold in Halifax Regional Municipality Geographic distribution of students and campuses of the Nova Scotia Community College

46
47 Geographically Weighted Regression Geographically Weighted Regression (GWR) developed in late 1970s, was added to ArcGIS as a new tool in 2007 and it is a great extension to the multiple linear regression added to ArcGIS two years later as the Ordinary Least Squares (OLS) tool OLS is a global-scale tool providing output for the entire study area, whereas GWR is a local-scale tool providing output for each GIS feature GWR has many input parameters and offers a lot of opportunities for mapping numerous output data
 ArcMap")
48 Comparing Results from ArcMap (OLS) and SPSS (Multiple Linear Regression) ArcMap SPSS
49 Possible Problems with Using GWR Relationships between predictors and target variable are not linear Correlations among predictors is detected (collinearity) Different patterns exist across study area (nonstationarity) Presence of data outliers can bias predicted values Model performance depends on the magnitude of the target variable value (heteroskedasticity) Spatial clusters of over-estimated and underestimated predicted values exist (spatial autocorrelation of residuals) Residuals are not normally distributed
50 GWR Input Parameters to Control Set of independent variables (predictors) Distance or number of neighbors Optionally, two kernel types Fixed Adaptive Optionally, two bandwidth methods Akaike Informative Criterion Cross Validation Optionally, using other raster-related parameters
51 Comparison of GWR Scenarios: An Example Scenario Kernel type Bandwidth method Distance Number of neighbors A Fixed Parameter 4000 meters N/A B Fixed Parameter 2000 meters N/A C Adaptive Parameter N/A 30 D Fixed AIC N/A N/A E Fixed CV N/A N/A F (weighted by area Adaptive Parameter N/A 30 G (weighted by population) Adaptive Parameter N/A 30
52 Preferred Values of GWR Input Parameters Preferred values Low values High values Residual squares R2 (close to 1.0) Sigma R2 adjusted (close to 1.0) AICc
53 Finding The Best Model: An Example Scenario Residual squares Effective number Sigma AICc R2 R2 adjusted A 44,594,620, ,120 5, B 8,519,128, ,779 2, C 8,519,128, ,779 2, D 100,432,304, ,814 7, E 100,432,304, ,814 7, F 814,654, ,128 1, G 3,926,076,424, ,158 2, The best model is scenario F (Adaptive kernel, 30 neighbors, weighted by area)
54 Possible Output Maps From GWR 1. Observed values (column Observed) 2. Predicted values (column Predicted) 3. Raw residuals (column Residual) 4. Standardized residuals (column StResid) 5. Coefficients of determination (column Local R2) 6. Standard error (column StError) 7. Collinearity (column Cond) 8. Weighted factor (column Weight)
55 Final Thoughts Learners through practicing spatial analysis and geostatistics with ArcGIS acquire new analytical and research skills which can be used for Enhancing students assignments in other courses Completing major research projects and capstone projects Continuing their education toward the degree of Masters in Geomatics, joined program between the Nova Scotia Community College and Acadia University (Wolfville, Nova Scotia)
A GEOSTATISTICAL APPROACH TO PREDICTING A PHYSICAL VARIABLE THROUGH A CONTINUOUS SURFACE
 Katherine E. Williams University of Denver GEOG3010 Geogrpahic Information Analysis April 28, 2011 A GEOSTATISTICAL APPROACH TO PREDICTING A PHYSICAL VARIABLE THROUGH A CONTINUOUS SURFACE Overview Data
Exploratory Spatial Data Analysis (ESDA)
") Exploratory Spatial Data Analysis (ESDA) VANGHR s method of ESDA follows a typical geospatial framework of selecting variables, exploring spatial patterns, and regression analysis. The primary software
Exploratory Spatial Data Analysis (ESDA) VANGHR s method of ESDA follows a typical geospatial framework of selecting variables, exploring spatial patterns, and regression analysis. The primary software
Modeling Spatial Relationships Using Regression Analysis
 Esri International User Conference San Diego, California Technical Workshops July 24, 2012 Modeling Spatial Relationships Using Regression Analysis Lauren M. Scott, PhD Lauren Rosenshein Bennett, MS Answering
Objectives Define spatial statistics Introduce you to some of the core spatial statistics tools available in ArcGIS 9.3 Present a variety of example a
 Introduction to Spatial Statistics Opportunities for Education Lauren M. Scott, PhD Mark V. Janikas, PhD Lauren Rosenshein Jorge Ruiz-Valdepeña 1 Objectives Define spatial statistics Introduce you to some
Spatial Analysis and Modeling (GIST 4302/5302) Guofeng Cao Department of Geosciences Texas Tech University
 Guofeng Cao Department of Geosciences Texas Tech University") Spatial Analysis and Modeling (GIST 4302/5302) Guofeng Cao Department of Geosciences Texas Tech University TTU Graduate Certificate Geographic Information Science and Technology (GIST) 3 Core Courses and
Spatial Analysis and Modeling (GIST 4302/5302) Guofeng Cao Department of Geosciences Texas Tech University TTU Graduate Certificate Geographic Information Science and Technology (GIST) 3 Core Courses and
Modeling Spatial Relationships using Regression Analysis
 Esri International User Conference San Diego, CA Technical Workshops July 2011 Modeling Spatial Relationships using Regression Analysis Lauren M. Scott, PhD Lauren Rosenshein, MS Mark V. Janikas, PhD Answering
Spatial analysis. Spatial descriptive analysis. Spatial inferential analysis:
 Spatial analysis Spatial descriptive analysis Point pattern analysis (minimum bounding box, mean center, weighted mean center, standard distance, nearest neighbor analysis) Spatial clustering analysis
Spatial Analysis with ArcGIS Pro STUDENT EDITION
 Spatial Analysis with ArcGIS Pro STUDENT EDITION Copyright 2018 Esri All rights reserved. Course version 2.0. Version release date November 2018. Printed in the United States of America. The information
LEHMAN COLLEGE CITY UNIVERSITY OF NEW YORK DEPARTMENT OF ENVIRONMENTAL, GEOGRAPHIC, AND GEOLOGICAL SCIENCES CURRICULAR CHANGE
 LEHMAN COLLEGE CITY UNIVERSITY OF NEW YORK DEPARTMENT OF ENVIRONMENTAL, GEOGRAPHIC, AND GEOLOGICAL SCIENCES CURRICULAR CHANGE Hegis Code: 2206.00 Program Code: 452/2682 1. Type of Change: New Course 2.
Modeling Spatial Relationships Using Regression Analysis. Lauren M. Scott, PhD Lauren Rosenshein Bennett, MS
 Modeling Spatial Relationships Using Regression Analysis Lauren M. Scott, PhD Lauren Rosenshein Bennett, MS Workshop Overview Answering why? questions Introduce regression analysis - What it is and why
Spatial Analysis I. Spatial data analysis Spatial analysis and inference
 Spatial Analysis I Spatial data analysis Spatial analysis and inference Roadmap Outline: What is spatial analysis? Spatial Joins Step 1: Analysis of attributes Step 2: Preparing for analyses: working with
11/8/2018. Spatial Interpolation & Geostatistics. Kriging Step 1
 (Z i Z j ) 2 / 2 (Z i Zj) 2 / 2 Semivariance y 11/8/2018 Spatial Interpolation & Geostatistics Kriging Step 1 Describe spatial variation with Semivariogram Lag Distance between pairs of points Lag Mean
Why Is It There? Attribute Data Describe with statistics Analyze with hypothesis testing Spatial Data Describe with maps Analyze with spatial analysis
 6 Why Is It There? Why Is It There? Getting Started with Geographic Information Systems Chapter 6 6.1 Describing Attributes 6.2 Statistical Analysis 6.3 Spatial Description 6.4 Spatial Analysis 6.5 Searching
Exploratory Spatial Data Analysis (And Navigating GeoDa)
") Exploratory Spatial Data Analysis (And Navigating GeoDa) June 9, 2006 Stephen A. Matthews Associate Professor of Sociology & Anthropology, Geography and Demography Director of the Geographic Information
Exploratory Spatial Data Analysis (And Navigating GeoDa) June 9, 2006 Stephen A. Matthews Associate Professor of Sociology & Anthropology, Geography and Demography Director of the Geographic Information
Spatial Interpolation & Geostatistics
 (Z i Z j ) 2 / 2 Spatial Interpolation & Geostatistics Lag Lag Mean Distance between pairs of points 1 y Kriging Step 1 Describe spatial variation with Semivariogram (Z i Z j ) 2 / 2 Point cloud Map 3
GIS Analysis: Spatial Statistics for Public Health: Lauren M. Scott, PhD; Mark V. Janikas, PhD
 Some Slides to Go Along with the Demo Hot spot analysis of average age of death Section B DEMO: Mortality Data Analysis 2 Some Slides to Go Along with the Demo Do Economic Factors Alone Explain Early Death?
Introduction to the 176A labs and ArcGIS Purpose of the labs
 Introduction to the 176A labs and ArcGIS Purpose of the labs Acknowledgement: Slides by David Maidment, U Texas-Austin and Francisco Olivera (TAMU) Hands-on experience with a leading software package Introduction
Spatial Analysis 1. Introduction
 Spatial Analysis 1 Introduction Geo-referenced Data (not any data) x, y coordinates (e.g., lat., long.) ------------------------------------------------------ - Table of Data: Obs. # x y Variables -------------------------------------
Report on Kriging in Interpolation
 Tabor Reedy ENVS421 3/12/15 Report on Kriging in Interpolation In this project I explored use of the geostatistical analyst extension and toolbar in the process of creating an interpolated surface through
Environmental Systems Research Institute
 Introduction to ArcGIS ESRI Environmental Systems Research Institute Redlands, California 2 ESRI GIS Development Arc/Info (coverage model) Versions 1-7 from 1980 1999 Arc Macro Language (AML) ArcView (shapefile
Spatial Pattern Analysis: Mapping Trends and Clusters
 Esri International User Conference San Diego, California Technical Workshops July 24, 2012 Spatial Pattern Analysis: Mapping Trends and Clusters Lauren M. Scott, PhD Lauren Rosenshein Bennett, MS Presentation
GIST 4302/5302: Spatial Analysis and Modeling
 GIST 4302/5302: Spatial Analysis and Modeling Spring 2014 Lectures: Tuesdays & Thursdays 2:00pm-2:50pm, Holden Hall 00038 Lab sessions: Tuesdays or Thursdays 3:00pm-4:50pm or Wednesday 1:00pm-2:50pm, Holden
UNIT 4: USING ArcGIS. Instructor: Emmanuel K. Appiah-Adjei (PhD) Department of Geological Engineering KNUST, Kumasi
 Department of Geological Engineering KNUST, Kumasi") UNIT 4: USING ArcGIS Instructor: Emmanuel K. Appiah-Adjei (PhD) Department of Geological Engineering KNUST, Kumasi Getting to Know ArcGIS ArcGIS is an integrated collection of GIS software products ArcGIS
UNIT 4: USING ArcGIS Instructor: Emmanuel K. Appiah-Adjei (PhD) Department of Geological Engineering KNUST, Kumasi Getting to Know ArcGIS ArcGIS is an integrated collection of GIS software products ArcGIS
Concepts and Applications of Kriging. Eric Krause Konstantin Krivoruchko
 Concepts and Applications of Kriging Eric Krause Konstantin Krivoruchko Outline Introduction to interpolation Exploratory spatial data analysis (ESDA) Using the Geostatistical Wizard Validating interpolation
ENGRG Introduction to GIS
 ENGRG 59910 Introduction to GIS Michael Piasecki October 13, 2017 Lecture 06: Spatial Analysis Outline Today Concepts What is spatial interpolation Why is necessary Sample of interpolation (size and pattern)
Teaching GIS for Land Surveying
 Teaching GIS for Land Surveying Zhanjing (John) Yu Evergreen Valley College, San Jose, California James Crossfield California State University at Fresno, Fresno California 7/13/2006 1 Outline of the Presentation
Using Spatial Statistics Social Service Applications Public Safety and Public Health
 Using Spatial Statistics Social Service Applications Public Safety and Public Health Lauren Rosenshein 1 Regression analysis Regression analysis allows you to model, examine, and explore spatial relationships,
GIST 4302/5302: Spatial Analysis and Modeling
 GIST 4302/5302: Spatial Analysis and Modeling Spring 2016 Lectures: Tuesdays & Thursdays 12:30pm-1:20pm, Science 234 Labs: GIST 4302: Monday 1:00-2:50pm or Tuesday 2:00-3:50pm GIST 5302: Wednesday 2:00-3:50pm
This report details analyses and methodologies used to examine and visualize the spatial and nonspatial
 Analysis Summary: Acute Myocardial Infarction and Social Determinants of Health Acute Myocardial Infarction Study Summary March 2014 Project Summary :: Purpose This report details analyses and methodologies
GIST 4302/5302: Spatial Analysis and Modeling
 GIST 4302/5302: Spatial Analysis and Modeling Fall 2015 Lectures: Tuesdays & Thursdays 2:00pm-2:50pm, Science 234 Lab sessions: Tuesdays or Thursdays 3:00pm-4:50pm or Friday 9:00am-10:50am, Holden 204
Geographic Systems and Analysis
 Geographic Systems and Analysis New York University Robert F. Wagner Graduate School of Public Service Instructor Stephanie Rosoff Contact: stephanie.rosoff@nyu.edu Office hours: Mondays by appointment
ArcGIS for Geostatistical Analyst: An Introduction. Steve Lynch and Eric Krause Redlands, CA.
 ArcGIS for Geostatistical Analyst: An Introduction Steve Lynch and Eric Krause Redlands, CA. Outline - What is geostatistics? - What is Geostatistical Analyst? - Spatial autocorrelation - Geostatistical
Map your way to deeper insights
 Map your way to deeper insights Target, forecast and plan by geographic region Highlights Apply your data to pre-installed map templates and customize to meet your needs. Select from included map files
Geog 469 GIS Workshop. Data Analysis
 Geog 469 GIS Workshop Data Analysis Outline 1. What kinds of need-to-know questions can be addressed using GIS data analysis? 2. What is a typology of GIS operations? 3. What kinds of operations are useful
The CrimeStat Program: Characteristics, Use, and Audience
 The CrimeStat Program: Characteristics, Use, and Audience Ned Levine, PhD Ned Levine & Associates and Houston-Galveston Area Council Houston, TX In the paper and presentation, I will discuss the CrimeStat
GIS CONCEPTS ARCGIS METHODS AND. 3 rd Edition, July David M. Theobald, Ph.D. Warner College of Natural Resources Colorado State University
 GIS CONCEPTS AND ARCGIS METHODS 3 rd Edition, July 2007 David M. Theobald, Ph.D. Warner College of Natural Resources Colorado State University Copyright Copyright 2007 by David M. Theobald. All rights
CSISS Tools and Spatial Analysis Software
 CSISS Tools and Spatial Analysis Software June 5, 2006 Stephen A. Matthews Associate Professor of Sociology & Anthropology, Geography and Demography Director of the Geographic Information Analysis Core
Determining a Useful Interpolation Method for Surficial Sediments in the Gulf of Maine Ian Cochran
 Determining a Useful Interpolation Method for Surficial Sediments in the Gulf of Maine Ian Cochran ABSTRACT This study was conducted to determine if an interpolation of surficial sediments in the Gulf
Concepts and Applications of Kriging. Eric Krause
 Concepts and Applications of Kriging Eric Krause Sessions of note Tuesday ArcGIS Geostatistical Analyst - An Introduction 8:30-9:45 Room 14 A Concepts and Applications of Kriging 10:15-11:30 Room 15 A
GIST 4302/5302: Spatial Analysis and Modeling Lecture 1: Overview
 GIST 4302/5302: Spatial Analysis and Modeling Lecture 1: Overview Guofeng Cao www.myweb.ttu.edu/gucao Department of Geosciences Texas Tech University guofeng.cao@ttu.edu Fall 2017 Texas Tech GIS Graduate
GIST 4302/5302: Spatial Analysis and Modeling
 GIST 4302/5302: Spatial Analysis and Modeling Review Guofeng Cao www.gis.ttu.edu/starlab Department of Geosciences Texas Tech University guofeng.cao@ttu.edu Spring 2016 Course Outlines Spatial Point Pattern
Spatial Tools for Econometric and Exploratory Analysis
 Spatial Tools for Econometric and Exploratory Analysis Michael F. Goodchild University of California, Santa Barbara Luc Anselin University of Illinois at Urbana-Champaign http://csiss.org Outline A Quick
A FOSS Web Tool for Spatial Regression Techniques and its Application to Explore Bike Sharing Usage Patterns
 A FOSS Web Tool for Spatial Regression Techniques and its Application to Explore Bike Sharing Usage Patterns MGIS Capstone Proposal Author: Spencer Bell Presentation Outline Background Bike Share Spatial
11. Kriging. ACE 492 SA - Spatial Analysis Fall 2003
 11. Kriging ACE 492 SA - Spatial Analysis Fall 2003 c 2003 by Luc Anselin, All Rights Reserved 1 Objectives The goal of this lab is to further familiarize yourself with ESRI s Geostatistical Analyst, extending
Soil Moisture Modeling using Geostatistical Techniques at the O Neal Ecological Reserve, Idaho
 Final Report: Forecasting Rangeland Condition with GIS in Southeastern Idaho Soil Moisture Modeling using Geostatistical Techniques at the O Neal Ecological Reserve, Idaho Jacob T. Tibbitts, Idaho State
Introduction to the 176A labs and ArcGIS
 Introduction to the 176A labs and ArcGIS Acknowledgement: Slides by David Maidment, U Texas-Austin and Francisco Olivera (TAMU) Purpose of the labs Hands-on experience with one software pakage Introduction
Popular Mechanics, 1954
 Introduction to GIS Popular Mechanics, 1954 1986 $2,599 1 MB of RAM 2017, $750, 128 GB memory, 2 GB of RAM Computing power has increased exponentially over the past 30 years, Allowing the existence of
GIS Spatial Statistics for Public Opinion Survey Response Rates
 GIS Spatial Statistics for Public Opinion Survey Response Rates July 22, 2015 Timothy Michalowski Senior Statistical GIS Analyst Abt SRBI - New York, NY t.michalowski@srbi.com www.srbi.com Introduction
Lecture 2. Introduction to ESRI s ArcGIS Desktop and ArcMap
 Lecture 2 Introduction to ESRI s ArcGIS Desktop and ArcMap Outline ESRI What is ArcGIS? ArcGIS Desktop ArcMap Overview Views Layers Attribute Tables Help! Scale Tips and Tricks ESRI Environmental Systems
ArcGIS Pro: Analysis and Geoprocessing. Nicholas M. Giner Esri Christopher Gabris Blue Raster
 ArcGIS Pro: Analysis and Geoprocessing Nicholas M. Giner Esri Christopher Gabris Blue Raster Agenda What is Analysis and Geoprocessing? Analysis in ArcGIS Pro - 2D (Spatial xy) - 3D (Elevation - z) - 4D
GIS Boot Camp for Education June th, 2011 Day 1. Instructor: Sabah Jabbouri Phone: (253) x 4854 Office: TC 136
 x 4854 Office: TC 136") GIS Boot Camp for Education June 27-30 th, 2011 Day 1 Instructor: Sabah Jabbouri Phone: (253) 833-9111 x 4854 Office: TC 136 Email: sjabbouri@greenriver.edu http://www.instruction.greenriver.edu/gis/ Summer
GIS Boot Camp for Education June 27-30 th, 2011 Day 1 Instructor: Sabah Jabbouri Phone: (253) 833-9111 x 4854 Office: TC 136 Email: sjabbouri@greenriver.edu http://www.instruction.greenriver.edu/gis/ Summer
INTRODUCTION TO ARCGIS Version 10.*
 Week 3 INTRODUCTION TO ARCGIS Version 10.* topics of the week Overview of ArcGIS Using ArcCatalog Overview of ArcGIS Desktop ArcGIS Overview Scalable desktop applications ArcView ArcEditor ArcInfo ArcGIS
ASPECTS REGARDING THE USEFULNESS OF GEOGRAPHICALLY WEIGHTED REGRESSION (GWR) FOR DIGITAL MAPPING OF SOIL PARAMETERS
 FOR DIGITAL MAPPING OF SOIL PARAMETERS") Lucrări Ştiinţifice vol. 52, seria Agronomie ASPECTS REGARDING THE USEFULNESS OF GEOGRAPHICALLY WEIGHTED REGRESSION (GWR) FOR DIGITAL MAPPING OF SOIL PARAMETERS C. PATRICHE 1, I. VASILINIUC 2 1 Romanian
Lucrări Ştiinţifice vol. 52, seria Agronomie ASPECTS REGARDING THE USEFULNESS OF GEOGRAPHICALLY WEIGHTED REGRESSION (GWR) FOR DIGITAL MAPPING OF SOIL PARAMETERS C. PATRICHE 1, I. VASILINIUC 2 1 Romanian
GIS CONCEPTS ARCGIS METHODS AND. 2 nd Edition, July David M. Theobald, Ph.D. Natural Resource Ecology Laboratory Colorado State University
 GIS CONCEPTS AND ARCGIS METHODS 2 nd Edition, July 2005 David M. Theobald, Ph.D. Natural Resource Ecology Laboratory Colorado State University Copyright Copyright 2005 by David M. Theobald. All rights
It s a Model. Quantifying uncertainty in elevation models using kriging
 It s a Model Quantifying uncertainty in elevation models using kriging By Konstantin Krivoruchko and Kevin Butler, Esri Raster based digital elevation models (DEM) are the basis of some of the most important
Dr Arulsivanathan Naidoo Statistics South Africa 18 October 2017
 ESRI User Conference 2017 Space Time Pattern Mining Analysis of Matric Pass Rates in Cape Town Schools Dr Arulsivanathan Naidoo Statistics South Africa 18 October 2017 Choose one of the following Leadership
Spatial Analysis II. Spatial data analysis Spatial analysis and inference
 Spatial Analysis II Spatial data analysis Spatial analysis and inference Roadmap Spatial Analysis I Outline: What is spatial analysis? Spatial Joins Step 1: Analysis of attributes Step 2: Preparing for
Geometric Algorithms in GIS
 Geometric Algorithms in GIS GIS Software Dr. M. Gavrilova GIS System What is a GIS system? A system containing spatially referenced data that can be analyzed and converted to new information for a specific
Concepts and Applications of Kriging
 Esri International User Conference San Diego, California Technical Workshops July 24, 2012 Concepts and Applications of Kriging Konstantin Krivoruchko Eric Krause Outline Intro to interpolation Exploratory
Spatial Data Analysis in Archaeology Anthropology 589b. Kriging Artifact Density Surfaces in ArcGIS
 Spatial Data Analysis in Archaeology Anthropology 589b Fraser D. Neiman University of Virginia 2.19.07 Spring 2007 Kriging Artifact Density Surfaces in ArcGIS 1. The ingredients. -A data file -- in.dbf
Concepts and Applications of Kriging
 2013 Esri International User Conference July 8 12, 2013 San Diego, California Technical Workshop Concepts and Applications of Kriging Eric Krause Konstantin Krivoruchko Outline Intro to interpolation Exploratory
GIS CONFERENCE MAKING PLACE MATTER Decoding Health Data with Spatial Statistics
 esri HEALTH AND HUMAN SERVICES GIS CONFERENCE MAKING PLACE MATTER Decoding Health Data with Spatial Statistics Flora Vale Jenora D Acosta Wait a minute Wait a minute Where is Lauren?? Wait a minute Where
DP Project Development Pvt. Ltd.
 Dear Sir/Madam, Greetings!!! Thanks for contacting DP Project Development for your training requirement. DP Project Development is leading professional training provider in GIS technologies and GIS application
GeoDa-GWR Results: GeoDa-GWR Output (portion only): Program began at 4/8/2016 4:40:38 PM
: Program began at 4/8/2016 4:40:38 PM") New Mexico Health Insurance Coverage, 2009-2013 Exploratory, Ordinary Least Squares, and Geographically Weighted Regression Using GeoDa-GWR, R, and QGIS Larry Spear 4/13/2016 (Draft) A dataset consisting
New Mexico Health Insurance Coverage, 2009-2013 Exploratory, Ordinary Least Squares, and Geographically Weighted Regression Using GeoDa-GWR, R, and QGIS Larry Spear 4/13/2016 (Draft) A dataset consisting
Geoprocessing Tools at ArcGIS 9.2 Desktop
 Geoprocessing Tools at ArcGIS 9.2 Desktop Analysis Tools Analysis Tools \ Extract Clip Analysis Tools \ Extract Select Analysis Tools \ Extract Split Analysis Tools \ Extract Table Select Analysis Tools
Using GIS to Identify Pedestrian- Vehicle Crash Hot Spots and Unsafe Bus Stops
 Using GIS to Identify Pedestrian-Vehicle Crash Hot Spots and Unsafe Bus Stops Using GIS to Identify Pedestrian- Vehicle Crash Hot Spots and Unsafe Bus Stops Long Tien Truong and Sekhar V. C. Somenahalli
Spatial-Temporal Analytics with Students Data to recommend optimum regions to stay
 Spatial-Temporal Analytics with Students Data to recommend optimum regions to stay By ARUN KUMAR BALASUBRAMANIAN (A0163264H) DEVI VIJAYAKUMAR (A0163403R) RAGHU ADITYA (A0163260N) SHARVINA PAWASKAR (A0163302W)
This lab exercise will try to answer these questions using spatial statistics in a geographic information system (GIS) context.
 context.") by Introduction Problem Do the patterns of forest fires change over time? Do forest fires occur in clusters, and do the clusters change over time? Is this information useful in fighting forest fires? This
by Introduction Problem Do the patterns of forest fires change over time? Do forest fires occur in clusters, and do the clusters change over time? Is this information useful in fighting forest fires? This
Luc Anselin Spatial Analysis Laboratory Dept. Agricultural and Consumer Economics University of Illinois, Urbana-Champaign
 GIS and Spatial Analysis Luc Anselin Spatial Analysis Laboratory Dept. Agricultural and Consumer Economics University of Illinois, Urbana-Champaign http://sal.agecon.uiuc.edu Outline GIS and Spatial Analysis
GEOGRAPHY MA, ASSESSMENT REPORT AY
 GEOGRAPHY MA, ASSESSMENT REPORT AY2012-2013 Programs: Geography MA Options Department: GSHAA Assessment Instruments and Student Outcomes This is an assessment report on three MA options in Geography in
Introduction to GIS. Geol 4048 Geological Applications of Remote Sensing
 Introduction to GIS Geol 4048 Geological Applications of Remote Sensing GIS History: Before Computers GIS History Using maps for a long time Dr. Roger F. Tomlinson Father of GIS He was an English geographer
Geospatial Science and Technology Model Courses and Certificate:
 Geospatial Science and Technology Model Courses and Certificate: Guidelines and Tools to Align Curriculum to Workforce Needs Ann Johnson Associate Director gisajohnson@delmar.edu Funded by National Science
Geog 210C Spring 2011 Lab 6. Geostatistics in ArcMap
 Geog 210C Spring 2011 Lab 6. Geostatistics in ArcMap Overview In this lab you will think critically about the functionality of spatial interpolation, improve your kriging skills, and learn how to use several
Advanced analysis and modelling tools for spatial environmental data. Case study: indoor radon data in Switzerland
 EnviroInfo 2004 (Geneva) Sh@ring EnviroInfo 2004 Advanced analysis and modelling tools for spatial environmental data. Case study: indoor radon data in Switzerland Mikhail Kanevski 1, Michel Maignan 1
Extent of Radiological Contamination in Soil at Four Sites near the Fukushima Daiichi Power Plant, Japan (ArcGIS)
") Extent of Radiological Contamination in Soil at Four Sites near the Fukushima Daiichi Power Plant, Japan (ArcGIS) Contact: Ted Parks, AMEC Foster Wheeler, theodore.parks@amecfw.com, Alex Mikszewski, AMEC
Extent of Radiological Contamination in Soil at Four Sites near the Fukushima Daiichi Power Plant, Japan (ArcGIS) Contact: Ted Parks, AMEC Foster Wheeler, theodore.parks@amecfw.com, Alex Mikszewski, AMEC
An Introduction to Pattern Statistics
 An Introduction to Pattern Statistics Nearest Neighbors The CSR hypothesis Clark/Evans and modification Cuzick and Edwards and controls All events k function Weighted k function Comparative k functions
Geostatistical Interpolation: Kriging and the Fukushima Data. Erik Hoel Colligium Ramazzini October 30, 2011
 Geostatistical Interpolation: Kriging and the Fukushima Data Erik Hoel Colligium Ramazzini October 30, 2011 Agenda Basics of geostatistical interpolation Fukushima radiation Database Web site Geoanalytic
Statistics: A review. Why statistics?
 Statistics: A review Why statistics? What statistical concepts should we know? Why statistics? To summarize, to explore, to look for relations, to predict What kinds of data exist? Nominal, Ordinal, Interval
DAVID L. COLVILLE. Education
 DAVID L. COLVILLE Applied Geomatics Research Group (AGRG) Centre of Geographic Sciences (COGS) Annapolis Valley Campus, NSCC Middleton, Nova Scotia, Canada B0S 1P0 Phone: (902) 825 5476 Fax: (902) 825-5479
ArcGIS Geostatistical Analyst: Powerful Exploration and Data Interpolation Solutions
 TM ArcGIS Geostatistical Analyst: Powerful Exploration and Data Interpolation Solutions An ESRI White Paper March 2001 ESRI 380 New York St., Redlands, CA 92373-8100, USA TEL 909-793-2853 FAX 909-793-5953
PRODUCING PROBABILITY MAPS TO ASSESS RISK OF EXCEEDING CRITICAL THRESHOLD VALUE OF SOIL EC USING GEOSTATISTICAL APPROACH
 PRODUCING PROBABILITY MAPS TO ASSESS RISK OF EXCEEDING CRITICAL THRESHOLD VALUE OF SOIL EC USING GEOSTATISTICAL APPROACH SURESH TRIPATHI Geostatistical Society of India Assumptions and Geostatistical Variogram
Spatial Data Mining. Regression and Classification Techniques
 Spatial Data Mining Regression and Classification Techniques 1 Spatial Regression and Classisfication Discrete class labels (left) vs. continues quantities (right) measured at locations (2D for geographic
Where to Invest Affordable Housing Dollars in Polk County?: A Spatial Analysis of Opportunity Areas
 Resilient Neighborhoods Technical Reports and White Papers Resilient Neighborhoods Initiative 6-2014 Where to Invest Affordable Housing Dollars in Polk County?: A Spatial Analysis of Opportunity Areas
GIS and Forest Engineering Applications FE 357 Lecture: 2 hours Lab: 2 hours 3 credits
 GIS and Forest Engineering Applications FE 357 Lecture: 2 hours Lab: 2 hours 3 credits Instructor: Michael Wing Assistant Professor Forest Engineering Department Oregon State University Peavy Hall 275
2/7/2018. Module 4. Spatial Statistics. Point Patterns: Nearest Neighbor. Spatial Statistics. Point Patterns: Nearest Neighbor
 Spatial Statistics Module 4 Geographers are very interested in studying, understanding, and quantifying the patterns we can see on maps Q: What kinds of map patterns can you think of? There are so many
Outline. Chapter 1. A history of products. What is ArcGIS? What is GIS? Some GIS applications Introducing the ArcGIS products How does GIS work?
 Outline Chapter 1 Introducing ArcGIS What is GIS? Some GIS applications Introducing the ArcGIS products How does GIS work? Basic data formats The ArcCatalog interface 1-1 1-2 A history of products Arc/Info
GIS Test Drive What a Geographic Information System Is and What it Can Do. Alison Davis-Holland
 GIS Test Drive What a Geographic Information System Is and What it Can Do Alison Davis-Holland adavisholland@gmail.com WHO AM I? Geospatial Analyst M.S. in Geographic and Cartographic Sciences Use GIS
Fundamentals of ArcGIS Desktop Pathway
 Fundamentals of ArcGIS Desktop Pathway Table of Contents ArcGIS Desktop I: Getting Started with GIS 3 ArcGIS Desktop II: Tools and Functionality 5 Understanding Geographic Data 8 Understanding Map Projections
Acknowledgments xiii Preface xv. GIS Tutorial 1 Introducing GIS and health applications 1. What is GIS? 2
 Acknowledgments xiii Preface xv GIS Tutorial 1 Introducing GIS and health applications 1 What is GIS? 2 Spatial data 2 Digital map infrastructure 4 Unique capabilities of GIS 5 Installing ArcView and the
SAIT & FortisAlberta Forge a Partnership to put New Ideas on the Map
 SAIT & FortisAlberta Forge a Partnership to put New Ideas on the Map Presented by: - Jamie Johnston-Stewart, SAIT Instructor, SAIT - Sarah Cameron, Supervisor Data Integrity & GIS, FortisAlberta - Liam
CREATION OF DEM BY KRIGING METHOD AND EVALUATION OF THE RESULTS
 CREATION OF DEM BY KRIGING METHOD AND EVALUATION OF THE RESULTS JANA SVOBODOVÁ, PAVEL TUČEK* Jana Svobodová, Pavel Tuček: Creation of DEM by kriging method and evaluation of the results. Geomorphologia
Eva Strand CNR Remote Sensing and GIS Lab
 Eva Strand CNR Remote Sensing and GIS Lab Habitat map Available habitat Habitat Hectares Percent Habitat 1 38079.9 55.1 Habitat 2 2740.5 4.0 Habitat 3 2692.8 3.9 Habitat 4 24533.1 35.5 Habitat 5 1072.8
Universitat Autònoma de Barcelona Facultat de Filosofia i Lletres Departament de Prehistòria Doctorat en arqueologia prehistòrica
 Universitat Autònoma de Barcelona Facultat de Filosofia i Lletres Departament de Prehistòria Doctorat en arqueologia prehistòrica FROM MICRO TO MACRO SPATIAL DYNAMICS IN THE VILLAGGIO DELLE MACINE BETWEEN
Extensibility of Measurement Results of Point Samples of the Soil Protection Information and Monitoring System by different methods
 Extensibility of Measurement Results of Point Samples of the Soil Protection Information and Monitoring System by different methods L. Várallyai a, B. Kovács b, and J. Prokisch b a University of Debrecen,
Outline. Introduction to SpaceStat and ESTDA. ESTDA & SpaceStat. Learning Objectives. Space-Time Intelligence System. Space-Time Intelligence System
 Outline I Data Preparation Introduction to SpaceStat and ESTDA II Introduction to ESTDA and SpaceStat III Introduction to time-dynamic regression ESTDA ESTDA & SpaceStat Learning Objectives Activities
Integrating Open-Source Statistical Packages with ArcGIS
 Esri International User Conference San Diego, California Technical Workshops 7-25-12 Integrating Open-Source Statistical Packages with ArcGIS Mark V. Janikas, Ph. D. Xing Kang Outline Introduction to Spatial
Innovation in Geology and Earth Sciences with ArcGIS. Presented by: Mike Price Entrada/San Juan, Inc. Blaine, WA
 Innovation in Geology and Earth Sciences with ArcGIS Presented by: Mike Price Entrada/San Juan, Inc. Blaine, WA Organization Overview Entrada/San Juan is a GIS consultancy based in Blaine, WA Industries
Lecture 2. A Review: Geographic Information Systems & ArcGIS Basics
 Lecture 2 A Review: Geographic Information Systems & ArcGIS Basics GIS Overview Types of Maps Symbolization & Classification Map Elements GIS Data Models Coordinate Systems and Projections Scale Geodatabases
Daniel Fuller Lise Gauvin Yan Kestens
 Examining the spatial distribution and relationship between support for policies aimed at active living in transportation and transportation behavior Daniel Fuller Lise Gauvin Yan Kestens Introduction
Spatial Pattern Analysis: Mapping Trends and Clusters
 2013 Esri International User Conference July 8 12, 2013 San Diego, California Technical Workshop Spatial Pattern Analysis: Mapping Trends and Clusters Lauren Rosenshein Bennett Brett Rose Presentation