Cartography: Modeling GIS data for Mapmaking. Aileen Buckley, Ph.D. Senior Cartographic Researcher, ESRI. Barbara Buttenfield, Ph.D.
|
|
|
- Percival Bishop
- 5 years ago
- Views:
Transcription
1 Slide 1 Cartography: Modeling GIS data for Mapmaking Aileen Buckley, Ph.D. Senior Cartographic Researcher, ESRI Barbara Buttenfield, Ph.D. Professor, University of Colorado-Boulder Thank you coming to learn more about how to model GIS data for map making. My name is Aileen Buckley, I m a cartographic researcher at ESRI and for the past two plus years I have been working with Charlie Frye on the development of the data model for multipurpose multiscale mapping. Charlie is head of the Cartography Research Team at ESRI and has been working on the development of this data model for almost four years now. (Point out Charlie.) We have also been working with Barbara Buttenfield and her students from the University of Colorado-Boulder. Before we get started, babs and I will take a few minutes to introduce ourselves and then we would like to learn a little more about all of you.
2 Slide 2 What kind of maps do you make? Special Use Maps Trail Map Bike Map Reference Maps Topo Map Atlas Reference Map Analysis Results Suitability Map Crime Hot Spots Thematic Maps Census Data Atlas Thematic Map Ask the audience about themselves: How many make maps regularly? How many use only GIS software to do that? How many have a database background? How many attended the Cartography: Making Better Maps session in the morning today? Other questions?
3 Slide 3 Agenda for Seminar 1:30-2:05 Introduction Part 1: Differences between GIS data and cartographic data Part 2a: Describing cartographic workflows 2:05-2:20 Exercise 2:20-2:45 Part 2b: Modeling GIS data to support cartographic workflows 2:45-3:00 Exercise 3:00-3:30 Break 3:30-3:50 Part 3a: Cartographic data model 3:50-4:05 Exercise 4:05-4:30 Part 3b: Supporting multi-scale multi-purpose mapping Part 4: Cartographic workflows in practice 4:30-4:45 Exercise 4:45-5:00 Conclusion Before we get started, let s go over the schedule for today s seminar as well as a few logistics. Schedule Restrooms Break
4 Slide 4 Pre-conference seminar materials Slides Exercises Cartography Data Model Cartography Tables References Web URL Because we cannot go into as much detail as we would like in the time we have together, we have provided you with lots of resources that you can take with you and refer to later. These are compiled in the book you have in front of you. In additional to all the slides you will see today, and their related notes, you also have the exercise worksheets and all the answers (don t peek at these until after the exercises are complete!), the data model poster and schema, an example Cartography table, and a list of references that you can draw on, including those you can find on the ESRI web site.
5 Slide 5 Part 1 Differences between GIS data and cartographic data 15 MINUTES
6 Slide 6 Differences between GIS and cartographic data Processing cartographic data is different from processing GIS data Representations of data for graphic display Symbols Labels Geoprocessing for cartography not spatial analysis Classification Selection by attribute Selection by size Changing the view on the data as opposed to changing the data in the database Let s start by talking about how GIS data and cartographic data are different. One thing that distinguishes cartographic and GIS data are the types of processes used to manipulate the data and more importantly the purposes of the processes. With GIS data, the objective is often either data management of data analysis. With cartographic data, the processes are used to modify the data so it can be displayed graphically, that is, optimized for symbology and labeling. Sometimes we use the same geoprocessing tools as for analysis, such as classification and selection, but the aim for cartography is to get the best representation of the data for display on a map. In essence, the goal is to modify the view of the data but not necessarily modify the original data in the database.
7 Slide 7 In other words, we change the representation of the features but not the features themselves.
8 Slide 8 Changing the representation changes the message For analysis dissolve roads so you can validate connectivity in the network For cartography dissolve roads so you can use a continuous road symbol When we change the representation of the data, we change its meaning. The meaning in a cartographic sense is related to how the features are displayed and understood by the map reader. For example, if we were to try and map roads with a dashed line symbol, we might first want to dissolve the roads to make them fewer features. That way, the dashed line will look more continuous. Alternatively, for GIS analysis, you might dissolve the roads to learn more their network characteristics.
9 Slide 9 Here we can see how changing the representation of roads allows for a better cartographic display.

10 Slide 10 Alternate example: DEM Terrain Analysis For analysis hydrologic flow analysis with flow accumulation to create a stream network For cartography construct contours from DEM
11 Slide 11 So what happens is this: The GIS data is sort of like the wire frame of the data. The cartographic data is modified so it can be presented on a map, complete with symbols and labels, and potentially also geoprocessed in preparation for graphic display.
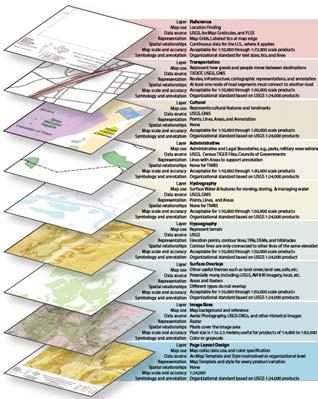
12 Slide 12 Digital Landscape Models Cartographic Modifications and Enhancements Digital Cartographic Models Map Production Map / Atlas Products 1 km km DLM resolution DCM_10Million 10M World Wall Map DCM_250K 250K Road Map DCM_100K 100K Recreation Map m DLM resolution DCM_50K 50K Wall Map DCM_Campus10K 10K Campus Map Derived DLM 10m DCM_10Ktopo 10K OS Topo Map Series 5 m resolution DL:M DCM_5K 5K OS Base Map Real World Geoprocessing Cartographic Finishing A longstanding issue for cartographers is that national mapping agencies don t have compiled DLMs the data we work with is compiled from paper maps. There are a couple of impacts from this: the data we use is already tied to a particular map product, and cartographic enhancements and modifications are so deeply embedded in the database that it shard to distinguish the rules for collection from the specifications for mapping.
13 Slide 13 DLM - DCM Digital Landscape Model or DLM GIS database (wire frame model) compiled from source information registered to the ground several standardized scales accuracy and resolution are of primary concern Digital Cartographic Model or DCM stored in a product database (for a map) enhanced and modified from DLM specific to a map s purpose graphic clarity and visual integrity are of primary concern To help distinguish between these two types of data, we sometimes use the terms digital landscape model and digital cartographic model. The digital landscape model is that wire frame representation of the data. It is the GIS data that was complied from a source that can be referenced to the ground. It may come in several standardized scales that relate to the requirements of the organization or agency collecting the data. For the GIS data, positional and attribute accuracy are of primary concern and adequate resolution of the data is required for its various applications. The digital cartographic model is a product database that is derived for a specific map product. It contains often a subset of data from the digital landscape model that has been enhanced or modified for the map s purpose. Because the data are used for mapping, the primary concern for digital cartographic data is graphic clarity and visual integrity.
14 Slide 14 Types of maps High Number of map features (and the subsequent complexity of relationships among them) Special Use Maps Trail Map Bike Map Analysis Results Suitability Map Crime Hot Spots Reference Maps Topo Map Atlas Reference Map Thematic Maps Census Data Atlas Thematic Map Low Low Number of users and uses (indicates the level of general application) High Introduce the concept of lots of maps that can come from one DLM.

15 Slide 15 GIS database Source -> DLM -> DCM Real world example: Orthophotos, satellite imagery, LIDAR and DEM data are examples of the data that would be in the DLM these is used as source data to create the base polygon, vector and line feature datasets. Different types of maps could be created from the DLM data this results in DCM data. The GIS database can contain all of this information.

16 Slide 16 Multiple DCM products Terrain analysis Traditional topographic views

17 Slide 17 Multiple DCM products Town planning Infrastructure development

18 Slide 18 Multiple DCM products Land cover analysis Site suitability
19 Slide 19 Summarizing Part 1 Processing cartographic data is different from processing GIS data The intent is to change the view on the data as opposed to change the data in the database Changing the representation changes the message DLM = GIS database; DCM = map product database Lots of maps and their DCMs can come from one DLM
20 Slide 20 Digital Landscape Models Cartographic Modifications and Enhancements Digital Cartographic Models Map Production Map / Atlas Products Derived 50 DLM 50 m Rules Rules DCM_10Ktopo Model Generalization Derived 10 DLM 10 m Rules DCM_Campus10K DCM_10Kweb Selection Rules Generalization Restructuring the data 3 rd rd Party Datasets DLM Archive DB DLM Archive DB Rules DDMS Landline DB Real World Object Generalization Source data Rules MasterMap Ordnance Survey Great Britain example.
21 Slide 21 Part 2a Describing cartographic workflows 10 MINUTES
22 Slide 22 Describing cartographic workflows The workflows are intended to transform information DLM -> DCM -> final map product As you go through the transformations, you: move from multi-purpose to targeted use may move across limited scale ranges Design the workflow and model the data before you go into production
23 Slide 23 Information transformations in cartography DATA COLLECTION CARTOGRAPHY MAP USE Transform 1 Transform 2 Transform 3 Geographical environment Geospatial data Map Map image Census Ground survey GPS Remote sensing Digitizing Selection Generalization Symbolization Labeling Reading Analysis Interpretation
24 Slide 24 Cartographic data modeling for map production Geographical environment Conceptual data model ArcGIS geodatabase 250K Road Map 10K Campus Map GIS data model + Workflow Map products 10K OS Topo Map Series 5K OS Base Map Map production process
25 Slide 25 DLM DCM data production workflow Small R4 R8 R7 DLM DCM Derived data model Map scale R5 R6 R3 R2 R1 Large Small Number of users Large
26 Slide 26 Map customer and map purpose Graphic ideation Graphic plan Map conceptualization process Graphic refinement REFINEMENT Map conceptualization Map Publication Final product Workflow Map production process Cartographic data model ArcGIS geodatabase Conceptual data model Geographical environment In summary, we can see that it is now possible to see how cartographic data modeling and workflows fit together with map conceptualization. Map making is not a linear process, and simply stringing together the decisions made to conceptualize the map and model the data does not usually result in a product that is satisfactory to the cartographer the first time through. Once the results of the various graphic decisions can be seen simultaneously, multiple iterations of the map are often made in an effort to refine the graphic display. The map maker may choose to refine the initial concept (in which case the loop cycles back through the map conceptualization process) or the map symbolization (in which case the loop cycles through the map production but not the conceptualization process). With this more complete picture of fluid process of map making, it is now possible to apply this understanding in the automation of map production. It is can then be determined to what extent the information model for maps supports map making.
27 Slide 27 Exercise Discuss how mapping is integrated into your GIS production workflow Map product specifications GIS data or cartographic data? To what extent is your cartographic workflow modeled? By whom?
28 Slide 28 Part 2b Modeling GIS data to support cartographic workflows 25 MINUTES
29 Slide 29 Modeling GIS data to support cartographic workflows What does this all look like in an ArcGIS environment? What themes are relevant for the map purpose? What cartographic features? What cartographic attributes? How do you modify the DLM to create the DCM? We talked about GIS data to cartographic data This is where the cartographic geoprocessing happens
30 Slide 30
31 Slide 31 Cartographic attributes Any Feature Class Geom ID Attributes... Type Coded Value Domain Description... Prison Description... Park Description... Cemetery Description... Mall 4 Description... Strip Mall Each Type of Cartographic Feature has a number and a description in the Coded Value domain. Integer value in the feature class is faster to display. In an ArcGIS environment -- how do you enrich the data? Through attribute enhancement. This leads to the development of Coded Value domains. At this point, you can take a look at the example domains at the end of this handout.


32 Slide 32 Symbols Labels In a relational environment, you do this through table joins and relationship classes. For representation, you would attach symbols and labels to the features through these types of joins and relationships.


33 Slide 33 Example: Cultural CFTID CFTID CFTID CFTID CFTID CFTID Example from one particular theme Cultural features.
34 Slide 34 Cultural Cultural Features (Buildings, Areas, Points of Interest) Type (how to symbolize and for some kinds of cultural features, it is the label) Name (for label) Size or Area (used to set threshold for which features are shown) You may have the attributes you need in your database through a relationship to a table but for mapping, you need to pull them directly into the DCM so they draw more quickly. For example, export the DLM data to a new feature class delete the fields you don t need, add the fields you do need and populate them, make sure they are in the format that you need them in (e.g., concatenate the fields if you need to).
35 Slide 35 Boundaries Boundary Lines (any level) Type (how to symbolize) L_Name (left/upper label) R_Name (right/lower label) Annotation must be produced to ensure proper identification Legal Areas (any type) Type (how to symbolize and what kind of label) Name (for label) WithinMSA (Boolean for drawing/labeling) City Points Name (how to label) Size (how to symbolize and label) Special Type (how to label or symbolize) WithinMSA (Boolean for drawing/labeling)
36 Slide 36 Transportation Roads Class (how to symbolize) Type (determine correct kind of label) Name (for text labels) Highway Route Number (for highway labels) UrbanRural (for multipurpose data which may be represented differently within urban areas) Label String (store exactly what is to be labeled and then the Name does not need to be edited/compromised) Railroads Type (how to symbolize) Owner (how to label)
37 Slide 37 Hydrography Area Features Name (how to label) Type (how to symbolize and which features to label, and sometimes is the label) Area (used to set threshold for which features are shown) Line Features Name (how to label) Type (how to symbolize) Size, Discharge, or Level (how to symbolize or as a filter for which features to show dendritic branch count and Stream Order are not useful here)
38 Slide 38 Surface Overlays Land cover/land use/zoning/flood zones/homeland security (risk), etc. Type (how to symbolize) Abbreviated Type (for labeling, e.g., soils, surface geology, etc.) Area (used to set threshold for which features are shown or get labels) Uncertainty (used to modify symbology of either features or labels to show reliability, etc.)
39 Slide 39 Terrain Contours Elevation (for labels) Units (for labels or conversion when mix of data is present) Type (for symbol, includes index, intermediate, depression, etc.) LabelYN (optional: for determining whether to draw a gap or a line, gaps are where labels get placed) Spot Elevations Type (how to symbolize) Elevation (part of label) Units (part of label)
40 Slide 40 DEM Elevation Raster Elevation (how to symbolize) Hillshade Raster Value (how to symbolize)
41 Slide 41 Summarizing Part 2 The workflows are intended to transform information DLM -> DCM -> final map product As you go through the transformations, you: move from multi-purpose to targeted use may move across limited scale ranges Design the workflow and model the data before you go into production Modeling GIS data to support cartographic workflows What does this all look like in an ArcGIS environment? What themes are relevant for the map purpose? What cartographic features? What cartographic attributes? How do you modify the DLM to create the DCM? We talked about GIS data to cartographic data This is where the cartographic geoprocessing happens What are cartographic attributes for each of the feature classes?
42 Slide 42 Exercise 2:45-3:00 Scenario specify the DCM requirements for a bike map One of these maps tourists, participants, organizers Each group describe all themes Compile the answers together
43 Slide 43 Break 3:00-3:30
44 Slide 44 Part 3 Cartographic data model 20 MINUTES
")

45 Slide 45 Cartographic Data Model Cartographic Feature Types Symbols and Labels Cartography Table Links the feature to its map representation (symbol + label) Construct the Basemap Data Model together Let s construct the Cartography Data Model together. The Cartography Table joins to the DCM feature classes that will be on the map.
46 Slide 46 Cartographic Feature Type A type of feature on the map that has unique symbology and/or labeling
47 Slide 47 Cartographic Feature Type ID (CFTID) in the Cartography Table Each cartographic feature type has a Unique ID Unique description The cartographic feature type is a database feature that is used in cartographic abstraction to communicate the position and characteristics of geographic features and their relationships. The special thing about these features is that they are the features on the map which may or may not be the same as the features you use for spatial data inventory or analysis. For example, on a topographic map, you will often see the hypsography symbolized with contour lines. The rules for this representation of elevation -- that is, color and width of the lines and font size and style of the labels -- are stored in the Cartography Table. On the other hand, you might be interested in using hypsography for analysis, say in watershed analysis -- in this case, you would likely use the digital model of the terrain the DEM -- instead of the cartographic representation. The Cartographic Feature Types in the table are unique and each cartographic feature type is identified by a CFT_ID. Associated with each feature type is a unique description. These CFTs and their descriptions encompass what is sometimes called a complex domain that is, it contains the definition of both features and their valid attributes. This table provides the content for the coded value domain that can be used with the geodatabase and the table is also separated into domains for each feature types
48 so that there is no duplication and there is completeness, so the table is normalized overall.
49 Slide 48 Cartographic Feature Types (CFTs) in the Cartography Table Feature class Feature geometry Cartographic Feature Type (CFT) ID & description Each row defines one CFT it has a feature geometry, it has a unique description and you can see what would be shown on the map.
50 Slide 49 Label specifications Contain the rules for labeling a specific Cartographic Feature Type
51 Slide 50 Label specs in the Cartography Table Feature class Feature geometry Cartographic Feature Type (CFT) ID & description Label text Label specifications
52 Slide 51 Symbol specifications Contain the rules for symbolizing a specific Cartographic Feature Type
53 Slide 52 Symbols Contained in a Microsoft Access database Named for each Cartographic Feature Type (CFT)
54 Slide 53 Symbol Specs in the Cartography Table Feature class Feature geometry Cartographic Feature Type (CFT) ID & description Symbol specifications Label text Label specs


55 Slide 54 The completed Cartography Table in the Base Map Data Model
56 Slide 55 Summarizing the Cartographic Data Model Identify the cartographic features Assign a unique CFTID and description Assign symbology Assign labeling Compile the info into the Cartography Table
57 Slide 56 Exercise 3:50-4:05 Bike map define the symbology and labeling specifications Define these: Race route Roads Landmarks Facilities (restrooms, restaurants, toilets, First Aid, etc ) Terrain
58 Slide 57 Part 3b Supporting multi-scale multi-purpose mapping 10 MINUTES
59 Slide 58 Supporting multi-purpose multi-scale mapping Cartography Table content can be extended across scales and across purposes Add rows and columns to Cartography Table Rows -- Add new cartographic feature types Columns -- Alternate symbology and labeling multi-scale & multi-purpose SQL query strings Definition queries for filtering Label strings for labeling We have the Cartography Data Model and now we want to extend this to support multiscale multi-purpose mapping. This is simple. Simply add new columns (for symbol and label changes) and rows (for new features on the map). And you may need to create new styles.


60 Slide 59 Scales Labels/ Anno Features Notes First conceptualize what you want on the map at the various scales. The point is to conceptualize before you start going through the process. First figure out what gets added at what scales, then what the representation is pt, line, poly, text. You do this outside of a database environment this is a conceptualization exercise.


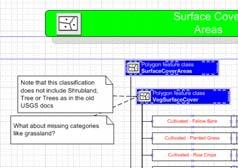
61 Slide 60 Surface Cover And you do this for all the map layers that you need for your map.
62 Slide 61 Other specifications in the Cartography Table Definition Queries This selects the features to be shown on the map at a particular scale SQL Query Strings This defines which features are being labeled Label Expressions This defines how a label looks and which attributes are used to construct it Scale Range This specifies the scale at which the features will be shown We are essentially separating design from production hopefully leads to less individual refinement. Much of this work goes on outside the ArcGIS environment with a view towards the ability to implement it within ArcGIS at some point.
63 Slide 62 Part 4 Cartographic workflows in practice 15 MINUTES
64 Slide 63 Example Here s what you selected Here s how you want to symbolize them Here s the Cartography Table looks like Here s what the CFTIDs look like Here s what the style and the spec in the CT looks like Here s what the text and the spec in the CT looks like Here s the final map This will now allow you to move from the original base map data model to be able to create multiple maps with multiple scales and purposes.
65 Slide 64 Exercise Discussion Q&A Exit poll What parts of this process might be the most problematic in your organization? What parts do you think might be most challenging for noninstitutional reasons? Go through various examples Walk through the lineage of DLM to some carto feature types (contours, interstate hwy from the Census database from CFCC add name, extract some features using calculate statement)
66 Slide 65 CONCLUSION 5 MINUTES
67 Slide 66 Parting words Have a plan -> start from a product Incorporate mapping into your current workflow Data compilation / analysis / production Work with cartographers / project manager / DBAs
68 Slide 67 Resources Existing resources Slides Exercises Through the ESRI web site - Base map data model web page Cartographic Data Model Cartography Tables Geoprocessing tools, models, scripts also on Geoprocessing web page Case studies Best cartographic practices User community Case studies / best cartographic practices Geoprocessing tools, models, scripts Model & schema
69 Slide 68 Other sessions For data modeling: Cartographic data model session Data Modeling for Large-scale Maps ands Map Production Wed 7/27 1:30-3:00 Other data model sessions Address data model for names management -- Wed 7/27 10:30-12:00 ArcHydro data model for understanding a data model and seeing how it can be consumed cartographically For map production: Cartography technical sessions PLTS sessions Production Line Tool Set
70 Slide 69 > Downloads > Data Models > Downloads > Geoprocessing
Aileen Buckley, Ph.D. and Charlie Frye
 An Information Model for Maps: Towards Production from GIS Databases Aileen Buckley, Ph.D. and Charlie Frye Researchers, ESRI GIS vs. cart GIS Outline of the presentation Introduction Differences between
An Information Model for Maps: Towards Cartographic Production from GIS Databases
 An Information Model for s: Towards Cartographic Production from GIS Databases Aileen Buckley, Ph.D. and Charlie Frye Senior Cartographic Researchers, ESRI Barbara Buttenfield, Ph.D. Professor, University
Multiple Representations of Geospatial Data: A Cartographic Search for the Holy Grail
 Multiple Representations of Geospatial Data: A Cartographic Search for the Holy Grail Barbara P. Buttenfield University of Colorado, Boulder babs@colorado.edu Collaboration with Cindy Brewer, Penn State
ArcGIS Data Models: Multiscale Topographic Maps. Charlie Frye Aileen Buckley
 ArcGIS Data Models: Multiscale Topographic Maps Charlie Frye Aileen Buckley Other cartography sessions ArcGIS ArcMap: Introduction to ArcMap Wed 1:30 PM, 6F ArcGIS Cartography: Map Design and Page Layout
Designing GIS Databases to Support Mapping and Map Production Charlie Frye, ESRI Redlands Aileen Buckley, ESRI Redlands
 Designing GIS Databases to Support Mapping and Map Production Charlie Frye, ESRI Redlands Aileen Buckley, ESRI Redlands 1 Designing GIS Databases to Support Mapping and Map Production Charlie Frye, ESRI
Esri s Living Atlas of the World Community Maps
 Esri s Living Atlas of the World Community Maps Seth Sarakaitis Wednesday May 7, 2014 ArcGIS Living Atlas Concept Living Atlas Content Tour Contributing to the Living Atlas (Community Maps) Seth Sarakaitis
Introducing GIS analysis
 1 Introducing GIS analysis GIS analysis lets you see patterns and relationships in your geographic data. The results of your analysis will give you insight into a place, help you focus your actions, or
MODELING ACTIVE DATABASE-DRIVEN CARTOGRAPHY WITHIN GIS DATABASES
 Page 1 of 7 MODELING ACTIVE DATABASE-DRIVEN CARTOGRAPHY WITHIN GIS DATABASES Abstract Charlie Frye and Cory L. Eicher ESRI, 380 New York Street, Redlands, CA 92373 GIS databases contain classes of features
Performing Advanced Cartography with Esri Production Mapping
 Esri International User Conference San Diego, California Technical Workshops July 25, 2012 Performing Advanced Cartography with Esri Production Mapping Tania Pal & Madhura Phaterpekar Agenda Outline generic
Performing Map Cartography. using Esri Production Mapping
 AGENDA Performing Map Cartography Presentation Title using Esri Production Mapping Name of Speaker Company Name Kannan Jayaraman Agenda Introduction What s New in ArcGIS 10.1 ESRI Production Mapping Mapping
Data Aggregation with InfraWorks and ArcGIS for Visualization, Analysis, and Planning
 Data Aggregation with InfraWorks and ArcGIS for Visualization, Analysis, and Planning Stephen Brockwell President, Brockwell IT Consulting, Inc. Join the conversation #AU2017 KEYWORD Class Summary Silos
Local Government Basemaps using ArcGIS
 Local Government Basemaps using ArcGIS Steve Grisé Scott Oppmann Tuesday, July 14, 10:15-11:30am SDCC 30B Topics Basemaps for Local Government Essential Application-Driven New Ideas Design Strategies Discussion
Basics of GIS. by Basudeb Bhatta. Computer Aided Design Centre Department of Computer Science and Engineering Jadavpur University
 Basics of GIS by Basudeb Bhatta Computer Aided Design Centre Department of Computer Science and Engineering Jadavpur University e-governance Training Programme Conducted by National Institute of Electronics
Esri Production Mapping: Map Automation & Advanced Cartography MADHURA PHATERPEKAR JOE SHEFFIELD
 Esri Production Mapping: Map Automation & Advanced Cartography MADHURA PHATERPEKAR JOE SHEFFIELD Traditional Cartography What you really want Cartographic Workflow Output Cartographic Data Symbology Layout
HIGH RESOLUTION BASE MAP: A CASE STUDY OF JNTUH-HYDERABAD CAMPUS
 HIGH RESOLUTION BASE MAP: A CASE STUDY OF JNTUH-HYDERABAD CAMPUS K.Manjula Vani, Abhinay Reddy, J. Venkatesh, Ballu Harish and R.S. Dwivedi ABSTRACT The proposed work High Resolution Base map: A Case study
Applied Cartography and Introduction to GIS GEOG 2017 EL. Lecture-2 Chapters 3 and 4
 Applied Cartography and Introduction to GIS GEOG 2017 EL Lecture-2 Chapters 3 and 4 Vector Data Modeling To prepare spatial data for computer processing: Use x,y coordinates to represent spatial features
DP Project Development Pvt. Ltd.
 Dear Sir/Madam, Greetings!!! Thanks for contacting DP Project Development for your training requirement. DP Project Development is leading professional training provider in GIS technologies and GIS application
GED 554 IT & GIS. Lecture 6 Exercise 5. May 10, 2013
 GED 554 IT & GIS Lecture 6 Exercise 5 May 10, 2013 Free GIS data sources ******************* Mapping numerical data & Symbolization ******************* Exercise: Making maps for presentation GIS DATA SOFTWARE
Creating Basemaps to Manage Buildings and Facilities
 Esri International User Conference San Diego, California Technical Workshops July 26, 2012 Creating Basemaps to Manage Buildings and Facilities Mark Stewart and Tamara Yoder Topics for this Session Overview
ArcGIS for Desktop. ArcGIS for Desktop is the primary authoring tool for the ArcGIS platform.
 ArcGIS for Desktop ArcGIS for Desktop ArcGIS for Desktop is the primary authoring tool for the ArcGIS platform. Beyond showing your data as points on a map, ArcGIS for Desktop gives you the power to manage
Innovation. The Push and Pull at ESRI. September Kevin Daugherty Cadastral/Land Records Industry Solutions Manager
 Innovation The Push and Pull at ESRI September 2004 Kevin Daugherty Cadastral/Land Records Industry Solutions Manager The Push and The Pull The Push is the information technology that drives research and
Experiences and Directions in National Portals"
 FIG Seminar on e-land Administration Innsbruck/Austria 2-4 June 2004 "ESRI's Experiences and Directions in National Portals" Kevin Daugherty Cadastral/Land Records Manager ESRI Topic Points Technology
DATA APPLIANCE FOR ARCGIS
 DATA APPLIANCE FOR ARCGIS Data Appliance for ArcGIS Provides Access to Multi-Scale Basemaps Down to Medium Scale Levels Worldwide And Large Scale for Most of the World The Data Appliance includes Several
GIS FOR PLANNING. Course Overview. Schedule. Instructor. Prerequisites. Urban Planning 792 Thursday s 5:30-8:10pm SARUP 158
 GIS FOR PLANNING Urban Planning 792 Thursday s 5:30-8:10pm SARUP 158 Schedule Class/Lab - SARUP 158 Thursdays 5:30pm - 8:10pm Office Hours - By Appointment Project Ideas - Week 4 Final - 5/10/2018 Instructor
Getting Started with Community Maps
 Esri International User Conference San Diego, California Technical Workshops July 24, 2012 Getting Started with Community Maps Shane Matthews and Tamara Yoder Topics for this Session ArcGIS is a complete
Geodatabase An Introduction
 2013 Esri International User Conference July 8 12, 2013 San Diego, California Technical Workshop Geodatabase An Introduction David Crawford and Jonathan Murphy Session Path The Geodatabase What is it?
ENV208/ENV508 Applied GIS. Week 1: What is GIS?
 ENV208/ENV508 Applied GIS Week 1: What is GIS? 1 WHAT IS GIS? A GIS integrates hardware, software, and data for capturing, managing, analyzing, and displaying all forms of geographically referenced information.
Geodatabase Essentials Part One - Intro to the Geodatabase. Jonathan Murphy Colin Zwicker
 Geodatabase Essentials Part One - Intro to the Geodatabase Jonathan Murphy Colin Zwicker Session Path The Geodatabase - What is it? - Why use it? - What types are there? Inside the Geodatabase Advanced
Display data in a map-like format so that geographic patterns and interrelationships are visible
 Vilmaliz Rodríguez Guzmán M.S. Student, Department of Geology University of Puerto Rico at Mayagüez Remote Sensing and Geographic Information Systems (GIS) Reference: James B. Campbell. Introduction to
Administering your Enterprise Geodatabase using Python. Jill Penney
 Administering your Enterprise Geodatabase using Python Jill Penney Assumptions Basic knowledge of python Basic knowledge enterprise geodatabases and workflows You want code Please turn off or silence cell
NR402 GIS Applications in Natural Resources
 NR402 GIS Applications in Natural Resources Lesson 1 Introduction to GIS Eva Strand, University of Idaho Map of the Pacific Northwest from http://www.or.blm.gov/gis/ Welcome to NR402 GIS Applications in
Data Modeling for Large Scale Maps and Map Production
 Slide 1 Data Modeling for Large Scale Maps and Map Production Charlie Frye, ESRI Redlands Aileen Buckley, PhD, ESRI Redlands Cartographic Research and Special Projects Group Abstract: In this session,
Base Maps: Creating, Using & Participating
 Base Maps: Creating, Using & Participating Michael Fashoway & Erin Geraghty Montana Base Map Service Center 2010 MAGIP Technical Session October 28, 2010 What is a Base Map? Using a Base Map Creating a
Fundamentals of ArcGIS Desktop Pathway
 Fundamentals of ArcGIS Desktop Pathway Table of Contents ArcGIS Desktop I: Getting Started with GIS 3 ArcGIS Desktop II: Tools and Functionality 5 Understanding Geographic Data 8 Understanding Map Projections
Delineation of Watersheds
 Delineation of Watersheds Adirondack Park, New York by Introduction Problem Watershed boundaries are increasingly being used in land and water management, separating the direction of water flow such that
Louisiana Transportation Engineering Conference. Monday, February 12, 2007
 Louisiana Transportation Engineering Conference Monday, February 12, 2007 Agenda Project Background Goal of EIS Why Use GIS? What is GIS? How used on this Project Other site selection tools I-69 Corridor
You are Building Your Organization s Geographic Knowledge
 You are Building Your Organization s Geographic Knowledge And Increasingly Making it Available Sharing Data Publishing Maps and Geo-Apps Developing Collaborative Approaches Citizens Knowledge Workers Analysts
Quality and Coverage of Data Sources
 Quality and Coverage of Data Sources Objectives Selecting an appropriate source for each item of information to be stored in the GIS database is very important for GIS Data Capture. Selection of quality
Introduction-Overview. Why use a GIS? What can a GIS do? Spatial (coordinate) data model Relational (tabular) data model
 data model Relational (tabular) data model") Introduction-Overview Why use a GIS? What can a GIS do? How does a GIS work? GIS definitions Spatial (coordinate) data model Relational (tabular) data model intro_gis.ppt 1 Why use a GIS? An extension
Introduction-Overview Why use a GIS? What can a GIS do? How does a GIS work? GIS definitions Spatial (coordinate) data model Relational (tabular) data model intro_gis.ppt 1 Why use a GIS? An extension
GIS Quick Facts. CIVL 1101 GIS Quick Facts 1/5.
 CIVL 1101 1/5 What is GIS? Geographic Information Systems (GIS) provide a platform for displaying and analyzing spatial data. GIS systems allow you to view multiple layers of data simultaneously. GIS is
ArcGIS Pro: Essential Workflows STUDENT EDITION
 ArcGIS Pro: Essential Workflows STUDENT EDITION Copyright 2018 Esri All rights reserved. Course version 6.0. Version release date August 2018. Printed in the United States of America. The information contained
Esri Defense Mapping: Cartographic Production. Bo King
 Esri Defense Mapping: Cartographic Production Bo King Agenda Esri Defense Mapping: Cartographic Production Solution Overview Desktop Cartographic Production Workflow - Create Rapid Graphic Product On Demand
In this exercise we will learn how to use the analysis tools in ArcGIS with vector and raster data to further examine potential building sites.
 GIS Level 2 In the Introduction to GIS workshop we filtered data and visually examined it to determine where to potentially build a new mixed use facility. In order to get a low interest loan, the building
Introduction to Geographic Information Systems (GIS): Environmental Science Focus
: Environmental Science Focus") Introduction to Geographic Information Systems (GIS): Environmental Science Focus September 9, 2013 We will begin at 9:10 AM. Login info: Username:!cnrguest Password: gocal_bears Instructor: Domain: CAMPUS
Introduction to Geographic Information Systems (GIS): Environmental Science Focus September 9, 2013 We will begin at 9:10 AM. Login info: Username:!cnrguest Password: gocal_bears Instructor: Domain: CAMPUS
Geometric Algorithms in GIS
 Geometric Algorithms in GIS GIS Software Dr. M. Gavrilova GIS System What is a GIS system? A system containing spatially referenced data that can be analyzed and converted to new information for a specific
Pierce Cedar Creek Institute GIS Development Final Report. Grand Valley State University
 Pierce Cedar Creek Institute GIS Development Final Report Grand Valley State University Major Goals of Project The two primary goals of the project were to provide Matt VanPortfliet, GVSU student, the
Spatial Analysis with Web GIS. Rachel Weeden
 Spatial Analysis with Web GIS Rachel Weeden Agenda Subhead goes here Introducing ArcGIS Online Spatial Analysis Workflows Scenarios Other Options Resources ArcGIS is a Platform Making mapping and analytics
Geodatabase An Overview
 Federal GIS Conference February 9 10, 2015 Washington, DC Geodatabase An Overview Ralph Denkenberger - esri Session Path The Geodatabase - What is it? - Why use it? - What types are there? Inside the Geodatabase
An Introduction to the Community Maps Information Model
 Esri International User Conference July 23 27 San Diego Convention Center An Introduction to the Community Maps Information Model Seth Sarakaitis Agenda Overview of Community Maps Program Information Models
These modules are covered with a brief information and practical in ArcGIS Software and open source software also like QGIS, ILWIS.
 Online GIS Training and training modules covered are: 1. ArcGIS, Analysis, Fundamentals and Implementation 2. ArcGIS Web Data Sharing 3. ArcGIS for Desktop 4. ArcGIS for Server These modules are covered
A Review: Geographic Information Systems & ArcGIS Basics
 A Review: Geographic Information Systems & ArcGIS Basics Geographic Information Systems Geographic Information Science Why is GIS important and what drives it? Applications of GIS ESRI s ArcGIS: A Review
GIS CONCEPTS ARCGIS METHODS AND. 3 rd Edition, July David M. Theobald, Ph.D. Warner College of Natural Resources Colorado State University
 GIS CONCEPTS AND ARCGIS METHODS 3 rd Edition, July 2007 David M. Theobald, Ph.D. Warner College of Natural Resources Colorado State University Copyright Copyright 2007 by David M. Theobald. All rights
Geodatabase An Introduction
 Federal GIS Conference 2014 February 10 11, 2014 Washington DC Geodatabase An Introduction Ralph Denkenberger esri Session Path The Geodatabase - What is it? - Why use it? - What types are there? Inside
ArcGIS Tools for Professional Cartography
 ArcGIS Tools for Professional Cartography By Makram Murad-al-shaikh M.S. Cartography Senior instructor ESRI Educational Services ICC - A Coruña - Spain, 9-16 July, 2005 Overview Overview of the ArcGIS
Multiple Representations of Geospatial Data: A Cartographic Search for the Holy Grail?
 Multiple Representations of Geospatial Data: A Cartographic Search for the Holy Grail? Barbara P. Buttenfield University of Colorado Boulder Research Faculty Affiliate, USGS-CEGIS babs@colorado.edu 13
Esri UC2013. Technical Workshop.
 Esri International User Conference San Diego, California Technical Workshops July 9, 2013 CAD: Introduction to using CAD Data in ArcGIS Jeff Reinhart & Phil Sanchez Agenda Overview of ArcGIS CAD Support
Acknowledgments xiii Preface xv. GIS Tutorial 1 Introducing GIS and health applications 1. What is GIS? 2
 Acknowledgments xiii Preface xv GIS Tutorial 1 Introducing GIS and health applications 1 What is GIS? 2 Spatial data 2 Digital map infrastructure 4 Unique capabilities of GIS 5 Installing ArcView and the
USGS Community Engagement and its Role in Improving The National Map
 USGS Community Engagement and its Role in Improving The National Map ESRI User Conference, 2014 Bob Davis Carol Ostergren Drew Decker USGS Strategic Direction Provides a sharpened focus on our topographic
ESRI Survey Summit August Clint Brown Director of ESRI Software Products
 ESRI Survey Summit August 2006 Clint Brown Director of ESRI Software Products Cadastral Fabric How does Cadastral fit with Survey? Surveyors process raw field observations Survey measurements define high-order
CAD: Introduction to using CAD Data in ArcGIS. Kyle Williams & Jeff Reinhart
 CAD: Introduction to using CAD Data in ArcGIS Kyle Williams & Jeff Reinhart What we will accomplish today Overview of ArcGIS CAD Support Georeferencing CAD data for ArcGIS How Mapping Specification for
Geog 469 GIS Workshop. Data Analysis
 Geog 469 GIS Workshop Data Analysis Outline 1. What kinds of need-to-know questions can be addressed using GIS data analysis? 2. What is a typology of GIS operations? 3. What kinds of operations are useful
Introduction to GIS I
 Introduction to GIS Introduction How to answer geographical questions such as follows: What is the population of a particular city? What are the characteristics of the soils in a particular land parcel?
MODULE 12: MAPPING. Key Concepts: Maps for Master Plans
 MODULE 12: MAPPING 237 237 237 217 217 217 200 200 200 80 119 27 Key Concepts: 255 0 163 131 239 110 Maps for Master Plans 255 0 163 132 65 135 255 0 163 122 53 120 Cost Effective Data and Software Map
So, in this presentation, you can sit back and focus on the concepts and
 CHARLIE 15 MINUTES ABSTRACT In this session, we show how you can use a map template and other resources from the Resource Centers to complete your work faster and easier. We will touch on managing and
What are the five components of a GIS? A typically GIS consists of five elements: - Hardware, Software, Data, People and Procedures (Work Flows)
") LECTURE 1 - INTRODUCTION TO GIS Section I - GIS versus GPS What is a geographic information system (GIS)? GIS can be defined as a computerized application that combines an interactive map with a database
LECTURE 1 - INTRODUCTION TO GIS Section I - GIS versus GPS What is a geographic information system (GIS)? GIS can be defined as a computerized application that combines an interactive map with a database
UNIT 4: USING ArcGIS. Instructor: Emmanuel K. Appiah-Adjei (PhD) Department of Geological Engineering KNUST, Kumasi
 Department of Geological Engineering KNUST, Kumasi") UNIT 4: USING ArcGIS Instructor: Emmanuel K. Appiah-Adjei (PhD) Department of Geological Engineering KNUST, Kumasi Getting to Know ArcGIS ArcGIS is an integrated collection of GIS software products ArcGIS
UNIT 4: USING ArcGIS Instructor: Emmanuel K. Appiah-Adjei (PhD) Department of Geological Engineering KNUST, Kumasi Getting to Know ArcGIS ArcGIS is an integrated collection of GIS software products ArcGIS
Canadian Board of Examiners for Professional Surveyors Core Syllabus Item C 5: GEOSPATIAL INFORMATION SYSTEMS
 Study Guide: Canadian Board of Examiners for Professional Surveyors Core Syllabus Item C 5: GEOSPATIAL INFORMATION SYSTEMS This guide presents some study questions with specific referral to the essential
Landmark LRM. MM and RefPts can be same or different
 1 2 This project began in the fall of 2005. At the time CDOT had three different business units maintaining different LRS s. That is, the beginning and ending reference points and the measured length of
GIS in Weather and Society
 GIS in Weather and Society Olga Wilhelmi Institute for the Study of Society and Environment National Center for Atmospheric Research WAS*IS November 8, 2005 Boulder, Colorado Presentation Outline GIS basic
Geospatial Intelligence
 Geospatial Intelligence Geospatial analysis has existed as long as humans have made and studied maps but its importance to the intelligence community has skyrocketed in the past several years, with Unmanned
ESRI Quality Solution
 ESRI Quality Solution Paul Hardy Business Development Consultant (NMCAs) ESRI Europe phardy@esri.com ESRI Quality Solution Geodatabase Integrity Schema constraints (Attribute Domains etc) Rich data types
Introduction to Coastal GIS
 Introduction to Coastal GIS Event was held on Tues, 1/8/13 - Thurs, 1/10/13 Time: 9:00 am to 5:00 pm Location: Roger Williams University, Bristol, RI Audience: The intended audiences for this course are
GENERAL COMMAND OF MAPPING TURKEY
 GENERAL COMMAND OF MAPPING (HARİTA GENEL KOMUTANLIĞI) TURKEY NATIONAL REPORT (2007-2011) 15 th General Assembly International Cartographic Conference Paris FRANCE, 03-08 July 2011 NATIONAL REPORT (2007-2011)
Introduction to Coastal GIS
 Held on Tues, 1/8/13 through Thurs, 1/10/13 Location: Roger Williams University, Bristol, RI Audience: The intended audiences for this course are federal and state personnel, municipal staff and officials,
Overview key concepts and terms (based on the textbook Chang 2006 and the practical manual)
") Introduction Geo-information Science (GRS-10306) Overview key concepts and terms (based on the textbook 2006 and the practical manual) Introduction Chapter 1 Geographic information system (GIS) Geographically
Introduction Geo-information Science (GRS-10306) Overview key concepts and terms (based on the textbook 2006 and the practical manual) Introduction Chapter 1 Geographic information system (GIS) Geographically
Task 1: Start ArcMap and add the county boundary data from your downloaded dataset to the data frame.
 Exercise 6 Coordinate Systems and Map Projections The following steps describe the general process that you will follow to complete the exercise. Specific steps will be provided later in the step-by-step
An Introduction to Geographic Information System
 An Introduction to Geographic Information System PROF. Dr. Yuji MURAYAMA Khun Kyaw Aung Hein 1 July 21,2010 GIS: A Formal Definition A system for capturing, storing, checking, Integrating, manipulating,
Task 1: Open ArcMap and activate the Spatial Analyst extension.
 Exercise 10 Spatial Analyst The following steps describe the general process that you will follow to complete the exercise. Specific steps will be provided later in the step-by-step instructions component
ScaleMaster characterization of types of design change through scale for mapping from multi-resolution databases
 ScaleMaster characterization of types of design change through scale for mapping from multi-resolution databases Cynthia A. Brewer, Pennsylvania State University Jessica Acosta, Penn State ESRI Barbara
GIS = Geographic Information Systems;
 What is GIS GIS = Geographic Information Systems; What Information are we talking about? Information about anything that has a place (e.g. locations of features, address of people) on Earth s surface,
Watershed Delineation
 Watershed Delineation Jessica L. Watkins, University of Georgia 2 April 2009 Updated by KC Love February 25, 2011 PURPOSE For this project, I delineated watersheds for the Coweeta synoptic sampling area
GIS PORTFOLIO MOHAMED MAGDY MOHAMED HUSSAIN GIS ENGINEER. UWF GIS ONLINE CERTIFICATE GIS Internship (GIS4944)
") 2012 GIS PORTFOLIO MOHAMED MAGDY MOHAMED HUSSAIN GIS ENGINEER UWF GIS ONLINE CERTIFICATE GIS Internship (GIS4944) Portfolio Table of Contents Subject... Page Personal statement/mission/philosophy... 1
2012 GIS PORTFOLIO MOHAMED MAGDY MOHAMED HUSSAIN GIS ENGINEER UWF GIS ONLINE CERTIFICATE GIS Internship (GIS4944) Portfolio Table of Contents Subject... Page Personal statement/mission/philosophy... 1
GIS and Forest Engineering Applications FE 257 Lecture and laboratory, 3 credits
 GIS and Forest Engineering Applications FE 257 Lecture and laboratory, 3 credits Instructor: Michael Wing Associate Professor Forest Engineering, Resources, and Management Oregon State University Crop
Enhance Security, Safety and Efficiency With Geospatial Visualization
 Areas within 10 minutes of an exit are emphasized on this map, to give an indication of how accessible neighborhoods are by highway. The colors represent 1, 3, 5 and 10 minute increments from the exits.
The File Geodatabase API. Craig Gillgrass Lance Shipman
 The File Geodatabase API Craig Gillgrass Lance Shipman Schedule Cell phones and pagers Please complete the session survey we take your feedback very seriously! Overview File Geodatabase API - Introduction
Your web browser (Safari 7) is out of date. For more security, comfort and. the best experience on this site: Update your browser Ignore
 is out of date. For more security, comfort and. the best experience on this site: Update your browser Ignore") Your web browser (Safari 7) is out of date. For more security, comfort and Activityengage the best experience on this site: Update your browser Ignore Introduction to GIS What is a geographic information
Your web browser (Safari 7) is out of date. For more security, comfort and Activityengage the best experience on this site: Update your browser Ignore Introduction to GIS What is a geographic information
Multiple Representations with Overrides, and their relationship to DLM/DCM Generalization. Paul Hardy Dan Lee
 Multiple Representations with Overrides, and their relationship to DLM/DCM Generalization Paul Hardy Dan Lee phardy@esri.com dlee@esri.com 1 Context This is a forward-looking presentation, and much of
INDOT Office of Traffic Safety
 Intro to GIS Spatial Analysis INDOT Office of Traffic Safety Intro to GIS Spatial Analysis INDOT Office of Traffic Safety Kevin Knoke Section 130 Program Manager Highway Engineer II Registered Professional
Vector Analysis: Farm Land Suitability Analysis in Groton, MA
 Vector Analysis: Farm Land Suitability Analysis in Groton, MA Written by Adrienne Goldsberry, revised by Carolyn Talmadge 10/9/2018 Introduction In this assignment, you will help to identify potentially
GIS Applications on Environmental Education in Taiwan
 GIS Applications on Environmental Education in Taiwan Track: Education Authors: Yu-Chen Lai, Mei-Ling Yeh, Tien-Yin Chou Abstract GIS is a perfect vehicle to deliver environmental knowledge and spatial
4. GIS Implementation of the TxDOT Hydrology Extensions
 4. GIS Implementation of the TxDOT Hydrology Extensions A Geographic Information System (GIS) is a computer-assisted system for the capture, storage, retrieval, analysis and display of spatial data. It
Using CAD data in ArcGIS
 Using CAD data in ArcGIS Phil Sanchez and Jeff Reinhart Esri UC 2014 Technical Workshop Agenda Overview of ArcGIS CAD Support Using CAD Datasets in ArcMap Georeferencing CAD data for ArcGIS Loading CAD
Features and Benefits
 Autodesk LandXplorer Features and Benefits Use the Autodesk LandXplorer software family to help improve decision making, lower costs, view and share changes, and avoid the expense of creating physical
RiparianZone = buffer( River, 100 Feet )
") GIS Analysts perform spatial analysis when they need to derive new data from existing data. In GIS I, for example, you used the vector approach to derive a riparian buffer feature (output polygon) around
GIS Analysts perform spatial analysis when they need to derive new data from existing data. In GIS I, for example, you used the vector approach to derive a riparian buffer feature (output polygon) around
GIS for ChEs Introduction to Geographic Information Systems
 GIS for ChEs Introduction to Geographic Information Systems AIChE Webinar John Cirucci 1 GIS for ChEs Introduction to Geographic Information Systems What is GIS? Tools and Methods Applications Examples
Geospatial Intelligence
 Geospatial Intelligence Geospatial analysis has existed as long as humans have made and studied maps but its importance to the intelligence community has skyrocketed in the past several years, with Unmanned
SRJC Applied Technology 54A Introduction to GIS
 SRJC Applied Technology 54A Introduction to GIS Overview Lecture of Geographic Information Systems Fall 2004 Santa Rosa Junior College Presented By: Tim Pudoff, GIS Coordinator, County of Sonoma, Information
Syllabus Reminders. Geographic Information Systems. Components of GIS. Lecture 1 Outline. Lecture 1 Introduction to Geographic Information Systems
 Syllabus Reminders Geographic Information s Lecture Introduction to Geographic Information s. Class Info: www.saigis.com/class/ 2. Office T / TH (8:00-9:30 a.m.) and (2:30 3:30pm) or Appt 3. Email: burgerpr@unk.edu
Spatial Analysis using Vector GIS THE GOAL: PREPARATION:
 PLAN 512 GIS FOR PLANNERS Department of Urban and Environmental Planning University of Virginia Fall 2006 Prof. David L. Phillips Spatial Analysis using Vector GIS THE GOAL: This tutorial explores some
GIS IN ECOLOGY: ANALYZING RASTER DATA
 GIS IN ECOLOGY: ANALYZING RASTER DATA Contents Introduction... 2 Raster Tools and Functionality... 2 Data Sources... 3 Tasks... 4 Getting Started... 4 Creating Raster Data... 5 Statistics... 8 Surface