Visualization of Commuter Flow Using CTPP Data and GIS
|
|
|
- Diana Harmon
- 6 years ago
- Views:
Transcription

1 Visualization of Commuter Flow Using CTPP Data and GIS Research & Analysis Department Southern California Association of Governments 2015 ESRI User Conference l July 23, 2015 l San Diego, CA Jung Seo, Tom Vo, and JiSu Lee
2 Contents Introduction of SCAG Objectives Methodology Results Conclusions Future Studies

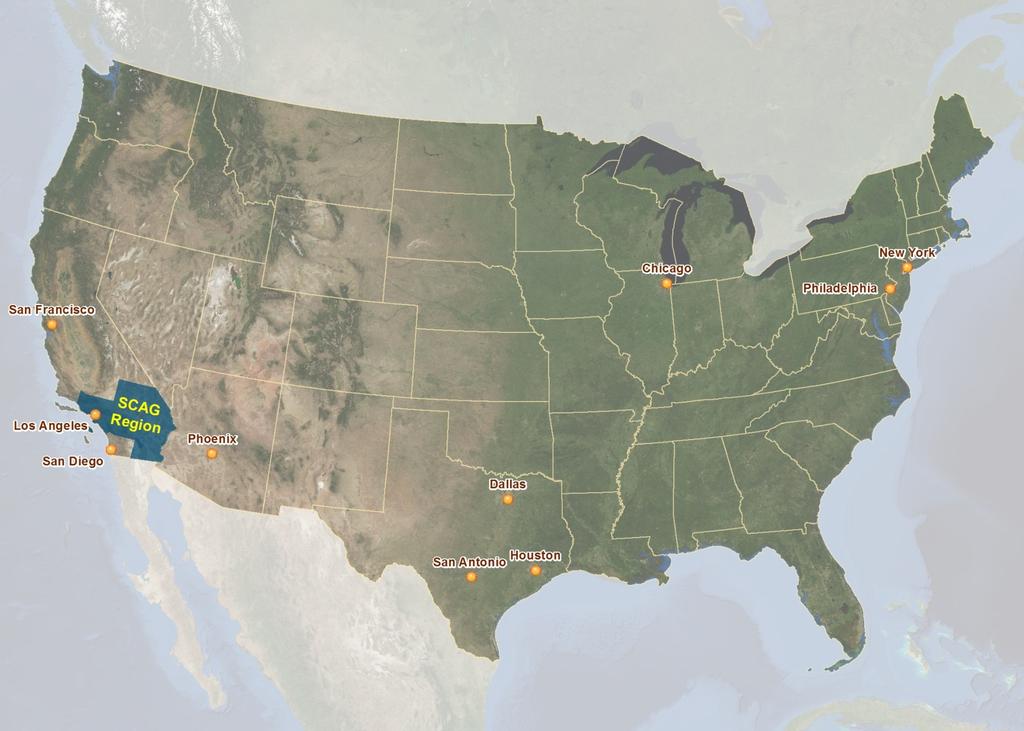
3 Overview of SCAG
 6 counties and 191 cities 15")
 38,000 square miles 16th largest")
4 Quick Facts of SCAG Nation s largest Metropolitan Planning Organization (MPO) 6 counties and 191 cities 15 sub-regions 18.4 million people (2012) 38,000 square miles 16th largest economy in the world (GRP: $924 Billion in 2013)
5 Objectives Identify the major work destinations for each jurisdiction in the SCAG region 191 cities and 6 counties Visualize the spatial patterns of the major work destinations for each jurisdiction To understand where residents of each jurisdiction are employed Provide informational data resources to local jurisdictions for planning purposes E.g Local Profiles: Planning data reports
6 Previous Future Studies Goal Work destinations at different geographical level Previous, we studied on place level Produce major work destination data using Census Transportation Planning Products (CTPP)
7 Census Transportation Planning Package (CTPP) The CTPP is a set of special tabulations designed by transportation planners using large sample surveys conducted by the Census Bureau. From 1970 to 2000, the CTPP and its predecessor, UTPP, used data from the decennial census long form (FHWA) Utilize continuous survey called American Community Survey (ACS) Three components of CTPP: Part 1: Residence-based tabulations summarizing worker and household characteristics Part 2: Workplace-based tabulations summarizing worker characteristics Part 3: Worker flows between home and work, including travel mode
8 Methodology for Identifying Work Destination Using CTPP Census Tract Flows Query Available on ducts/ _tract_flows/index.cfm Using Microsoft Access to select census tract-totract commuter data within SCAG s region Using SAS program with CTPP raw datasets/ * SAS: Statistical Analysis System * CTPP: Census Transportation Planning Products
 2006-2010")

9 Programming Scripts with CTPP Datasets CTPP (ACS) Origin-Destination (OD) Residence Area Workplace Area Enumerated by 2010 Census Tracts
10 Pros and Cons OnTheMap Pros Easy-to-use interface and able to visualize data instantly Support analyses at multiple levels of geography Cons Not able to search/download for multiple locations Programming Scripts Able to manipulate data for multiple areas at once Improve efficiency of managing and processing big data Incorporate with ArcGIS to visualize the data
11 CTPP Raw Dataset CTPP raw dataset description Pos Variable Type Explanation 1 StateFP_R Text Residence state number 2 CountyFP_R Text Residence county number 3 TractFP_R Text Residence tract number 4 StateFP_W Text Workplace state number 5 CountyFP_W Text Workplace county number 6 TractFP_W Text Workplace tract number 7 EST Text Estimate of commuter


12 Identifying Major Work Destinations O-D Analysis Steps Correspondence between Census Tract codes Place codes Exporting CSV dataset to dbf file for GIS O-D dataset Merging Place codes by Census Tract codes Ranking top 10 work destination Sorting dataset in descending order

13 Identifying Major Work Destinations (Cont.)
14 Visualizing Major Work Destinations Using ESRI ArcGIS application Data Driven Pages To create a multi-page map series from a single map document Using Python programming language Python Interpreted, object-oriented, high-level general-purpose programming language


15 Visualizing Major Work Destinations (Automated Mapping Workflow) Using ArcGIS and Python to create a series of work destination maps for 191 cities and 6 counties
16 Python Coding Importing ArcPy and ArcPy.mapping modules in Python to automatically create work destination maps Data Driven Page, Definition Query, and Exporting functions in ArcGIS mxd.datadrivenpages.currentpageid lyr.definitionquery = sqlexp arcpy.mapping.exporttojpeg

17 OD Map at Census Tract Level
18 Conclusions Significantly efficient in processing O-D analysis with SAS for numerous jurisdictions Data limitation of CTPP datasets (what limitation?) Python and ArcGIS improve the processing time and accuracy of map production Creating OD commuting flow at the Census Tract level helps to understand the travel pattern better
19 Future Studies Work destinations at different geographical level Incorporate socioeconomic data (SED) to create weighted commuter flow Include land use data when intersect place shapefile with tract shapefile to increase accuracy of manipulating the data Create an efficient and appropriate method to identify destination for each jurisdiction
Visualization of Origin- Destination Commuter Flow Using CTPP Data and ArcGIS
 Visualization of Origin- Destination Commuter Flow Using CTPP Data and ArcGIS Research & Analysis Department Southern California Association of Governments 2015 ESRI User Conference l July 23, 2015 l San
Geospatial Analysis of Job-Housing Mismatch Using ArcGIS and Python
 Geospatial Analysis of Job-Housing Mismatch Using ArcGIS and Python 2016 ESRI User Conference June 29, 2016 San Diego, CA Jung Seo, Frank Wen, Simon Choi and Tom Vo, Research & Analysis Southern California
Spatial and Socioeconomic Analysis of Commuting Patterns in Southern California Using LODES, CTPP, and ACS PUMS
 Spatial and Socioeconomic Analysis of Commuting Patterns in Southern California Using LODES, CTPP, and ACS PUMS Census for Transportation Planning Subcommittee meeting TRB 95th Annual Meeting January 11,
Spatiotemporal Analysis of Commuting Patterns: Using ArcGIS and Big Data
 Spatiotemporal Analysis of Commuting Patterns: Using ArcGIS and Big Data 2017 ESRI User Conference July 13, 2017 San Diego, VA Jung Seo, Tom Vo, Frank Wen and Simon Choi Research & Analysis Southern California
Spatiotemporal Analysis of Commuting Patterns in Southern California Using ACS PUMS, CTPP and LODES
 Spatiotemporal Analysis of Commuting Patterns in Southern California Using ACS PUMS, CTPP and LODES 2017 ACS Data Users Conference May 11-12, 2017 Alexandria, VA Jung Seo, Tom Vo, Frank Wen and Simon Choi
Automated Map Book Production Workflow: Using ArcGIS and Python Programming
 Automated Map Book Production Workflow: Using ArcGIS and Python Programming 2018 ESRI User Conference Jung H. Seo, Tom M. Vo and Frank Wen Southern California Association of Governments July 10, 2018 San
Python Scripting for Regional Land Use Data Management and QC Workflow
 Python Scripting for Regional Land Use Data Management and QC Workflow 2015 ESRI User Conference July 21, 2015 San Diego, CA Jung Seo, Frank Wen, Simon Choi and Tom Vo Research & Analysis Southern California
FHWA Planning Data Resources: Census Data Planning Products (CTPP) HEPGIS Interactive Mapping Portal
 HEPGIS Interactive Mapping Portal") FHWA Planning Data Resources: Census Data Planning Products (CTPP) HEPGIS Interactive Mapping Portal Jeremy Raw, P.E. FHWA, Office of Planning, Systems Planning and Analysis August 2017 Outline Census
FHWA Planning Data Resources: Census Data Planning Products (CTPP) HEPGIS Interactive Mapping Portal Jeremy Raw, P.E. FHWA, Office of Planning, Systems Planning and Analysis August 2017 Outline Census
Census Transportation Planning Products (CTPP)
") Census Transportation Planning Products (CTPP) Penelope Weinberger CTPP Program Manager - AASHTO September 15, 2010 1 What is the CTPP Program Today? The CTPP is an umbrella program of data products, custom
Census Transportation Planning Products (CTPP) Penelope Weinberger CTPP Program Manager - AASHTO September 15, 2010 1 What is the CTPP Program Today? The CTPP is an umbrella program of data products, custom
GIS Lecture 5: Spatial Data
 GIS Lecture 5: Spatial Data GIS 1 Outline Vector Data Formats Raster Data Formats Map Projections Coordinate Systems US Census geographic files US Census data files GIS Data Sources GIS 2 Vector Data Formats
How is Your Health? Using SAS Macros, ODS Graphics, and GIS Mapping to Monitor Neighborhood and Small-Area Health Outcomes
 Paper 3214-2015 How is Your Health? Using SAS Macros, ODS Graphics, and GIS Mapping to Monitor Neighborhood and Small-Area Health Outcomes Roshni Shah, Santa Clara County Public Health Department ABSTRACT
Use of US Census Data for Transportation Modeling and Planning
 Use of US Census Data for Transportation Modeling and Planning Yongqiang Wu, P.E. CTS Engineering, Inc. Southeast Florida FSUTMS User Group Meeting September 14, 2018 Outline Overview of Census Products
Speakers: Jeff Price, Federal Transit Administration Linda Young, Center for Neighborhood Technology Sofia Becker, Center for Neighborhood Technology
 Speakers: Jeff Price, Federal Transit Administration Linda Young, Center for Neighborhood Technology Sofia Becker, Center for Neighborhood Technology Peter Haas, Center for Neighborhood Technology Craig
Inclusion of Non-Street Addresses in Cancer Cluster Analysis
 Inclusion of Non-Street Addresses in Cancer Cluster Analysis Sue-Min Lai, Zhimin Shen, Darin Banks Kansas Cancer Registry University of Kansas Medical Center KCR (Kansas Cancer Registry) KCR: population-based
Utilizing Data from American FactFinder with TIGER/Line Shapefiles in ArcGIS
 Utilizing Data from American FactFinder with TIGER/Line Shapefiles in ArcGIS Web Adams, GISP Data Dissemination Specialist U.S. Census Bureau New York Regional Office 1 What We Do Decennial Census Every
OnTheMap for Emergency Management
 OnTheMap for Emergency Management Robert Pitts Geographer/Project Manager Longitudinal Employer Household Dynamics (LEHD) Center for Economic Studies U.S. Census Bureau Jody Hoon-Star Geographer/Application
GIS Level 2. MIT GIS Services
 GIS Level 2 MIT GIS Services http://libraries.mit.edu/gis Email: gishelp@mit.edu TOOLS IN THIS WORKSHOP - Definition Queries - Create a new field in the attribute table - Field Calculator - Add XY Data
How GIS based Visualizations Support Land Use and Transportation Modeling
 How GIS based Visualizations Support Land Use and Transportation Modeling ESRI International Users Conference San Diego, CA - July 23, 2015 Prepared by: Troy Hightower Introduction This presentation will
Key Processes
 Data Manipulation and Extraction Key Processes Key Processes Re-Projecting Data Selecting by Attributes Exporting Data Hillshade Reclassification Conversion of Raster to Vector Re-Projecting Data Purpose
Merging statistics and geospatial information
 Merging statistics and geospatial information Demography / Commuting / Spatial planning / Registers Mirosław Migacz Chief GIS Specialist Janusz Dygaszewicz Director Central Statistical Office of Poland
Working with Census 2000 Data from MassGIS
 Tufts University GIS Tutorial Working with Census 2000 Data from MassGIS Revised September 26, 2007 Overview In this tutorial, you will use pre-processed census data from Massachusetts to create maps of
HORIZON 2030: Land Use & Transportation November 2005
 PROJECTS Land Use An important component of the Horizon transportation planning process involved reviewing the area s comprehensive land use plans to ensure consistency between them and the longrange transportation
Using American Factfinder
 Using American Factfinder What is American Factfinder? American Factfinder is a search engine that provides access to the population, housing and economic data collected by the U.S. Census Bureau. It can
Crossing Boundaries Building Tools to Combine Public-Use (and Misaligned) Data
 Data") Crossing Boundaries Building Tools to Combine Public-Use (and Misaligned) Data Matthew Graham LEHD Program Center for Economic Studies U.S. Census Bureau 2018 FCSM Research and Policy Conference 1 Disclaimer
Crossing Boundaries Building Tools to Combine Public-Use (and Misaligned) Data Matthew Graham LEHD Program Center for Economic Studies U.S. Census Bureau 2018 FCSM Research and Policy Conference 1 Disclaimer
Iowa Department of Transportation Office of Transportation Data GIS / CAD Integration
 Iowa Department of Transportation Office of Transportation Data GIS / CAD Integration From GIS data to CAD graphics - Iowa DOT's workflow utilizing GeoMedia and MicroStation to develop map products. Mark
Outline. ArcGIS? ArcMap? I Understanding ArcMap. ArcMap GIS & GWR GEOGRAPHICALLY WEIGHTED REGRESSION. (Brief) Overview of ArcMap
 Overview of ArcMap") GEOGRAPHICALLY WEIGHTED REGRESSION Outline GWR 3.0 Software for GWR (Brief) Overview of ArcMap Displaying GWR results in ArcMap stewart.fotheringham@nuim.ie http://ncg.nuim.ie ncg.nuim.ie/gwr/ ArcGIS?
GEOGRAPHICALLY WEIGHTED REGRESSION Outline GWR 3.0 Software for GWR (Brief) Overview of ArcMap Displaying GWR results in ArcMap stewart.fotheringham@nuim.ie http://ncg.nuim.ie ncg.nuim.ie/gwr/ ArcGIS?
AUTOMATED METERED WATER CONSUMPTION ANALYSIS
 AUTOMATED METERED WATER CONSUMPTION ANALYSIS Shane Zhong 1, Nick Turich 1, Patrick Hayde 1 1. Treatment and Network Planning, SA Water, Adelaide, SA, Australia ABSTRACT Water utilities collect and store
TRAFFIC ANALYSIS ZONES - HOW DO WE MOVE FORWARD?
 TRAFFIC ANALYSIS ZONES - HOW DO WE MOVE FORWARD? Huimin Zhao (Corresponding author) Independent Consultant hzhao88@gmail.com Yong Zhao Senior Transportation Planner Jacobs Engineering Group 2705 Bee Cave
Encapsulating Urban Traffic Rhythms into Road Networks
 Encapsulating Urban Traffic Rhythms into Road Networks Junjie Wang +, Dong Wei +, Kun He, Hang Gong, Pu Wang * School of Traffic and Transportation Engineering, Central South University, Changsha, Hunan,
Tracey Farrigan Research Geographer USDA-Economic Research Service
 Rural Poverty Symposium Federal Reserve Bank of Atlanta December 2-3, 2013 Tracey Farrigan Research Geographer USDA-Economic Research Service Justification Increasing demand for sub-county analysis Policy
2014 Planning Database (PDB)
") 2014 Planning Database (PDB) November 19, 2014 Barbara O Hare, Nancy Bates, Julia Coombs, Travis Pape, Chandra Erdman Office of Survey Analytics 1 Overview Tract and Block Group PDBs Useful for: Identifying
2014 Planning Database (PDB) November 19, 2014 Barbara O Hare, Nancy Bates, Julia Coombs, Travis Pape, Chandra Erdman Office of Survey Analytics 1 Overview Tract and Block Group PDBs Useful for: Identifying
BROOKINGS May
 Appendix 1. Technical Methodology This study combines detailed data on transit systems, demographics, and employment to determine the accessibility of jobs via transit within and across the country s 100
Environmental Systems Research Institute
 Introduction to ArcGIS ESRI Environmental Systems Research Institute Redlands, California 2 ESRI GIS Development Arc/Info (coverage model) Versions 1-7 from 1980 1999 Arc Macro Language (AML) ArcView (shapefile
Performing Advanced Cartography with Esri Production Mapping
 Esri International User Conference San Diego, California Technical Workshops July 25, 2012 Performing Advanced Cartography with Esri Production Mapping Tania Pal & Madhura Phaterpekar Agenda Outline generic
COMMUTING ANALYSIS IN A SMALL METROPOLITAN AREA: BOWLING GREEN KENTUCKY
 Papers of the Applied Geography Conferences (2007) 30: 86-95 COMMUTING ANALYSIS IN A SMALL METROPOLITAN AREA: BOWLING GREEN KENTUCKY Caitlin Hager Jun Yan Department of Geography and Geology Western Kentucky
GIS-Based Analysis of the Commuting Behavior and the Relationship between Commuting and Urban Form
 GIS-Based Analysis of the Commuting Behavior and the Relationship between Commuting and Urban Form 1. Abstract A prevailing view in the commuting is that commuting would reconstruct the urban form. By
Datahoods or Data-Driven Neighborhoods. Using GIS to better understand neighborhoods
 Datahoods or Data-Driven Neighborhoods Using GIS to better understand neighborhoods Who am I? Silas Toms President, Loki Intelligent Corporation Author, ArcPy and ArcGIS (2 editions) Co-Host of the Mappyist
DATA SCIENCE SIMPLIFIED USING ARCGIS API FOR PYTHON
 DATA SCIENCE SIMPLIFIED USING ARCGIS API FOR PYTHON LEAD CONSULTANT, INFOSYS LIMITED SEZ Survey No. 41 (pt) 50 (pt), Singapore Township PO, Ghatkesar Mandal, Hyderabad, Telengana 500088 Word Limit of the
Demographic Data. How to get it and how to use it (with caution) By Amber Keller
 By Amber Keller") Demographic Data How to get it and how to use it (with caution) By Amber Keller 101 Where does it come from? o The American Community Survey o Socio-economic characteristics of a population o Administered
Demographic Data How to get it and how to use it (with caution) By Amber Keller 101 Where does it come from? o The American Community Survey o Socio-economic characteristics of a population o Administered
Orien Ori t en a t tion a Webi W nar: ebi CPD Maps 2
 Orientation Webinar: CPD Maps 2 Agenda 1. Background - econ Planning Suite 2. Expanded Planning Data 3. CPD Maps Overview 4. Demonstration Guide Me Wizard Map Selection Identify Tool Printing and Saving
Geographic Systems and Analysis
 Geographic Systems and Analysis New York University Robert F. Wagner Graduate School of Public Service Instructor Stephanie Rosoff Contact: stephanie.rosoff@nyu.edu Office hours: Mondays by appointment
ParkServe. The Trust for Public Land s. Emmalee Dolfi Gabriel Patterson-King ESRI User Conference 2017
 The Trust for Public Land s ParkServe Automating Large-Scale Data Transformation, QA/QC and Analysis Emmalee Dolfi Gabriel Patterson-King ESRI User Conference 2017 Our mission The Trust for Public Land
Three Ways the CSU is Using Geographic Information Systems (GIS) to Inform Decisions
 to Inform Decisions") Three Ways the CSU is Using Geographic Information Systems (GIS) to Inform Decisions Diana Lavery, Senior Research Analyst California State University, Office of the Chancellor California Association of
Three Ways the CSU is Using Geographic Information Systems (GIS) to Inform Decisions Diana Lavery, Senior Research Analyst California State University, Office of the Chancellor California Association of
Spatial Analysis with Web GIS. Rachel Weeden
 Spatial Analysis with Web GIS Rachel Weeden Agenda Subhead goes here Introducing ArcGIS Online Spatial Analysis Workflows Scenarios Other Options Resources ArcGIS is a Platform Making mapping and analytics
2040 MTP and CTP Socioeconomic Data
 SE Data 6-1 24 MTP and CTP Socioeconomic Data Purpose of Socioeconomic Data The socioeconomic data (SE Data) shows the location of the population and employment, median household income and other demographic
What are we like? Population characteristics from UK censuses. Justin Hayes & Richard Wiseman UK Data Service Census Support
 What are we like? Population characteristics from UK censuses Justin Hayes & Richard Wiseman UK Data Service Census Support Who are we? Richard Wiseman UK Data Service / Jisc Justin Hayes UK Data Service
Economic and Social Urban Indicators: A Spatial Decision Support System for Chicago Area Transportation Planning
 Economic and Social Urban Indicators: A Spatial Decision Support System for Chicago Area Transportation Planning Piyushimita Thakuriah (Vonu), P.S. Sriraj, Paul Metaxatos, Inshu Minocha & Tanushri Swarup
Copyright The McGraw-Hill Companies, Inc. Permission required for reproduction or display.
 CHAPTER 5 GIS DATA Acquisition 5.1 Existing GIS Data 5.1.1 Federal Geographic Data Committee 5.1.2 Geospatial One-Stop Box 5.1 Clearinghouse and Portal 5.1.3 U.S. Geological Survey 5.1.4 U.S. Census Bureau
Introduction to ArcGIS GeoAnalytics Server. Sarah Ambrose & Noah Slocum
 Introduction to ArcGIS GeoAnalytics Server Sarah Ambrose & Noah Slocum Agenda Overview Analysis Capabilities + Demo Deployment and Configuration Questions ArcGIS GeoAnalytics Server uses the power of distributed
The econ Planning Suite: CPD Maps and the Con Plan in IDIS for Consortia Grantees Session 1
 The econ Planning Suite: CPD Maps and the Con Plan in IDIS for Consortia Grantees Session 1 1 Training Objectives Use CPD Maps to analyze, assess, and compare levels of need in your community Use IDIS
Spatial Organization of Data and Data Extraction from Maptitude
 Spatial Organization of Data and Data Extraction from Maptitude N. P. Taliceo Geospatial Information Sciences The University of Texas at Dallas UT Dallas GIS Workshop Richardson, TX March 30 31, 2018 1/
An Overview of Solving Spatial Problems Using ArcGIS
 Esri International User Conference San Diego, CA Technical Workshops An Overview of Solving Spatial Problems Using ArcGIS Linda Beale, Jian Lange July 12 th, 2011 Real World Example Using Spatial Analysis
NJDOT Pedestrian Safety Analysis Tool 2015 GIS T Conference
 NJDOT Pedestrian Safety Analysis Tool 2015 GIS T Conference NJDOT Pedestrian Safety Analysis Tool Justin Furch GIT Department Manager Michael Baker International Pedestrian Safety in NJ: Has the highest
NOACA s DART: Web GIS Tools for Transportation Planning. Chad Harris, NOACA Bryan Baker, Tierra Plan LLC Kevin Knapp, Tierra Plan LLC
 NOACA s DART: Web GIS Tools for Transportation Planning Chad Harris, NOACA Bryan Baker, Tierra Plan LLC Kevin Knapp, Tierra Plan LLC NOACA DART: Data Analysis and Reporting Tool NOACA: Northeast Ohio Areawide
GIS Lecture 4: Data. GIS Tutorial, Third Edition GIS 1
 GIS Lecture 4: Data GIS 1 Outline Data Types, Tables, and Formats Geodatabase Tabular Joins Spatial Joins Field Calculator ArcCatalog Functions GIS 2 Data Types, Tables, Formats GIS 3 Directly Loadable
The Census, Urbanized Areas, and Your MPO/RPO
 The Census, Urbanized Areas, and Your MPO/RPO Alex Bond, AICP NADO Rural Transportation Peer Learning Conference August 25, 2011 1 Issues to Discuss Census background Definitions of Census geographies
GIS 520 Data Cardinality. Joining Tabular Data to Spatial Data in ArcGIS
 GIS 520 Data Cardinality Joining Tabular Data to Spatial Data in ArcGIS Joining Tabular Data to Spatial Data in ArcGIS Outline Working with Zip Code Data Data Cardinality Issues Exploring Data Format Requirements
A Street Named for a King
 A Street Named for a King Dr. Jerry Mitchell University of South Carolina OVERVIEW This lesson adapts the work of Dr. Derek Alderman, a geographer who has used the Martin Luther King, Jr. street-naming
Introduction to the 176A labs and ArcGIS Purpose of the labs
 Introduction to the 176A labs and ArcGIS Purpose of the labs Acknowledgement: Slides by David Maidment, U Texas-Austin and Francisco Olivera (TAMU) Hands-on experience with a leading software package Introduction
Big-Geo-Data EHR Infrastructure Development for On-Demand Analytics
 Big-Geo-Data EHR Infrastructure Development for On-Demand Analytics Sohayla Pruitt, MA Senior Geospatial Scientist Duke Medicine DUHS DHTS EIM HIRS Page 1 Institute of Medicine, World Health Organization,
Transit Time Shed Analyzing Accessibility to Employment and Services
 Transit Time Shed Analyzing Accessibility to Employment and Services presented by Ammar Naji, Liz Thompson and Abdulnaser Arafat Shimberg Center for Housing Studies at the University of Florida www.shimberg.ufl.edu
GIS Models for Analyzing Intercity Commute Patterns: A Case Study of the Austin-San Antonio Corridor in Texas
 GIS Models for Analyzing Intercity Commute Patterns: A Case Study of the Austin-San Antonio Corridor in Texas 0-5345-R2 Authors: F. Benjamin Zhan, Ph.D. Xuwei Chen, Ph.D. Texas Center for Geographic Information
Developing and Validating Regional Travel Forecasting Models with CTPP Data: MAG Experience
 CTPP Webinar and Discussion Thursday, July 17, 1-3pm EDT Developing and Validating Regional Travel Forecasting Models with CTPP Data: MAG Experience Kyunghwi Jeon, MAG Petya Maneva, MAG Vladimir Livshits,
Using ArcGIS 10 to Estimate the U.S. Population Affected by Drought
 Using ArcGIS 10 to Estimate the U.S. Population Affected by Drought Jeff Nothwehr National Drought Mitigation Center University of Nebraska-Lincoln Overview What is the U.S. Drought Monitor Mapping Process
2010 Census Data Release and Current Geographic Programs. Michaellyn Garcia Geographer Seattle Regional Census Center
 2010 Census Data Release and Current Geographic Programs Michaellyn Garcia Geographer Seattle Regional Census Center 2010 Center of Population Located approximately 2.7 miles northeast of Plato, Missouri
Exercise on Using Census Data UCSB, July 2006
 Exercise on Using Census Data UCSB, July 2006 Purpose The purpose of this lab is to become familiar with Census Bureau data. Second, we will learn how to join tables which allows you to add data to the
GIS and Spatial Statistics: One World View or Two? Michael F. Goodchild University of California Santa Barbara
 GIS and Spatial Statistics: One World View or Two? Michael F. Goodchild University of California Santa Barbara Location as attribute The data table Census summary table What value is location as an explanatory
Empowering Local Health through GIS
 Empowering Local Health through GIS Mapping data from Washington s Immunization Information System (IIS). Presented to IACW October 16 th, 2013 by: Chris Halsell and Isaiah Berg Agenda IIS Overview Why
Analyzing the Market Share of Commuter Rail Stations using LEHD Data
 Analyzing the Market Share of Commuter Rail Stations using LEHD Data Using Census Data for Transportation Applications Conference, Irvine, CA October 26, 2011 1. What is the size of Metrolink s commute
Valdosta State University Strategic Research & Analysis
 Christopher Neasbitt, Programmer Analyst Associate (cjneasbi@valdosta.edu) Kristina M. Cragg, Ph.D., Assistant to the President for Strategic Research & Analysis (kmcragg@valdosta.edu) Amir Atabekov, Student
Are You Maximizing The Value Of All Your Data?
 Are You Maximizing The Value Of All Your Data? Using The SAS Bridge for ESRI With ArcGIS Business Analyst In A Retail Market Analysis SAS and ESRI: Bringing GIS Mapping and SAS Data Together Presented
High resolution population grid for the entire United States
 High resolution population grid for the entire United States A. Dmowska, T. F. Stepinski Space Informatics Lab, Department of Geography, University of Cincinnati, Cincinnati, OH 45221-0131, USA Telephone:
This is a repository copy of Mapping the American Commute: from mega-regions to mega commutes.
 This is a repository copy of Mapping the American Commute: from mega-regions to mega commutes. White Rose Research Online URL for this paper: http://eprints.whiterose.ac.uk/89361/ Monograph: Rae, A.J.
Washington Master Address Services: Project Overview Ben Vaught, OCIO David Wright, DOR Craig Erickson, DOH Tom Kimpel, OFM
 Washington Master Address Services: Project Overview Ben Vaught, OCIO David Wright, DOR Craig Erickson, DOH Tom Kimpel, OFM 2014 IPMA Forum May 21, 2014 Saint Martin's University Lacey, WA March 18 th
Enabling the Image Analyst (IA) to use the geodatabase
 to use the geodatabase") Enabling the Image Analyst (IA) to use the geodatabase Rick Racine, BAE Systems, Reston, VA Stewart Walker, BAE Systems, San Diego, CA 2008 ESRI Federal User Conference, Washington, D.C., 21 February 2610020508
Enabling the Image Analyst (IA) to use the geodatabase Rick Racine, BAE Systems, Reston, VA Stewart Walker, BAE Systems, San Diego, CA 2008 ESRI Federal User Conference, Washington, D.C., 21 February 2610020508
Lecture 10 Mapping Quantities: Dot Density Maps
 Lecture 10 Mapping Quantities: Dot Density Maps Introduction Creating maps of features based on quantity are some of the most common and important types of maps. In order to create maps that show quantity
Globally Estimating the Population Characteristics of Small Geographic Areas. Tom Fitzwater
 Globally Estimating the Population Characteristics of Small Geographic Areas Tom Fitzwater U.S. Census Bureau Population Division What we know 2 Where do people live? Difficult to measure and quantify.
GIS CONCEPTS ARCGIS METHODS AND. 3 rd Edition, July David M. Theobald, Ph.D. Warner College of Natural Resources Colorado State University
 GIS CONCEPTS AND ARCGIS METHODS 3 rd Edition, July 2007 David M. Theobald, Ph.D. Warner College of Natural Resources Colorado State University Copyright Copyright 2007 by David M. Theobald. All rights
Acknowledgments xiii Preface xv. GIS Tutorial 1 Introducing GIS and health applications 1. What is GIS? 2
 Acknowledgments xiii Preface xv GIS Tutorial 1 Introducing GIS and health applications 1 What is GIS? 2 Spatial data 2 Digital map infrastructure 4 Unique capabilities of GIS 5 Installing ArcView and the
Under a New Halo: Site Suitability Study for the Hypothetical Relocation of Angel Stadium. Jerry P. Magaña
 Under a New Halo: Site Suitability Study for the Hypothetical Relocation of Angel Stadium Jerry P. Magaña About me Relatively new to GIS and an honor to present at the 2017 UC Received Certificate in GIS
final report A Recommended Approach to Delineating Traffic Analysis Zones in Florida Florida Department of Transportation Systems Planning Office
 A Recommended Approach to Delineating Traffic Analysis Zones in Florida final report prepared for Florida Department of Transportation Systems Planning Office September 27, 2007 final report A Recommended
StanCOG Transportation Model Program. General Summary
 StanCOG Transportation Model Program Adopted By the StanCOG Policy Board March 17, 2010 What are Transportation Models? General Summary Transportation Models are technical planning and decision support
Performing. Geospatial Analysis. Using Latitude and Longitude Data. Ginger Ni - Software Engineer
 Performing Geospatial Analysis Using Latitude and Longitude Data Ginger Ni - Software Engineer Hewlett Packard Enterprise confidential information This is a rolling (up to three year) roadmap and is subject
Spatial Variation in Local Road Pedestrian and Bicycle Crashes
 2015 Esri International User Conference July 20 24, 2015 San Diego, California Spatial Variation in Local Road Pedestrian and Bicycle Crashes Musinguzi, Abram, Graduate Research Assistant Chimba,Deo, PhD.,
PALS: Neighborhood Identification, City of Frederick, Maryland. David Boston Razia Choudhry Chris Davis Under the supervision of Chao Liu
 PALS: Neighborhood Identification, City of Frederick, Maryland David Boston Razia Choudhry Chris Davis Under the supervision of Chao Liu University of Maryland School of Architecture, Planning & Preservation
Land-Use Land-Cover Change Detector
 15 th Esri India User Conference 2014 Land-Use Land-Cover Change Detector Rushikesh Padsala Email ID:- rushikesh101@gmail.com Student, III Semester, M.Tech Geomatics, Faculty of Technology, CEPT University
Activity-Based Models and ACS Data: What are the implications for use? D.A. Niemeier
 Activity-Based Models and ACS Data: What are the implications for use? D.A. Niemeier Introduction The Census is transitioning to the American Community Survey (ACS) for replacement of the decennial census
GIS Analysis of Crenshaw/LAX Line
 PDD 631 Geographic Information Systems for Public Policy, Planning & Development GIS Analysis of Crenshaw/LAX Line Biying Zhao 6679361256 Professor Barry Waite and Bonnie Shrewsbury May 12 th, 2015 Introduction
Problems and Challenges
 2018 Esri Petroleum GIS Conference Problems and Challenges May 9 10, 2018 Houston, Texas George R. Brown Convention Center Disunity of drawing standards and format Large amount of work in Cartography,
5A.10 A GEOSPATIAL DATABASE AND CLIMATOLOGY OF SEVERE WEATHER DATA
 5A.10 A GEOSPATIAL DATABASE AND CLIMATOLOGY OF SEVERE WEATHER DATA Steve Ansari * and Stephen Del Greco NOAA National Climatic Data Center, Asheville, North Carolina Mark Phillips University of North Carolina
Nicholas Ferri, GIS Specialist, Percheron Acquisitions L.L.C.
 Nicholas Ferri, GIS Specialist, Percheron Acquisitions L.L.C. Source: U.S. Energy Information Administration Rock formation located below the Austin Chalk Shale gas is an unconventional source of natural
RELATIONAL DATA MODELING TO ENHANCE GIS-BASED VISUAL INFORMATION SYSTEMS
 RELATIONAL DATA MODELING TO ENHANCE GIS-BASED VISUAL INFORMATION SYSTEMS Matthew A. North, Washington & Jefferson College, mnorth@washjeff.edu Samuel B. Fee, Washington & Jefferson College, sfee@washjeff.edu
Mapping Accessibility Over Time
 Journal of Maps, 2006, 76-87 Mapping Accessibility Over Time AHMED EL-GENEIDY and DAVID LEVINSON University of Minnesota, 500 Pillsbury Drive S.E., Minneapolis, MN 55455, USA; geneidy@umn.edu (Received
The 2010 Census Successful Because of GIS
 The 2010 Census Successful Because of GIS Timothy F. Trainor Chief, Geography Division, U.S. Census Bureau Vice President, International Cartographic Association Establishing the Framework of the Operation
Among various open-source GIS programs, QGIS can be the best suitable option which can be used across partners for reasons outlined below.
 Comparison of Geographic Information Systems (GIS) software As of January 2018, WHO has reached an agreement with ESRI (an international supplier of GIS software) for an unlimited use of ArcGIS Desktop
Mapping Travel-To-Work Flows. Oliver O Brien and James Cheshire Department of Geography, UCL
 Mapping Travel-To-Work Flows Oliver O Brien and James Cheshire Department of Geography, UCL RSAI-BIS Annual Conference (UKDS-CS Sessions), Harrogate, 23 August 2017 Contents 1. The DataShine Project &
Bus Routes, New York NY, August 2017
 Page 1 of 6 Metadata format: ISO 19139 Bus Routes, New York NY, August 2017 ISO 19139 metadata content Resource Identification Information Spatial Representation Information Reference System Information
LIRR Routes, New York NY, May 2016
 Page 1 of 6 Metadata format: ISO 19139 LIRR Routes, New York NY, May 2016 ISO 19139 metadata content Resource Identification Information Spatial Representation Information Reference System Information
ArcGIS Pro: Essential Workflows STUDENT EDITION
 ArcGIS Pro: Essential Workflows STUDENT EDITION Copyright 2018 Esri All rights reserved. Course version 6.0. Version release date August 2018. Printed in the United States of America. The information contained
GIS FOR PLANNING. Course Overview. Schedule. Instructor. Prerequisites. Urban Planning 792 Thursday s 5:30-8:10pm SARUP 158
 GIS FOR PLANNING Urban Planning 792 Thursday s 5:30-8:10pm SARUP 158 Schedule Class/Lab - SARUP 158 Thursdays 5:30pm - 8:10pm Office Hours - By Appointment Project Ideas - Week 4 Final - 5/10/2018 Instructor