Merging statistics and geospatial information
|
|
|
- Sara Mathews
- 5 years ago
- Views:
Transcription


1 Merging statistics and geospatial information Demography / Commuting / Spatial planning / Registers Mirosław Migacz Chief GIS Specialist Janusz Dygaszewicz Director Central Statistical Office of Poland INSPIRE Conference 2014: Inspire for good governance Aalborg, June 17th 2013
2 Agenda The aim The team The tasks Spatial visualization of demographic data Enterprise address spatialization Commuting statistics Statistical indicators for spatial planning The results Conclusions 2

 Database of Topographic Objects (acquired from the mapping")
3 The aim Geospatial analysis with use of: Population and Housing Census 2011 results other statistical datasets possessed by CSO Evaluation of reference materials in geostatistics production process: Spatial address databases (maintained within official statistics) Database of Topographic Objects (acquired from the mapping agency) 3
4 The team Programming and Coordination of Statistical Surveys CSO, Warsaw 5 Urban Statistics SO Poznań 3 Regional and Environmental Surveys CSO, Warsaw 2 Statistical Computing Centre, Łódź 1 4
5 SPATIAL VISUALIZATION OF DEMOGRAPHIC DATA
6 Spatial visualization of demographic data Source data attribute data spatial data Methods of aggregation to various statistical units 1 km x 1 km grid Cadastral units Statisticalregions Census enumeration areas Cartographic presentation of theresults
 39 tables")
 Cadastral units (mapping agency) Kilometer grid Grid_ETRS89_LAEA_PL_1K (European Forum for Geography and")
7 Source data Attribute Tables with population distribution data acquiredfrom the Population and Housing Census 2011: Person ID X, Y coordinates (acquired from spatial address databases created and maintained within official statistics) 39 tables (one for each million people) Spatial Boundaries of statistical regions and census enumeration areas (spatial address databases) Cadastral units (mapping agency) Kilometer grid Grid_ETRS89_LAEA_PL_1K (European Forum for Geography and Statistics)


8 1 km x 1 km grid Grid_ETRS89_LAEA_PL_1K the european INSPIRE grid Cell coordinates lower left corner Aggregation of persons to specific grid cells possible w/o GIS software (Visual Basic for Applications used here for example)
9 1 km x 1 km grid Number of persons in each grid cell calculated with ArcGIS (Dissolve tool), though any other database software could be used The operation was conducted separately for each of the 39 tables


10 Cadastral units Aggregation to irregular division of space requires GIS software Environment: ArcGIS file geodatabase Spatial operations on a feature class with 38,5 mln objects exceed RAM capabilities of workstations and servers
 the initial dataset For each subsequent spatial join the current calculated population was added to the total")
11 Cadastral units Back to 39 separate tables >> need for automation Use of Python scripting with the arcpy module that contains all ArcGIS tools The script was processing 39 datasets Spatial join of the 1st dataset to the geometry of cadastral units (with calculation of total population) the initial dataset For each subsequent spatial join the current calculated population was added to the total population for each cadastral unit
12 Statistical regions and census enumeration areas The same tools that were used for cadastral units (ArcGIS, Python) A slightly different method of cyclic dataset processing: statisticalregions / census enumeration areas were spatially joined to datasets with persons 39 times >> 39 temporary feature classes 39 feature classes merged into one >> 1 feature class with 39 duplicate geometries for each statistical region / census enumeration area deduplication of the geometries with total population calculation for each geometry (Dissolve tool in ArcGIS)
13 Data aggregation conclusions Point data aggregation to grids can be done without GIS software any database software with e.g. VBA is sufficient Point data aggregation to an irregular division of space requires GIS software Processing of huge datasets requires automation, which can be acchieved with Python scripting: requires script preparation and testing on a data sample all processes can be run on a separate machine / server and they do not require the operator s attention
")


14 Cartographic presentation of the results 1 km x 1 km grid totalpopulationineachgridcell(= population density) Cadastral units, statistical regions, census enumeration areas choropleth maps of population density Classifications (5 classes) Colour scales average value as the center of the middle class 2 color gradient quantiles monochromatic
15 1 km x 1 km grid

16 1 km x 1 km grid
17 1 km x 1 km grid

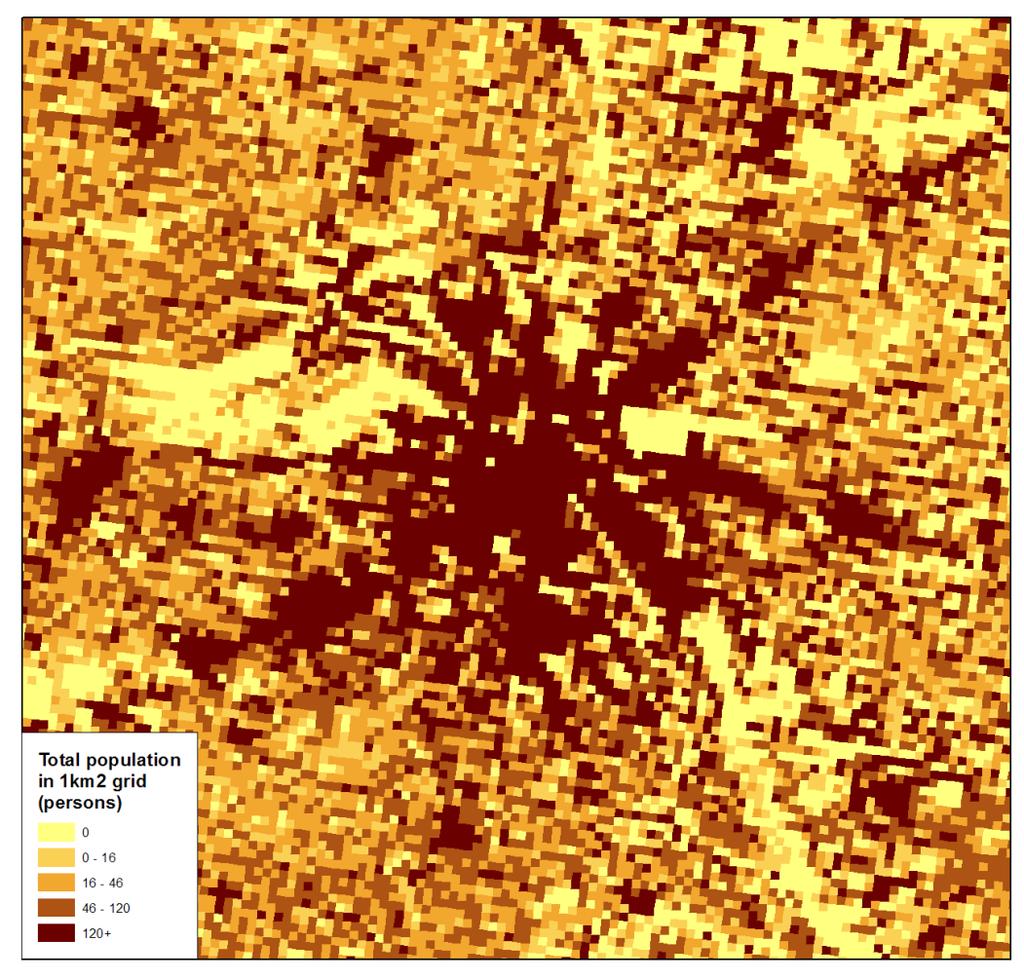
18 1 km x 1 km grid
19 Cadastral units
20 Census enumeration areas
21 Cadastral units quantiles

22 Census enumeration areas quantiles

23 Cadastral units vs census enumeration areas (quantiles)
24 Quantiles conclusions Significant differences between quantile presentations: For the 1 km x 1 km grid a separate class for 0 was created Huge differences in classification between cadastral units and census enumeration areas due to these divisions having been created for different purposes: Cadastral units for legal management of land ownership Census enumeration areas for the purpose of conducting censuses (size dependant on the population count)
25 ENTERPRISE ADDRESS SPATIALIZATION
 Database of Topographic Objects (acquired from the mapping")
26 Source data Attribute Social insurance registers Taxpayers register Inland revenues database Statistical register of enterprises Spatial Spatial address databases (maintained within official statistics) Database of Topographic Objects (acquired from the mapping agency)
 Address number simplification (e.g.")
27 Enterprise address spatialization Address descriptive information paired with: address points from the Spatial Address Databases address points from the Database of Topographic Objects Pairing as is (62%) Address number simplification (e.g. 3A > 3) (5,9%) No address point (nearest address number) (18,6%) No address number (address point on same street or locality centroid) (1,8%) No street ID (locality centroid) (3,6%) Other cases (locality centroid) (8,1%)
28 COMMUTING STATISTICS
29 Commuter a person whose employer s registered office is outside the administrative borders of the gmina (municipality, LAU2) of residence
30 Commuting statistics Source data attribute data spatial data Actions Directions of population movements related to employment Commuting to/from Poznań Commuting within voivodships Cartographic presentation of the results

31 Source data Attribute Tables with demographic data acquired from the Population and Housing Census 2011: Person ID Age Gender Dwelling address and X, Y coordinates Workplace address and X, Y coordinates Income Economic activity classification Factof commuting 3,1 million records Spatial Boundaries of the territorial division of the country Spatial Address Databases (source of dwelling coordinates and boundaries of statistical regions and census enumeration areas) Spatialized enterprise addresses (source of workplace coordinates) Kilometer grid Grid_ETRS89_LAEA_PL_1K (European Forum for Geography and Statistics)
")
32 Percentage of commuters in the number of employees statistical unit: powiat (county) (LAU1)

33 Surplus arriving / departing to work statistical unit: 1km x 1km grid (ETRS89 LAEA)

34 Surplus arriving / departing to work area: city of Poznań and surroundings statistical unit: 1km x 1km grid (ETRS89 LAEA)

35 Quotient of commuting flows area: city of Poznań statistical unit: census enumeration area


36 Arriving / departing to work area: city of Poznań statistical unit: 250m x 250m grid (ETRS89 LAEA)
")
37 Percentage of people commuting to voivodship (NUTS2) capitals statistical unit: gmina (municipality) (LAU2)
38 STATISTICAL INDICATORS FOR SPATIAL PLANNING
39 Statistical indicators for spatial planning Source data spatial data Scope selected administrative units Aims Sourcedata usability analysis for purposes of creating statistical indicators for spatial planning methodology for statistical indicators describing building density methodology for statistical indicators describing road density Cartographic presentation of the indicators
 Boundaries of the territorial division of the")
40 Source data Spatial Database of Topographic Objects (buildings and road network) cadastral data ortophotomap Boundaries of statistical regions and census enumeration areas (spatial address databases) Boundaries of the territorial division of the country
 from 4")

41 Scope 27 gminas (LAU2) from 4 powiats (LAU1) located north of Warsaw

42 Source data evaluation comparing the content of randomly selected grid cells within the Database of Topographic Objects with the ortophotomap roads 59 grid cells sampled out of a total number of ,7% cells with total compliance rest with compliance > 75% buildings 135 grid cells sampled out of a total number of ,5% cells with total compliance 37,8% cells with compliance > 75% rest majorly with compliance > 50% gaps found mainly in urban areas omissions in the building layer
 W W P P Z P Z Z PZ 100%")

43 Building density indicator (%) W W P P Z P Z Z PZ 100% P P building density ratio total building area survey area


44 Building density indicator town of Ząbki grid cell with the biggest number of buildings city of Wołomin grid cell with the highest building density ratio

45 Road density indicator (km/km2) WD DD PP DD total road length PP survey area

46 Road density model (m/km 2 )
47 CONCLUSIONS

48 Conclusions census results referenced to a point (X,Y) huge opportunity for spatial analyses geostatistical products that reflect user needs high demand for demographic data lower than LAU2 level positive reception of project results SUCCESS
 Wednesday, June 18 th, 16:00 @ Room 4 Geostatistics Portal the multitool for statistics on maps (session: Maps, Stats and")
49 Conclusions GEO.STAT.GOV.PL The project outcome will have a strong impact on future developments of the Geostatistics Portal (incl. INSPIRE services) Wednesday, June 18 th, Room 4 Geostatistics Portal the multitool for statistics on maps (session: Maps, Stats and Observation Data )
50 Merging statistics and geospatial information Demography / Commuting / Spatial planning / Registers Mirosław Migacz Chief GIS Specialist Central Statistical Office of m.migacz@stat.gov.pl
Rules of the territorial division
 Rules of the territorial division Janusz Dygaszewicz Central Statistical Office of Poland Jerusalem, 4-7 December 2016 Rules of territory division (the Polish case) The area of each unit of territorial
Common geographies for dissemination of SDG Indicators
 5 th High Level Forum on United Nations GGIM, Mexico 2017 Common geographies for dissemination of SDG Indicators Understanding statistical and geodetic division of territory Janusz Dygaszewicz Central
Principle 3: Common geographies for dissemination of statistics Poland & Canada. Janusz Dygaszewicz Statistics Poland
 Principle 3: Common geographies for dissemination of statistics Poland & Canada Janusz Dygaszewicz Statistics Poland Reference materials Primary: Ortophotomap, Cadastral Data, Administrative division borders,
The European Forum for Geospatial Statistics Benefits and challenges of INSPIRE in the field of statistics
 INSPIRE Conference 2016 Barcelona, Spain 26th 30th September 2016 The European Forum for Geospatial Statistics Benefits and challenges of INSPIRE in the field of statistics Janusz Dygaszewicz EFGS President
GIS FOR MAZOWSZE REGION - GENERAL OUTLINE
 GIS FOR MAZOWSZE REGION - GENERAL OUTLINE S. Bialousz 1), K Mączewski 2), E. Janczar 2), K. Osinska-Skotak 1) 1) Warsaw University of Technology, Warsaw, Poland 2) Office of the Surveyor of the Mazowieckie
Department of Economic and Social Affairs May 2007
 UNITED NATIONS SECRETARIAT ESA/STAT/AC.115/13 Department of Economic and Social Affairs May 2007 Statistics Division English only United Nations Expert Group Meeting on Contemporary Practices in Census
Understanding China Census Data with GIS By Shuming Bao and Susan Haynie China Data Center, University of Michigan
 Understanding China Census Data with GIS By Shuming Bao and Susan Haynie China Data Center, University of Michigan The Census data for China provides comprehensive demographic and business information
Brazil Paper for the. Second Preparatory Meeting of the Proposed United Nations Committee of Experts on Global Geographic Information Management
 Brazil Paper for the Second Preparatory Meeting of the Proposed United Nations Committee of Experts on Global Geographic Information Management on Data Integration Introduction The quick development of
Compact guides GISCO. Geographic information system of the Commission
 Compact guides GISCO Geographic information system of the Commission What is GISCO? GISCO, the Geographic Information System of the COmmission, is a permanent service of Eurostat that fulfils the requirements
GRID map of Household and Population data in Kosovo. European Forum for Geostatistics, 5 7 October 2009, in The Hague, Netherlands
 GRID map of Household and Population data in Kosovo European Forum for Geostatistics, 5 7 October 2009, in The Hague, Netherlands SUMMARY Introduction Data sources Methods Results, & Maps WebGIS Description
Statistical-geospatial integration - The example of Sweden. Marie Haldorson Director, Statistics Sweden
 Statistical-geospatial integration - The example of Sweden Marie Haldorson Director, Statistics Sweden Spatial data and geospatial applications at Statistics Sweden Long tradition GI integrated in production
1 ST High Level Forum on United Nations Global Geoespatial Information Management GEOGRAPHIC REFERENCING OF ECONOMIC UNITS. México
 1 ST High Level Forum on United Nations Global Geoespatial Information Management Thematic Seminar 27 October, Korea 2011. GEOGRAPHIC REFERENCING OF ECONOMIC UNITS México CONTENTS Introduction Census Cartography
Some practices of Geospatial coding and referencing statistics in Finland and in Europe
 Some practices of Geospatial coding and referencing statistics in Finland and in Europe Marja Tammilehto-Luode UN Expert Group on the Integration of Statistical and Geospatial Information 30.10. 1.11.2013
Hennig, B.D. and Dorling, D. (2014) Mapping Inequalities in London, Bulletin of the Society of Cartographers, 47, 1&2,
 Mapping Inequalities in London, Bulletin of the Society of Cartographers, 47, 1&2,") Hennig, B.D. and Dorling, D. (2014) Mapping Inequalities in London, Bulletin of the Society of Cartographers, 47, 1&2, 21-28. Pre- publication draft without figures Mapping London using cartograms The
Hennig, B.D. and Dorling, D. (2014) Mapping Inequalities in London, Bulletin of the Society of Cartographers, 47, 1&2, 21-28. Pre- publication draft without figures Mapping London using cartograms The
Geospatial Analysis of Job-Housing Mismatch Using ArcGIS and Python
 Geospatial Analysis of Job-Housing Mismatch Using ArcGIS and Python 2016 ESRI User Conference June 29, 2016 San Diego, CA Jung Seo, Frank Wen, Simon Choi and Tom Vo, Research & Analysis Southern California
Methodological issues in the development of accessibility measures to services: challenges and possible solutions in the Canadian context
 Methodological issues in the development of accessibility measures to services: challenges and possible solutions in the Canadian context Alessandro Alasia 1, Frédéric Bédard 2, and Julie Bélanger 1 (1)
GIS ADMINISTRATOR / WEB DEVELOPER EVANSVILLE-VANDERBURGH COUNTY AREA PLAN COMMISSION
 GIS ADMINISTRATOR / WEB DEVELOPER EVANSVILLE-VANDERBURGH COUNTY AREA PLAN COMMISSION SALARY RANGE INITIATION $43,277 SIX MONTHS $45,367 POSITION GRADE PAT VI The Evansville-Vanderburgh County Area Plan
Visualization of Origin- Destination Commuter Flow Using CTPP Data and ArcGIS
 Visualization of Origin- Destination Commuter Flow Using CTPP Data and ArcGIS Research & Analysis Department Southern California Association of Governments 2015 ESRI User Conference l July 23, 2015 l San
Qatar Statistical Geospatial Integration
 Qatar Statistical Geospatial Integration A Presentation by the Ministry of Development Planning & Statistics (MDPS), State of Qatar http://www.mdps.gov.qa (Fourth UN-GGIM Arab States Committee Meeting,
Gistat: moving towards a location information management system
 Gistat: moving towards a location information management system (merging geographical, statistical and historical information) Pina Grazia Ticca Marco Ballin Istat - Italy Aguascalientes, Mexico 2-4 December
Second High Level Forum on GGIM Seminar on Regional Cooperation in Geospatial Information Management Doha, Qatar, 7 February 2013
 Second High Level Forum on GGIM Seminar on Regional Cooperation in Geospatial Information Management Doha, Qatar, 7 February 2013 Overview on Geospatial Activities in Egypt BY : Eng.Nahla Seddik Mohamed
Combining Geospatial and Statistical Data for Analysis & Dissemination
 Combining Geospatial and Statistical Data for Analysis & Dissemination (with Special Reference to Qatar Census 2010) Presentation by Mansoor Al Malki, Director of IT Department Qatar Statistics Authority
Visualization of Commuter Flow Using CTPP Data and GIS
 Visualization of Commuter Flow Using CTPP Data and GIS Research & Analysis Department Southern California Association of Governments 2015 ESRI User Conference l July 23, 2015 l San Diego, CA Jung Seo,
The Added Value of Geospatial Data in a Statistical Office. Pedro Diaz Munoz Director Sectoral and Regional Statistics EUROSTAT European Commission
 The Added Value of Geospatial Data in a Statistical Office Pedro Diaz Munoz Director Sectoral and Regional Statistics EUROSTAT European Commission Why integrate Responsibility of all the information we
Integrating Official Statistics and Geospatial Information NBS Experience
 Integrating Official Statistics and Geospatial Information NBS Experience Presented by Eng. Reda AL Sabbagh Director of IT Dept. Prepared by Eng. Adham Makky GIS Specialist Topics to be covered: Background
Preparing the GEOGRAPHY for the 2011 Population Census of South Africa
 Preparing the GEOGRAPHY for the 2011 Population Census of South Africa Sharthi Laldaparsad Statistics South Africa; E-mail: sharthil@statssa.gov.za Abstract: Statistics South Africa (Stats SA) s Geography
Globally Estimating the Population Characteristics of Small Geographic Areas. Tom Fitzwater
 Globally Estimating the Population Characteristics of Small Geographic Areas Tom Fitzwater U.S. Census Bureau Population Division What we know 2 Where do people live? Difficult to measure and quantify.
Utilizing Data from American FactFinder with TIGER/Line Shapefiles in ArcGIS
 Utilizing Data from American FactFinder with TIGER/Line Shapefiles in ArcGIS Web Adams, GISP Data Dissemination Specialist U.S. Census Bureau New York Regional Office 1 What We Do Decennial Census Every
ArcGIS for Desktop. ArcGIS for Desktop is the primary authoring tool for the ArcGIS platform.
 ArcGIS for Desktop ArcGIS for Desktop ArcGIS for Desktop is the primary authoring tool for the ArcGIS platform. Beyond showing your data as points on a map, ArcGIS for Desktop gives you the power to manage
Analysis of travel-to-work patterns and the identification and classification of REDZs
 Analysis of travel-to-work patterns and the identification and classification of REDZs Dr David Meredith, Teagasc, Spatial Analysis Unit, Rural Economy Development Programme, Ashtown, Dublin 15. david.meredith@teagasc.ie
Estonian Place Names in the National Information System and the Place Names Register *
 UNITED NATIONS Working Paper GROUP OF EXPERTS ON No. 62 GEOGRAPHICAL NAMES Twenty-fifth session Nairobi, 5 12 May 2009 Item 10 of the provisional agenda Activities relating to the Working Group on Toponymic
CARTOGRAPHIC INFORMATION MANAGEMENT IN COLOMBIA REACH A LEVEL OF PERFECTION
 CARTOGRAPHIC INFORMATION MANAGEMENT IN COLOMBIA REACH A LEVEL OF PERFECTION Jaime Alberto Duarte Castro 1 Carrera 30 No. 48 51 Bogotá - Colombia, jduarte@igac.gov.co Claudia Inés Sepúlveda Fajardo 2 Carrera
Spatial Statistical Information Services in KOSTAT
 Distr. GENERAL WP.30 12 April 2010 ENGLISH ONLY UNITED NATIONS ECONOMIC COMMISSION FOR EUROPE (UNECE) CONFERENCE OF EUROPEAN STATISTICIANS EUROPEAN COMMISSION STATISTICAL OFFICE OF THE EUROPEAN UNION (EUROSTAT)
GIS Lecture 5: Spatial Data
 GIS Lecture 5: Spatial Data GIS 1 Outline Vector Data Formats Raster Data Formats Map Projections Coordinate Systems US Census geographic files US Census data files GIS Data Sources GIS 2 Vector Data Formats
BROOKINGS May
 Appendix 1. Technical Methodology This study combines detailed data on transit systems, demographics, and employment to determine the accessibility of jobs via transit within and across the country s 100
Spotlight on Population Resources for Geography Teachers. Pat Beeson, Education Services, Australian Bureau of Statistics
 Spotlight on Population Resources for Geography Teachers Pat Beeson, Education Services, Australian Bureau of Statistics Population Population size Distribution Age Structure Ethnic composition Gender
LAND INFORMATION SYSTEM A TOOL TO KEEP THE REGISTRY OF PLANNING PERMISSION. CASE STUDY OF THE SZCZUTOWO COMMUNE
 INFRASTRUKTURA I EKOLOGIA TERENÓW WIEJSKICH INFRASTRUCTURE AND ECOLOGY OF RURAL AREAS Nr 2/IV/2013, POLSKA AKADEMIA NAUK, Oddział w Krakowie, s. 15 27 Komisja Technicznej Infrastruktury Wsi LAND INFORMATION
CENSUS MAPPING WITH GIS IN NAMIBIA. BY Mrs. Ottilie Mwazi Central Bureau of Statistics Tel: October 2007
 CENSUS MAPPING WITH GIS IN NAMIBIA BY Mrs. Ottilie Mwazi Central Bureau of Statistics E-mail: omwazi@npc.gov.na Tel: + 264 61 283 4060 October 2007 Content of Presentation HISTORICAL BACKGROUND OF CENSUS
Disaster Management & Recovery Framework: The Surveyors Response
 Disaster Management & Recovery Framework: The Surveyors Response Greg Scott Inter-Regional Advisor Global Geospatial Information Management United Nations Statistics Division Department of Economic and
Improving rural statistics. Defining rural territories and key indicators of rural development
 Improving rural statistics Defining rural territories and key indicators of rural development Improving rural statistics Improving Rural Statistics In 2016, the Global Strategy to improve Agricultural
Integration for Informed Decision Making
 Geospatial and Statistics Policy Intervention: Integration for Informed Decision Making Greg Scott Global Geospatial Information Management United Nations Statistics Division Department of Economic and
SITMUN: Cooperating to Build Local SDIs in the Barcelona Region
 SITMUN: Cooperating to Build Local SDIs in the Barcelona Region Diputació de Barcelona Territory and Sustainability Area Territorial Information Systems Department INSPIRE CONFERENCE Barcelona, September
Department of Statistics Malaysia
 Department of Statistics Malaysia 1 2 1 2 3 4 5 Introduction Geographic Information Systems (GIS) Geospatial activities for 2020 Modernisation Way Forward 3 Malaysia Population (Millions) Census 2010 2018
Achieving the Vision Geo-statistical integration addressing South Africa s Developmental Agenda. geospatial + statistics. The Data Revolution
 Achieving the Vision Geo-statistical integration addressing South Africa s Developmental Agenda geospatial + statistics The Data Revolution humble beginnings, present & future - South Africa UN World Data
GED 554 IT & GIS. Lecture 6 Exercise 5. May 10, 2013
 GED 554 IT & GIS Lecture 6 Exercise 5 May 10, 2013 Free GIS data sources ******************* Mapping numerical data & Symbolization ******************* Exercise: Making maps for presentation GIS DATA SOFTWARE
National SDG Data Hubs: Statistical integration and geographic disaggregation (Philippines)
") National SDG Data Hubs: Statistical integration and geographic disaggregation (Philippines) 5 th High Level Forum on United Nations Global Geospatial Information Management Implementing the Sustainable
National SDG Data Hubs: Statistical integration and geographic disaggregation (Philippines) 5 th High Level Forum on United Nations Global Geospatial Information Management Implementing the Sustainable
Digitization in a Census
 Topics Connectivity of Geographic Data Sketch Maps Data Organization and Geodatabases Managing a Digitization Project Quality and Control Topology Metadata 1 Topics (continued) Interactive Selection Snapping
What are we like? Population characteristics from UK censuses. Justin Hayes & Richard Wiseman UK Data Service Census Support
 What are we like? Population characteristics from UK censuses Justin Hayes & Richard Wiseman UK Data Service Census Support Who are we? Richard Wiseman UK Data Service / Jisc Justin Hayes UK Data Service
FIRE DEPARMENT SANTA CLARA COUNTY
 DEFINITION FIRE DEPARMENT SANTA CLARA COUNTY GEOGRAPHIC INFORMATION SYSTEM (GIS) ANALYST Under the direction of the Information Technology Officer, the GIS Analyst provides geo-spatial strategic planning,
Evaluating e-government : implementing GIS services in Municipality
 Evaluating e-government : implementing GIS services in Municipality Municipality of Thessaloniki - G.I.S. Unit Misirloglou Symeon Head of the GIS Unit ESRI UC - 2016 The GIS Section - subset of the department
USING DOWNSCALED POPULATION IN LOCAL DATA GENERATION
 USING DOWNSCALED POPULATION IN LOCAL DATA GENERATION A COUNTRY-LEVEL EXAMINATION CONTENT Research Context and Approach. This part outlines the background to and methodology of the examination of downscaled
Acknowledgments xiii Preface xv. GIS Tutorial 1 Introducing GIS and health applications 1. What is GIS? 2
 Acknowledgments xiii Preface xv GIS Tutorial 1 Introducing GIS and health applications 1 What is GIS? 2 Spatial data 2 Digital map infrastructure 4 Unique capabilities of GIS 5 Installing ArcView and the
Key Elements of the Geographical Information System of Mexico *
 UNITED NATIONS E/CONF.99/IP.1 ECONOMIC AND SOCIAL COUNCIL Ninth United Nations Regional Cartographic Conference for the Americas New York, 10-14 August 2009 Item 7(a) of the provisional agenda Strategy,
GIS Building Communities beyond National Borders (Building Successful Spatial Data Infrastructures) Nick Land, ESRI Europe
 Nick Land, ESRI Europe") GIS Building Communities beyond National Borders (Building Successful Spatial Data Infrastructures) Nick Land, ESRI Europe UK worst flooding in the last 60 years 350,000 households without drinking water
GIS Building Communities beyond National Borders (Building Successful Spatial Data Infrastructures) Nick Land, ESRI Europe UK worst flooding in the last 60 years 350,000 households without drinking water
Hennepin GIS. Tree Planting Priority Areas - Analysis Methodology. GIS Services April 2018 GOAL:
 Hennepin GIS GIS Services April 2018 Tree Planting Priority Areas - Analysis Methodology GOAL: To create a GIS data layer that will aid Hennepin County Environment & Energy staff in determining where to
Sharthi Laldaparsad Statistics South Africa, Policy Research & Analysis. Sub-regional workshop on integration of administrative data,
 Sub-regional workshop on integration of administrative data, big data and geospatial information for the compilation of SDG indicators and International Workshop on Global Fundamental Geospatial Data Themes
compass.durhamnc.gov Building Community by Illustrating Community Durham s Neighborhood Compass
 Building Community by Illustrating Community Durham s Neighborhood Compass A presentation by John Killeen Rob Cushman Tyler Waring Neighborhood Improvement Services & Technology Solutions City of Durham,
Census Geography, Geographic Standards, and Geographic Information
 Census Geography, Geographic Standards, and Geographic Information Michael Ratcliffe Geography Division US Census Bureau New Mexico State Data Center Data Users Conference November 19, 2015 Today s Presentation
GEOGRAPHIC INFORMATION SYSTEMS Session 8
 GEOGRAPHIC INFORMATION SYSTEMS Session 8 Introduction Geography underpins all activities associated with a census Census geography is essential to plan and manage fieldwork as well as to report results
Study Visit University of Applied Sciences Utrecht Netherlands
 Study Visit University of Applied Sciences Utrecht Netherlands Directorate-General for Territorial Development Lisbon 1 April 2014 1 Agenda Presentation Cadastre Department Surveying / Geodesy Department
Typical information required from the data collection can be grouped into four categories, enumerated as below.
 Chapter 6 Data Collection 6.1 Overview The four-stage modeling, an important tool for forecasting future demand and performance of a transportation system, was developed for evaluating large-scale infrastructure
Egypt Public DSS. the right of access to information. Mohamed Ramadan, Ph.D. [R&D Advisor to the president of CAPMAS]
![Egypt Public DSS. the right of access to information. Mohamed Ramadan, Ph.D. [R&D Advisor to the president of CAPMAS]](/thumbs/89/98483713.jpg "Egypt Public DSS. the right of access to information. Mohamed Ramadan, Ph.D. [R&D Advisor to the president of CAPMAS]") Egypt Public DSS ì the right of access to information Central Agency for Public Mobilization and Statistics Arab Republic of Egypt Mohamed Ramadan, Ph.D. [R&D Advisor to the president of CAPMAS] Egypt
Egypt Public DSS ì the right of access to information Central Agency for Public Mobilization and Statistics Arab Republic of Egypt Mohamed Ramadan, Ph.D. [R&D Advisor to the president of CAPMAS] Egypt
ArcGIS Platform For NSOs
 ArcGIS Platform For NSOs Applying GIS and Spatial Thinking to Official Statistics Esri UC 2014 Demo Theater Applying GIS at the NSO Generic Statistical Business Process Model (GSBPM) 1 Specify Needs 2
Statewide Topographic Mapping Program
 Statewide Topographic Mapping Program February 28, 2018 www.dotd.la.gov Outline Purpose of the Statewide Topographic Mapping Program History Breakdown of R.S. 48:36 - Topographic Mapping Statewide Topographic
Data Aggregation with InfraWorks and ArcGIS for Visualization, Analysis, and Planning
 Data Aggregation with InfraWorks and ArcGIS for Visualization, Analysis, and Planning Stephen Brockwell President, Brockwell IT Consulting, Inc. Join the conversation #AU2017 KEYWORD Class Summary Silos
Map your way to deeper insights
 Map your way to deeper insights Target, forecast and plan by geographic region Highlights Apply your data to pre-installed map templates and customize to meet your needs. Select from included map files
Understanding and accessing 2011 census aggregate data
 Understanding and accessing 2011 census aggregate data 4 July 11:00 to 16:00 BST Justin Hayes and Richard Wiseman UK Data Service Census Support UK censuses provide an unparalleled resource of high quality
ENVIRONMENTAL VULNERABILITY INDICATORS OF THE COASTAL SLOPES OF SÃO PAULO, BRAZIL *
 ENVIRONMENTAL VULNERABILITY INDICATORS OF THE COASTAL SLOPES OF SÃO PAULO, BRAZIL * D ANTONA, Álvaro de O. (FCA, NEPO-Unicamp, Brazil) BUENO, Maria do Carmo D. (IBGE; IFCH-Unicamp, Brazil) IWAMA, Allan
ArcGIS Enterprise: What s New. Philip Heede Shannon Kalisky Melanie Summers Sam Williamson
 ArcGIS Enterprise: What s New Philip Heede Shannon Kalisky Melanie Summers Sam Williamson ArcGIS Enterprise is the new name for ArcGIS for Server What is ArcGIS Enterprise ArcGIS Enterprise is powerful
THE USE OF GEOGRAPHICAL INFORMATION SYSTEMS IN THE URBAN COMMUNES OF ŁÓDŹ METROPOLITAN AREA
 THE USE OF GEOGRAPHICAL INFORMATION SYSTEMS IN THE URBAN COMMUNES OF ŁÓDŹ METROPOLITAN Marcin FELTYNOWSKI Department of Regional Economics and the Environment, University of Łódź, Rewolucji street no 39,
Spatial Organization of Data and Data Extraction from Maptitude
 Spatial Organization of Data and Data Extraction from Maptitude N. P. Taliceo Geospatial Information Sciences The University of Texas at Dallas UT Dallas GIS Workshop Richardson, TX March 30 31, 2018 1/
Emerging Trends in Institutional Arrangements Europe - Finland
 Emerging Trends in Institutional Arrangements Europe - Finland Arvo Kokkonen Deputy Director General National Land Survey of Finland 1 Contents Facts about Finland National Land Survey of Finland European
Support to Statistics. Kosovo
 TWINNING CONTRACT Support to Statistics Kosovo MISSION REPORT on Visualization of statistics using GIS software Component no 4.3.2 Mission carried out by Troels Aksel Vestergaard, Statistics Denmark 18-20
NATIONAL BENEFITS OF INSPIRE IMPLEMENTATION THE REAL LIFE USE CASES
 NATIONAL BENEFITS OF INSPIRE IMPLEMENTATION THE REAL LIFE USE CASES Andrius Balciunas, SE GIS Centras, a.balciunas@gis centras.lt Evaldas Rozanskas, SE GIS Centras, e.rozanskas@gis centras.lt INSPIRE conference
GIS for the Non-Expert
 GIS for the Non-Expert Ann Forsyth University of Minnesota February 2006 GIS for the Non-Expert 1. Definitions and problems 2. Measures being tested in Twin Cities Walking Study Basic approach, data, variables
The Efforts of Building GIS Infrastructure in a Newly Independent State: The case of Timor Leste *
 UNITED NATIONS E/CONF.100/IP.12 ECONOMIC AND SOCIAL COUNCIL Eighteenth United Nations Regional Cartographic Conference for Asia and the Pacific Bangkok, 26-29 October 2009 Item 7(b) of the provisional
Geographic Information Systems (GIS) in Environmental Studies ENVS Winter 2003 Session III
 in Environmental Studies ENVS Winter 2003 Session III") Geographic Information Systems (GIS) in Environmental Studies ENVS 6189 3.0 Winter 2003 Session III John Sorrell York University sorrell@yorku.ca Session Purpose: To discuss the various concepts of space,
Geographic Information Systems (GIS) in Environmental Studies ENVS 6189 3.0 Winter 2003 Session III John Sorrell York University sorrell@yorku.ca Session Purpose: To discuss the various concepts of space,
The 2010 Census Successful Because of GIS
 The 2010 Census Successful Because of GIS Timothy F. Trainor Chief, Geography Division, U.S. Census Bureau Vice President, International Cartographic Association Establishing the Framework of the Operation
Spatiotemporal Analysis of Commuting Patterns: Using ArcGIS and Big Data
 Spatiotemporal Analysis of Commuting Patterns: Using ArcGIS and Big Data 2017 ESRI User Conference July 13, 2017 San Diego, VA Jung Seo, Tom Vo, Frank Wen and Simon Choi Research & Analysis Southern California
Making space for a more foundational construction sector in Brussels
 Making space for a more foundational construction sector in Brussels Sarah De Boeck, David Bassens & Michael Ryckewaert Social innovation in the Foundational Economy Cardiff, 5 th of September 2018 1.
European Regional and Urban Statistics
 European Regional and Urban Statistics Dr. Berthold Feldmann berthold.feldmann@ec.europa.eu Eurostat Structure of the talk Regional statistics in the EU The tasks of Eurostat Regional statistics Urban
Crime Analysis. GIS Solutions for Intelligence-Led Policing
 Crime Analysis GIS Solutions for Intelligence-Led Policing Applying GIS Technology to Crime Analysis Know Your Community Analyze Your Crime Use Your Advantage GIS aids crime analysis by Identifying and
CHANGES IN THE STRUCTURE OF POPULATION AND HOUSING FUND BETWEEN TWO CENSUSES 1 - South Muntenia Development Region
 TERITORIAL STATISTICS CHANGES IN THE STRUCTURE OF POPULATION AND HOUSING FUND BETWEEN TWO CENSUSES 1 - South Muntenia Development Region PhD Senior Lecturer Nicu MARCU In the last decade, a series of structural
The Building Blocks of the City: Points, Lines and Polygons
 The Building Blocks of the City: Points, Lines and Polygons Andrew Crooks Centre For Advanced Spatial Analysis andrew.crooks@ucl.ac.uk www.gisagents.blogspot.com Introduction Why use ABM for Residential
High resolution population grid for the entire United States
 High resolution population grid for the entire United States A. Dmowska, T. F. Stepinski Space Informatics Lab, Department of Geography, University of Cincinnati, Cincinnati, OH 45221-0131, USA Telephone:
A User s Guide to the Federal Statistical Research Data Centers
 A User s Guide to the Federal Statistical Research Data Centers Mark Roberts Professor of Economics and Director PSU FSRDC September 2016 M. Roberts () RDC User s Guide September 2016 1 / 14 Outline Introduction
Lecture 10 Mapping Quantities: Dot Density Maps
 Lecture 10 Mapping Quantities: Dot Density Maps Introduction Creating maps of features based on quantity are some of the most common and important types of maps. In order to create maps that show quantity
The Role of the Louisiana Geographic Information Center in the Response to Hurricane Katrina
 The Role of the Louisiana Geographic Information Center in the Response to Hurricane Katrina By: Jared Chapiewsky & Laura Brown For: URPL 969- GIS Applications in Response to Hurricane Katrina Date: March
ISO Series Standards in a Model Driven Architecture for Landmanagement. Jürgen Ebbinghaus, AED-SICAD
 ISO 19100 Series Standards in a Model Driven Architecture for Landmanagement Jürgen Ebbinghaus, AED-SICAD 29.10.2003 The Company 100% SIEMENS PTD SIEMENS Business Services Shareholder & Strategic Business
Census Transportation Planning Products (CTPP)
") Census Transportation Planning Products (CTPP) Penelope Weinberger CTPP Program Manager - AASHTO September 15, 2010 1 What is the CTPP Program Today? The CTPP is an umbrella program of data products, custom
Census Transportation Planning Products (CTPP) Penelope Weinberger CTPP Program Manager - AASHTO September 15, 2010 1 What is the CTPP Program Today? The CTPP is an umbrella program of data products, custom
Geospatial Enabling Resilient Development. Latin America Geospatial Forum Río de Janeiro September 2013
 Geospatial Enabling Resilient Development Latin America Geospatial Forum Río de Janeiro September 2013 Presentation Index INEGI /SNIEG Geostatistical Frame - Georeferenciation Issues Legal Framework Mexican
Empowering Local Health through GIS
 Empowering Local Health through GIS Mapping data from Washington s Immunization Information System (IIS). Presented to IACW October 16 th, 2013 by: Chris Halsell and Isaiah Berg Agenda IIS Overview Why
Use of administrative registers for strengthening the geostatistical framework of the Census of Agriculture in Mexico
 Use of administrative registers for strengthening the geostatistical framework of the Census of Agriculture in Mexico Susana Pérez INEGI, Dirección de Censos y Encuestas Agropecuarias. Avenida José María
How GIS can support the Production
 How GIS can support the Production of Local Development Plans ESRI User Conference 2017 Mandy Maas ARUP Who we are Shaping a better world We are an independent firm of designers, planners, engineers, consultants
Data Collection. Lecture Notes in Transportation Systems Engineering. Prof. Tom V. Mathew. 1 Overview 1
 Data Collection Lecture Notes in Transportation Systems Engineering Prof. Tom V. Mathew Contents 1 Overview 1 2 Survey design 2 2.1 Information needed................................. 2 2.2 Study area.....................................
Introduction to ArcGIS Maps for Office. Greg Ponto Scott Ball
 Introduction to ArcGIS Maps for Office Greg Ponto Scott Ball Agenda What is Maps for Office? Platform overview What are Apps for the Office? ArcGIS Maps for Office features - Visualization - Geoenrichment
Using ArcGIS 10 to Estimate the U.S. Population Affected by Drought
 Using ArcGIS 10 to Estimate the U.S. Population Affected by Drought Jeff Nothwehr National Drought Mitigation Center University of Nebraska-Lincoln Overview What is the U.S. Drought Monitor Mapping Process
Utilizing GIS Technology for Rockland County. Rockland County Planning Department Douglas Schuetz & Scott Lounsbury
 Utilizing GIS Technology for Rockland County Rockland County Planning Department Douglas Schuetz & Scott Lounsbury Presentation Agenda Introduction What is GIS What can GIS do GIS Efforts for BOE Resources
FUNDAMENTALS OF GEOINFORMATICS PART-II (CLASS: FYBSc SEM- II)
") FUNDAMENTALS OF GEOINFORMATICS PART-II (CLASS: FYBSc SEM- II) UNIT:-I: INTRODUCTION TO GIS 1.1.Definition, Potential of GIS, Concept of Space and Time 1.2.Components of GIS, Evolution/Origin and Objectives
FUNDAMENTALS OF GEOINFORMATICS PART-II (CLASS: FYBSc SEM- II) UNIT:-I: INTRODUCTION TO GIS 1.1.Definition, Potential of GIS, Concept of Space and Time 1.2.Components of GIS, Evolution/Origin and Objectives
THE SPATIAL DATA WAREHOUSE OF SEOUL
 THE SPATIAL DATA WAREHOUSE OF SEOUL Jae-Ho Han The Seoul Metropolitan Government Seoul City Hall, Taepyeongno 1(il)-ga, Jung-gu, Seoul 100-744, Korea djhjha@hanmail.net Impyeong Lee Dept. of Geoinformatics,