Geostatistics: Kriging
|
|
|
- Walter Cannon
- 6 years ago
- Views:
Transcription
1 Geostatistics: Kriging Konetekniikka 1, Otakaari 4, Rangsima Sunila, D.Sc.
2 Background What is Geostatitics Concepts Variogram: experimental, theoretical Anisotropy, Isotropy Lag, Sill, Range, Nugget Types of Kriging Example of kriging interpolation 2

3 Interpolation How to estimate unknown values at specific locations. 3
4 Spatial Interpolation Examples Trend surfaces Nearest neighbours: Thiessen(voronoi) Inverse distance weighting (IDW) Splines Kriging 4
5 Example: Site x y z D to (5,5) We would like to estimate the variable value at (5,5) 5
6 Example: IDW Value of z(x) is estimated from all known values of z at all n points. (Weighted Moving Average technique) z( x) n i 1 Weights usually add to 1, w i z i n i 1 w i 1 6
7 Example: IDW In IDW, the weights weights are based on the distance from each of the known points (i) to the point we are trying to estimate (k): d ik. In IDW, we consider the inverse distance, 1/d ik 1 dik wi n 1 d 1 1 ik 7
8 Example: IDW Location (x,y) z D to (5,5) ID Weights (2,2) (3,7) (9,9) (6,5) (5,3) sum Z(5,5) = (3) (4) (2) (4) (6) =
9 Historical background Geostatistics, first developed by Georges Matheron ( ), the French geomathematician. The major concepts and theory were discovered during while he was working with the French Geological Survey in Algeria and France. In 1963, he defined the linear geostatistics and concepts of variography, varaiances of estimation and kriging (named after Danie Krige) in the Traité de géostatistique appliquée. The principles of geostatistics was published in Economic Geology Vol. 58, Kriging was named in honour of Danie Krige ( ), the South African mining engineer who developed the methods of interpolation. 9
10 What is Geostatistics Techniques which are used for mapping of surfaces from limited sample data and the estimation of values at unsampled locations Geostatistics is used for: spatial data modelling characterizing the spatial variation spatial interpolation simulation optimization of sampling characterizing the uncertainty The idea of geostatistics is the points which are close to each other in the space should be likely close in values. 10
11 Mining Geography Geology Geophysics Oceanography Hydrography Meterology Biotechnology Enviromental studies Agriculture 11
12 Geostatistical methods provide How to deal with the limitations of deterministic interpolation The prediction of attribute values at unvisited points is optimal BLUE (Best Linear Unbiased Estimate) 12
13 Geostatistical method for interpolation Reconigtion that the spatial variation of any continuous attribute is often too irregular to be modelled by a simple mathematical function. The variation can be described better by a stochastic surface. The interpolation with geostatistics is known as kriging. 13

14 Variogram cloud O Sullivan & Unwin, 2002) 14
15 Variogram/Semivariogram Variogram is the variance of the difference random variables at two locations To examine the spatial continuity of a regionalized variable and how this continuity changes as a function of distance and direction. The computation of a variogram involves plotting the relationship between the semivariance and the lag distance Measure the strength of correlation as a function of distance Quantify the spatial autocorrelation 15
16 Semivariogram, y(h) Variogram Variability increase Lag distance (h) 16
17 Variograms Half of average squared difference between the paired data values. The variogram calculated by h 1 2N( h) ( i, j) h ij ( x h i x j 2 ) 17
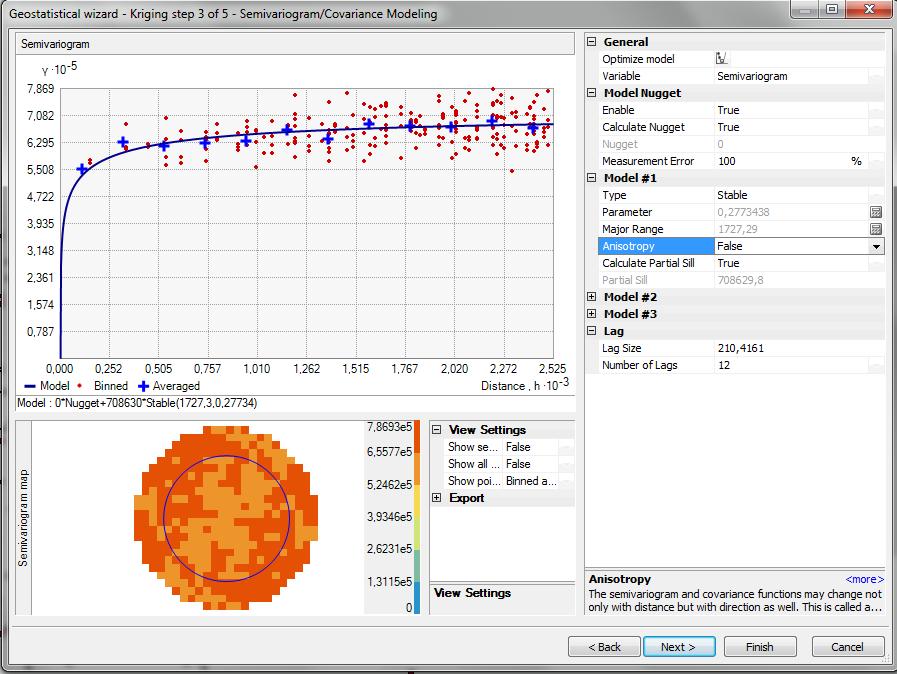
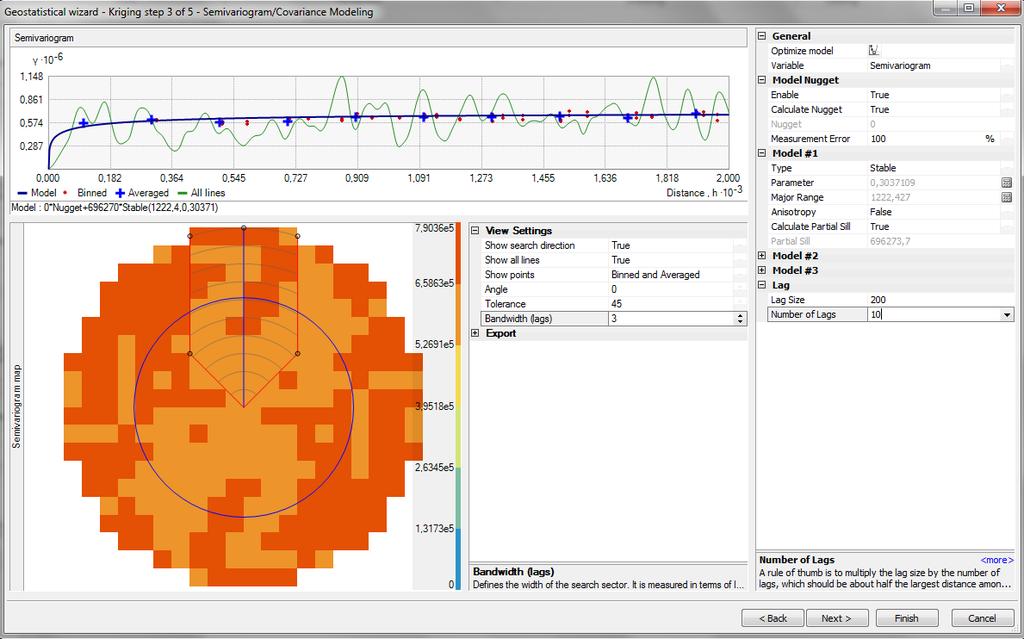
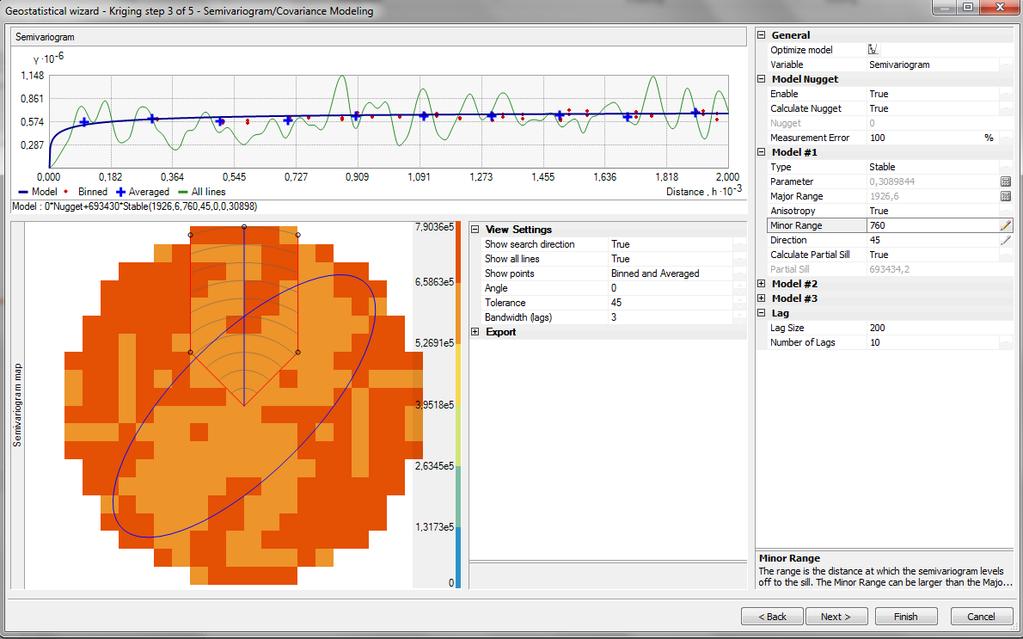
18 Variogram Experimental variogram (sample or observed variogram) : when variogram is computed from sampled data. The first step towards a quantitative description of the regionalized variation. Theoretical variogram or variogram model: when it is modelled to fit the experimental variogram. 18

19 19
20 Omnidirectional variogram Omnidirectional variogram is a test for erratic directional variograms The omnidirectional variogram contains more sample pairs than any directional variogram so it is more likely to show a clearly interpretable structure. If the omnidirectional variogram is messy, then try to discover the reasons for the erraticness, e.g. Examine the h-scatterplots may reveal that a single sample value shows large influence on the calculations. 20
21 Isotropy The spatial correlation structure has no directional effects, the resulting variogram averages the variogram over all directions. The covariance function, correlogram, and semivariogram depend only on the magnitude of the lag vector h and not the direction The empirical semivariogram can be computed by pooling data pairs separated by the appropriate distances, regardless of direction. The semevariogram describes omnidirectional. 21
22 22
23 23
24 24
25 Anisotropy Spatial variation is not the same in all directions The variogram is computed for specific directions If the process is anisotropy, then so is the variogram 25
26 26
27 27
28 Fitting variogram models Why do we need a variogram model? We need a variogram value for some distance or direction for which we do not have a sample variogram value. 28
29 Fitting variogram models Fitting variogram models can be difficult The accuracy of the observed semivariance is not constant The variation may be anisotropic The experimental variogram may contain much point-to-point fluctuation Most models are non-linear in one or more parameters Both visual inspection and statistical fitting are recommended 29
30 Fitting variogram models Fitting variogram models may be poor Chose unsuitable model in the first place Give poor estimates of the parameters at the start of the iteration A lot of scatter in the expertimental variogram The computer program was faulty 30
31 Description Lag The distance between sampling pairs. Range The point where the semivariogram reaches the sill on the lag h axis. Sample points that are farther apart than range are not spatially autocorrelated. Nugget The point where semivariance intercepts the ordinate. Sill The value where the semivariogram first flattens off, the maximum level of semivariance. The points above the sill indicate negative spatial correlation and vice versa. 31
32 Fitting variogram models h Spherical h Exponenial range sill range sill nugget nugget Lag (h) Lag (h) h Linear h Gaussian range sill nugget nugget Lag (h) Lag (h) 32
33 Fitting variogram models Spherical Exponential Linear Gaussian

34 Source: Longley, P.A., Goodchild, M.F., Maguire, D.J. And Rhind, D.W., 2001, Geographic Information Systems and Science 34
35 Spherical model 35
36 Exponential model Gaussian model Linear model 36
37 Nested structure One variogram model can be created by several variogram models ( h) i i( h) and i 1 ( h) ( h) ( h) t n

38 Nested Structure Example: the nested spherical or double spherical 38
39 Ordinary kriging In ordinary kriging, a probability model is used in which the bias and error variance can be computed and select weights for the neighbour sample locations that the everage error for the model is 0 and the error variance is minimized. The procedure of ordinary kriging is similar to weighted moving average except the weights are derived from geostatistical analysis. 39
40 Ordinary kriging The estimationi by ordinary kringing can be expressed by: n n z( x ) z( where i 1 0 i x i ) i 1 The minimum variance of z(x 0 ) is n i 1 And it is obtained when n i 1 i 2 i j x, x ( x i 1 ( x, x ) i j i 0, x0) for all j 40
41 Example: Site x y z D to (5,5) We would like to estimate the variable value at (5,5) 41
42 Example:Ordinary kriging Computing kriging weights for the unsampled point x = 5, y = 5. Let the spatial variation of the attribute sampled at the five points be modelled by a spherical variogram with parameters c 0 =2.5, c 1 =7.5 and range a = 10. The data at the five sampled points are: We need to solve x y z A 1 b Where A is the matrix of semivarainces between of pairs of data points, b is the vector of semivariances between each data point and the point to be predicted, λ is the vector of weights and φ is a lagrangian for solving the equations. Example from Principles of Geographical Information Systems by Burrough and McDonnell, 1998, Oxford University Press 42
43 Example:Ordinary kriging Value at (5,5) = weights * z = With estimation variance = (weights*b)+ Ф = ( ) = Note: The estimation error variance is also known as kriging variance. 43
44 Comparison of the results Method Estimate value z(5,5) IDW Ordinary Kriging (Kriging variance) (4.0628) 44
45 Block kriging The modification of kriging equations to estimate an average value z(b) of the variable z over a block of area B. 10 z3 8 z4 6 z2 4 z1 2 z

46 Block kriging Example showing a regular 2x3 grid of point locations within a block. Each discretizing point accounts for the same area. Example from An introduction to applied Geostatistics by Edward H. Isaaks and R.Mohan Srivastava 46
47 Block kriging The average value of z(b) over the block B is given by is estimated by z( B) B z( x) dx areab with n i 1 1 i zˆ ( B) n i 1 z( i x i ) 47
48 Block kriging The minimum variance is and is obtained with ), ( ), ( ) ( 1 2 B B B x B i n i i n i j j i i j for all B x x x 1 ), ( ), ( 48
49 1: (+531) 2: (+75) 4: (+333) 5: (+280) 3: (+326) Example from An introduction to applied Geostatistics by Edward H. Isaaks and R.Mohan Srivastava 49
50 1: (+531) 2: (+75) a 4: (+333) b 5: (+280) c d 3: (+326) 50
51 Example: Block kriging Point Estimate Kriging weights for samples a b c d Average
52 Simple kriging It is similar to ordinary kriging except that the weights sum equation (=1) is not added. The mean is a known constant. It uses the average of the entire data set. (ordinary kriging uses local average : the average of the points in the subset for a particular interpolation point) 52
53 Cokriging It is an extension of ordinary kriging where two or more variables are interdependent. How: U and V are spatial correlated Variable U can be used to predict variable V that is information about spatial variation of U can help to map V. Why: V data may be expensive to measure or collect or have some limitations in data collection process so the data may be infrequent. U data, on the other hand, may be cheap to measure and possible to collect more observations. 53
54 Indicator kriging Binary value From a continuous variable z(x), an indicator can be created by indicating it 1 for z(x) is less than or equal to a cut-off value, z c, and 0 otherwise ( x) 1 0 if z( x) z otherwise c 54
55 Kriging: Step by step Studying the gathered data: data analysis Fitting variogram models: experimental variogram and theoretical variogram models Estimating values at those locations which have not been sampled (kriging) e.g. ordinary kriging, simple kriging, indicator kriging and so on Examining standard error which may be used to quantify confidence levels Kriging interpolation 55
56 Example Elevation data set in Rastila 2000 laser scanning points Minimum 0 Maximum 18 Mean Median 0 Skewness Kurtosis Standard deviation Variance

57 Example 57

58 Example Variogram model range nugget sill length Exponential Linear Gaussian Spherical Exponential Linear Gaussian Spherical Exponential Linear Gaussian
59 Example Variogram model RMSE Exponential (0.5) Linear (0.5) Gaussian (0.5) Spherical (0.75) Exponential (0.75) Linear (0.75) Gaussian (0.75) Spherical (0.95) Exponential (0.95) Linear (0.95) Gaussian (0.95)
60 Example 60

61 Example 61
62 References: Geographic information Analysis by Sullivan, D. And Unwin, D. Geostatistics for Environmental Scientists by Richard Webster and Margaret Oliver Principle of Geographical Information Systems, Chapter 5 and 6 by Peter Burrough and Rachael McDonnell An Introduction to Applied Geostatistics by Edward Isaaks and Mohan Srivastava Quality Aspects in Spatial Data Mining by Alfred Stein, Wenzhong Shi and Wietske Bijker 62
11/8/2018. Spatial Interpolation & Geostatistics. Kriging Step 1
 (Z i Z j ) 2 / 2 (Z i Zj) 2 / 2 Semivariance y 11/8/2018 Spatial Interpolation & Geostatistics Kriging Step 1 Describe spatial variation with Semivariogram Lag Distance between pairs of points Lag Mean
Soil Moisture Modeling using Geostatistical Techniques at the O Neal Ecological Reserve, Idaho
 Final Report: Forecasting Rangeland Condition with GIS in Southeastern Idaho Soil Moisture Modeling using Geostatistical Techniques at the O Neal Ecological Reserve, Idaho Jacob T. Tibbitts, Idaho State
Spatial Interpolation & Geostatistics
 (Z i Z j ) 2 / 2 Spatial Interpolation & Geostatistics Lag Lag Mean Distance between pairs of points 1 y Kriging Step 1 Describe spatial variation with Semivariogram (Z i Z j ) 2 / 2 Point cloud Map 3
Propagation of Errors in Spatial Analysis
 Stephen F. Austin State University SFA ScholarWorks Faculty Presentations Spatial Science 2001 Propagation of Errors in Spatial Analysis Peter P. Siska I-Kuai Hung Arthur Temple College of Forestry and
ENGRG Introduction to GIS
 ENGRG 59910 Introduction to GIS Michael Piasecki October 13, 2017 Lecture 06: Spatial Analysis Outline Today Concepts What is spatial interpolation Why is necessary Sample of interpolation (size and pattern)
Lecture 5 Geostatistics
 Lecture 5 Geostatistics Lecture Outline Spatial Estimation Spatial Interpolation Spatial Prediction Sampling Spatial Interpolation Methods Spatial Prediction Methods Interpolating Raster Surfaces with
Copyright The McGraw-Hill Companies, Inc. Permission required for reproduction or display.
 Chapter 15. SPATIAL INTERPOLATION 15.1 Elements of Spatial Interpolation 15.1.1 Control Points 15.1.2 Type of Spatial Interpolation 15.2 Global Methods 15.2.1 Trend Surface Models Box 15.1 A Worked Example
Index. Geostatistics for Environmental Scientists, 2nd Edition R. Webster and M. A. Oliver 2007 John Wiley & Sons, Ltd. ISBN:
 Index Akaike information criterion (AIC) 105, 290 analysis of variance 35, 44, 127 132 angular transformation 22 anisotropy 59, 99 affine or geometric 59, 100 101 anisotropy ratio 101 exploring and displaying
Spatial Analysis II. Spatial data analysis Spatial analysis and inference
 Spatial Analysis II Spatial data analysis Spatial analysis and inference Roadmap Spatial Analysis I Outline: What is spatial analysis? Spatial Joins Step 1: Analysis of attributes Step 2: Preparing for
BAYESIAN MODEL FOR SPATIAL DEPENDANCE AND PREDICTION OF TUBERCULOSIS
 BAYESIAN MODEL FOR SPATIAL DEPENDANCE AND PREDICTION OF TUBERCULOSIS Srinivasan R and Venkatesan P Dept. of Statistics, National Institute for Research Tuberculosis, (Indian Council of Medical Research),
Exploring the World of Ordinary Kriging. Dennis J. J. Walvoort. Wageningen University & Research Center Wageningen, The Netherlands
 Exploring the World of Ordinary Kriging Wageningen University & Research Center Wageningen, The Netherlands July 2004 (version 0.2) What is? What is it about? Potential Users a computer program for exploring
OFTEN we need to be able to integrate point attribute information
 ALLAN A NIELSEN: GEOSTATISTICS AND ANALYSIS OF SPATIAL DATA 1 Geostatistics and Analysis of Spatial Data Allan A Nielsen Abstract This note deals with geostatistical measures for spatial correlation, namely
7 Geostatistics. Figure 7.1 Focus of geostatistics
 7 Geostatistics 7.1 Introduction Geostatistics is the part of statistics that is concerned with geo-referenced data, i.e. data that are linked to spatial coordinates. To describe the spatial variation
An Introduction to Pattern Statistics
 An Introduction to Pattern Statistics Nearest Neighbors The CSR hypothesis Clark/Evans and modification Cuzick and Edwards and controls All events k function Weighted k function Comparative k functions
PRODUCING PROBABILITY MAPS TO ASSESS RISK OF EXCEEDING CRITICAL THRESHOLD VALUE OF SOIL EC USING GEOSTATISTICAL APPROACH
 PRODUCING PROBABILITY MAPS TO ASSESS RISK OF EXCEEDING CRITICAL THRESHOLD VALUE OF SOIL EC USING GEOSTATISTICAL APPROACH SURESH TRIPATHI Geostatistical Society of India Assumptions and Geostatistical Variogram
ENVIRONMENTAL MONITORING Vol. II - Geostatistical Analysis of Monitoring Data - Mark Dowdall, John O Dea GEOSTATISTICAL ANALYSIS OF MONITORING DATA
 GEOSTATISTICAL ANALYSIS OF MONITORING DATA Mark Dowdall Norwegian Radiation Protection Authority, Environmental Protection Unit, Polar Environmental Centre, Tromso, Norway John O Dea Institute of Technology,
Introduction. Semivariogram Cloud
 Introduction Data: set of n attribute measurements {z(s i ), i = 1,, n}, available at n sample locations {s i, i = 1,, n} Objectives: Slide 1 quantify spatial auto-correlation, or attribute dissimilarity
Umeå University Sara Sjöstedt-de Luna Time series analysis and spatial statistics
 Umeå University 01-05-5 Sara Sjöstedt-de Luna Time series analysis and spatial statistics Laboration in ArcGIS Geostatistical Analyst These exercises are aiming at helping you understand ArcGIS Geostatistical
Investigation of Monthly Pan Evaporation in Turkey with Geostatistical Technique
 Investigation of Monthly Pan Evaporation in Turkey with Geostatistical Technique Hatice Çitakoğlu 1, Murat Çobaner 1, Tefaruk Haktanir 1, 1 Department of Civil Engineering, Erciyes University, Kayseri,
Anomaly Density Estimation from Strip Transect Data: Pueblo of Isleta Example
 Anomaly Density Estimation from Strip Transect Data: Pueblo of Isleta Example Sean A. McKenna, Sandia National Laboratories Brent Pulsipher, Pacific Northwest National Laboratory May 5 Distribution Statement
A Geostatistical Approach to Predict the Average Annual Rainfall of Bangladesh
 Journal of Data Science 14(2016), 149-166 A Geostatistical Approach to Predict the Average Annual Rainfall of Bangladesh Mohammad Samsul Alam 1 and Syed Shahadat Hossain 1 1 Institute of Statistical Research
Spatiotemporal Analysis of Environmental Radiation in Korea
 WM 0 Conference, February 25 - March, 200, Tucson, AZ Spatiotemporal Analysis of Environmental Radiation in Korea J.Y. Kim, B.C. Lee FNC Technology Co., Ltd. Main Bldg. 56, Seoul National University Research
Spatial Data Mining. Regression and Classification Techniques
 Spatial Data Mining Regression and Classification Techniques 1 Spatial Regression and Classisfication Discrete class labels (left) vs. continues quantities (right) measured at locations (2D for geographic
2.6 Two-dimensional continuous interpolation 3: Kriging - introduction to geostatistics. References - geostatistics. References geostatistics (cntd.
 .6 Two-dimensional continuous interpolation 3: Kriging - introduction to geostatistics Spline interpolation was originally developed or image processing. In GIS, it is mainly used in visualization o spatial
Advances in Locally Varying Anisotropy With MDS
 Paper 102, CCG Annual Report 11, 2009 ( 2009) Advances in Locally Varying Anisotropy With MDS J.B. Boisvert and C. V. Deutsch Often, geology displays non-linear features such as veins, channels or folds/faults
Geostatistical Interpolation: Kriging and the Fukushima Data. Erik Hoel Colligium Ramazzini October 30, 2011
 Geostatistical Interpolation: Kriging and the Fukushima Data Erik Hoel Colligium Ramazzini October 30, 2011 Agenda Basics of geostatistical interpolation Fukushima radiation Database Web site Geoanalytic
A MultiGaussian Approach to Assess Block Grade Uncertainty
 A MultiGaussian Approach to Assess Block Grade Uncertainty Julián M. Ortiz 1, Oy Leuangthong 2, and Clayton V. Deutsch 2 1 Department of Mining Engineering, University of Chile 2 Department of Civil &
Hamid Mohebzadeh. Department of Water Engineering, Faculty of Agriculture, Bu-Ali Sina University, Hamedan, Iran
 American-Eurasian J. Agric. & Environ. Sci., 8 (): 64-76, 08 ISSN 88-6769 IDOSI Publications, 08 DOI: 0.589/idosi.aejaes.08.64.76 Comparison of Methods for Fitting the Theoretical Variogram to the Experimental
An Introduction to Spatial Autocorrelation and Kriging
 An Introduction to Spatial Autocorrelation and Kriging Matt Robinson and Sebastian Dietrich RenR 690 Spring 2016 Tobler and Spatial Relationships Tobler s 1 st Law of Geography: Everything is related to
Spatial analysis. 0 move the objects and the results change
 0 Outline: Roadmap 0 What is spatial analysis? 0 Transformations 0 Introduction to spatial interpolation 0 Classification of spatial interpolation methods 0 Interpolation methods 0 Areal interpolation
I don t have much to say here: data are often sampled this way but we more typically model them in continuous space, or on a graph
 Spatial analysis Huge topic! Key references Diggle (point patterns); Cressie (everything); Diggle and Ribeiro (geostatistics); Dormann et al (GLMMs for species presence/abundance); Haining; (Pinheiro and
Basics in Geostatistics 2 Geostatistical interpolation/estimation: Kriging methods. Hans Wackernagel. MINES ParisTech.
 Basics in Geostatistics 2 Geostatistical interpolation/estimation: Kriging methods Hans Wackernagel MINES ParisTech NERSC April 2013 http://hans.wackernagel.free.fr Basic concepts Geostatistics Hans Wackernagel
Types of Spatial Data
 Spatial Data Types of Spatial Data Point pattern Point referenced geostatistical Block referenced Raster / lattice / grid Vector / polygon Point Pattern Data Interested in the location of points, not their
On dealing with spatially correlated residuals in remote sensing and GIS
 On dealing with spatially correlated residuals in remote sensing and GIS Nicholas A. S. Hamm 1, Peter M. Atkinson and Edward J. Milton 3 School of Geography University of Southampton Southampton SO17 3AT
GEOSTATISTICAL ANALYSIS FOR SPATIAL EVALUATION OF LIQUEFACTION POTENTIAL IN SAITAMA CITY
 Technical Note LOWLAND TECHNOLOGY INTERNATIONAL Vol. 14, No. 1, 45-51, June 2012 International Association of Lowland Technology (IALT), ISSN 1344-9656 GEOSTATISTICAL ANALYSIS FOR SPATIAL EVALUATION OF
The Proportional Effect of Spatial Variables
 The Proportional Effect of Spatial Variables J. G. Manchuk, O. Leuangthong and C. V. Deutsch Centre for Computational Geostatistics, Department of Civil and Environmental Engineering University of Alberta
A robust statistically based approach to estimating the probability of contamination occurring between sampling locations
 A robust statistically based approach to estimating the probability of contamination occurring between sampling locations Peter Beck Principal Environmental Scientist Image placeholder Image placeholder
Comparison of rainfall distribution method
 Team 6 Comparison of rainfall distribution method In this section different methods of rainfall distribution are compared. METEO-France is the French meteorological agency, a public administrative institution
GIS and Spatial Analysis
 GEOG 579: GIS and Spatial Analysis Fall 2007 Page: 1/6 Instructor: Professor A-Xing Zhu Department of Geography Rm 255 Science Hall Email: azhu@wisc.edu Tel: 262-0272 Geography 579 GIS and Spatial Analysis
Is there still room for new developments in geostatistics?
 Is there still room for new developments in geostatistics? Jean-Paul Chilès MINES ParisTech, Fontainebleau, France, IAMG 34th IGC, Brisbane, 8 August 2012 Matheron: books and monographs 1962-1963: Treatise
Kriging Luc Anselin, All Rights Reserved
 Kriging Luc Anselin Spatial Analysis Laboratory Dept. Agricultural and Consumer Economics University of Illinois, Urbana-Champaign http://sal.agecon.uiuc.edu Outline Principles Kriging Models Spatial Interpolation
Improving Spatial Data Interoperability
 Improving Spatial Data Interoperability A Framework for Geostatistical Support-To To-Support Interpolation Michael F. Goodchild, Phaedon C. Kyriakidis, Philipp Schneider, Matt Rice, Qingfeng Guan, Jordan
Traps for the Unwary Subsurface Geoscientist
 Traps for the Unwary Subsurface Geoscientist ashley.francis@sorviodvnvm.co.uk http://www.sorviodvnvm.co.uk Presented at SEG Development & Production Forum, 24-29 th June 2001, Taos, New Mexico, USA 24-29
A kernel indicator variogram and its application to groundwater pollution
 Int. Statistical Inst.: Proc. 58th World Statistical Congress, 2011, Dublin (Session IPS101) p.1514 A kernel indicator variogram and its application to groundwater pollution data Menezes, Raquel University
Highly Robust Variogram Estimation 1. Marc G. Genton 2
 Mathematical Geology, Vol. 30, No. 2, 1998 Highly Robust Variogram Estimation 1 Marc G. Genton 2 The classical variogram estimator proposed by Matheron is not robust against outliers in the data, nor is
COMPARISON OF DIGITAL ELEVATION MODELLING METHODS FOR URBAN ENVIRONMENT
 COMPARISON OF DIGITAL ELEVATION MODELLING METHODS FOR URBAN ENVIRONMENT Cahyono Susetyo Department of Urban and Regional Planning, Institut Teknologi Sepuluh Nopember, Indonesia Gedung PWK, Kampus ITS,
Practical application of drill hole spacing analysis in coal resource estimation
 Practical application of drill hole spacing analysis in coal resource estimation C.M.Williams 1, K.Henderson 2 and S.Summers 2 1. HDR mining consultants, Level 23, 12 Creek Street, Brisbane, Qld, 4000
Geog 210C Spring 2011 Lab 6. Geostatistics in ArcMap
 Geog 210C Spring 2011 Lab 6. Geostatistics in ArcMap Overview In this lab you will think critically about the functionality of spatial interpolation, improve your kriging skills, and learn how to use several
Geostatistical Approach for Spatial Interpolation of Meteorological Data
 Anais da Academia Brasileira de Ciências (2016) 88(4): 2121-2136 (Annals of the Brazilian Academy of Sciences) Printed version ISSN 0001-3765 / Online version ISSN 1678-2690 http://dx.doi.org/10.1590/0001-3765201620150103
USING A GEOGRAPHIC INFORMATION SYSTEM AND GEOSTATISTICS TO ESTIMATE SITE INDEX OF PINUS RADIATA FOR KAINGAROA FOREST, NEW ZEALAND
 USING A GEOGRAPHIC INFORMATION SYSTEM AND GEOSTATISTICS TO ESTIMATE SITE INDEX OF PINUS RADIATA FOR KAINGAROA FOREST, NEW ZEALAND B. K. HOCK, T. W. PAYN, New Zealand Forest Research Institute, Private
An Introduction to Spatial Statistics. Chunfeng Huang Department of Statistics, Indiana University
 An Introduction to Spatial Statistics Chunfeng Huang Department of Statistics, Indiana University Microwave Sounding Unit (MSU) Anomalies (Monthly): 1979-2006. Iron Ore (Cressie, 1986) Raw percent data
Another Look at Non-Euclidean Variography
 Another Look at Non-Euclidean Variography G. Dubois European Commission DG Joint Research Centre Institute for Environment and Sustainability, Ispra, Italy. Email: gregoire.dubois@jrc.it ABSTRACT: Tobler
Geostatistical Analyst for Deciding Optimal Interpolation Strategies for Delineating Compact Zones
 International Journal of Geosciences, 2011, 2, 585-596 doi:10.4236/ijg.2011.24061 Published Online November 2011 (http://www.scirp.org/journal/ijg) 585 Geostatistical Analyst for Deciding Optimal Interpolation
GEOSTATISTICS. Dr. Spyros Fountas
 GEOSTATISTICS Dr. Spyros Fountas Northing (m) 140550 140450 140350 Trent field Disturbed area Andover 140250 Panholes 436950 437050 437150 437250 437350 Easting (m) Trent Field Westover Farm (Blackmore,
Optimizing Sampling Schemes for Mapping and Dredging Polluted Sediment Layers
 This file was created by scanning the printed publication. Errors identified by the software have been corrected; however, some errors may remain. Optimizing Sampling Schemes for Mapping and Dredging Polluted
ASPECTS REGARDING THE USEFULNESS OF GEOGRAPHICALLY WEIGHTED REGRESSION (GWR) FOR DIGITAL MAPPING OF SOIL PARAMETERS
 FOR DIGITAL MAPPING OF SOIL PARAMETERS") Lucrări Ştiinţifice vol. 52, seria Agronomie ASPECTS REGARDING THE USEFULNESS OF GEOGRAPHICALLY WEIGHTED REGRESSION (GWR) FOR DIGITAL MAPPING OF SOIL PARAMETERS C. PATRICHE 1, I. VASILINIUC 2 1 Romanian
Lucrări Ştiinţifice vol. 52, seria Agronomie ASPECTS REGARDING THE USEFULNESS OF GEOGRAPHICALLY WEIGHTED REGRESSION (GWR) FOR DIGITAL MAPPING OF SOIL PARAMETERS C. PATRICHE 1, I. VASILINIUC 2 1 Romanian
Geostatistics in Hydrology: Kriging interpolation
 Chapter Geostatistics in Hydrology: Kriging interpolation Hydrologic properties, such as rainfall, aquifer characteristics (porosity, hydraulic conductivity, transmissivity, storage coefficient, etc.),
Lab #3 Background Material Quantifying Point and Gradient Patterns
 Lab #3 Background Material Quantifying Point and Gradient Patterns Dispersion metrics Dispersion indices that measure the degree of non-randomness Plot-based metrics Distance-based metrics First-order
Erik W. Gjesfjeld UNIVERSITY COLLEGE LONDON INSTITUTE OF ARCHAEOLOGY
 Spatial Prediction and Contract Archaeology: The Benefits of Geostatistics Erik W. Gjesfjeld Dissertation submitted in partial fulfillment of the requirements for the degree of MA in Field and Analytical
Spatial analysis. Spatial descriptive analysis. Spatial inferential analysis:
 Spatial analysis Spatial descriptive analysis Point pattern analysis (minimum bounding box, mean center, weighted mean center, standard distance, nearest neighbor analysis) Spatial clustering analysis
Interpolating Raster Surfaces
 Interpolating Raster Surfaces You can use interpolation to model the surface of a feature or a phenomenon all you need are sample points, an interpolation method, and an understanding of the feature or
Spatial Backfitting of Roller Measurement Values from a Florida Test Bed
 Spatial Backfitting of Roller Measurement Values from a Florida Test Bed Daniel K. Heersink 1, Reinhard Furrer 1, and Mike A. Mooney 2 1 Institute of Mathematics, University of Zurich, CH-8057 Zurich 2
A C O M P AR I S O N O F O R D I N AR Y AN D S I M P L E L I M B O F T H E B U S H V E L D C O M P L E X
 A C O M P AR I S O N O F O R D I N AR Y AN D S I M P L E K R I G I N G O N A P G E R E S O U R C E I N T H E E AS T E R N L I M B O F T H E B U S H V E L D C O M P L E X Mbalenhle Mpanza A research report
Transiogram: A spatial relationship measure for categorical data
 International Journal of Geographical Information Science Vol. 20, No. 6, July 2006, 693 699 Technical Note Transiogram: A spatial relationship measure for categorical data WEIDONG LI* Department of Geography,
Extensibility of Measurement Results of Point Samples of the Soil Protection Information and Monitoring System by different methods
 Extensibility of Measurement Results of Point Samples of the Soil Protection Information and Monitoring System by different methods L. Várallyai a, B. Kovács b, and J. Prokisch b a University of Debrecen,
Data Break 8: Kriging the Meuse RiverBIOS 737 Spring 2004 p.1/27
 Data Break 8: Kriging the Meuse River BIOS 737 Spring 2004 Data Break 8: Kriging the Meuse RiverBIOS 737 Spring 2004 p.1/27 Meuse River: Reminder library(gstat) Data included in gstat library. data(meuse)
Application and evaluation of universal kriging for optimal contouring of groundwater levels
 Application and evaluation of universal kriging for optimal contouring of groundwater levels B V N P Kambhammettu 1,, Praveena Allena 2, and JamesPKing 1, 1 Civil Engineering Department, New Mexico State
Basics of Point-Referenced Data Models
 Basics of Point-Referenced Data Models Basic tool is a spatial process, {Y (s), s D}, where D R r Chapter 2: Basics of Point-Referenced Data Models p. 1/45 Basics of Point-Referenced Data Models Basic
Optimal Interpolation
 Optimal Interpolation Optimal Interpolation and/or kriging consist in determining the BEST LINEAR ESTIMATE in the least square sense for locations xi where you have no measurements: Example 1: Collected
Acceptable Ergodic Fluctuations and Simulation of Skewed Distributions
 Acceptable Ergodic Fluctuations and Simulation of Skewed Distributions Oy Leuangthong, Jason McLennan and Clayton V. Deutsch Centre for Computational Geostatistics Department of Civil & Environmental Engineering
Abstractt parameters interpolation method etc. Tessellation which is
 Important considerations on thee application of IDW interpolation method Younes Fadakarr Alghalandis ١, Peyman Afzal ٢ yfa.study@ymail.com Abstractt The utilization of the Inverse Distance Weighting (IDW)
Mapping Precipitation in Switzerland with Ordinary and Indicator Kriging
 Journal of Geographic Information and Decision Analysis, vol. 2, no. 2, pp. 65-76, 1998 Mapping Precipitation in Switzerland with Ordinary and Indicator Kriging Peter M. Atkinson Department of Geography,
Chapter 1. Summer School GEOSTAT 2014, Spatio-Temporal Geostatistics,
 Chapter 1 Summer School GEOSTAT 2014, Geostatistics, 2014-06-19 sum- http://ifgi.de/graeler Institute for Geoinformatics University of Muenster 1.1 Spatial Data From a purely statistical perspective, spatial
GIST 4302/5302: Spatial Analysis and Modeling
 GIST 4302/5302: Spatial Analysis and Modeling Review Guofeng Cao www.gis.ttu.edu/starlab Department of Geosciences Texas Tech University guofeng.cao@ttu.edu Spring 2016 Course Outlines Spatial Point Pattern
SPATIAL ELECTRICAL LOADS MODELING USING THE GEOSTATISTICAL METHODS
 19 th International CODATA Conference THE INFORMATION SOCIETY: NEW HORIZONS FOR SCIENCE Berlin, Germany 7-1 November 24 SPATIAL ELECTRICAL LOADS MODELING USING THE GEOSTATISTICAL METHODS Barbara Namysłowska-Wilczyńska
adaptive prior information and Bayesian Partition Modelling.
 Beyond kriging - Dealing with discontinuous spatial data fields using adaptive prior information and Bayesian Partition Modelling. John Stephenson 1 (john.stephenson@imperial.ac.uk), K. Gallagher 1 and
ROeS Seminar, November
 IASC Introduction: Spatial Interpolation Estimation at a certain location Geostatistische Modelle für Fließgewässer e.g. Air pollutant concentrations were measured at different locations. What is the concentration
Geostatistical Determination of Production Uncertainty: Application to Firebag Project
 Geostatistical Determination of Production Uncertainty: Application to Firebag Project Abstract C. V. Deutsch, University of Alberta (cdeutsch@civil.ualberta.ca) E. Dembicki and K.C. Yeung, Suncor Energy
Porosity prediction using cokriging with multiple secondary datasets
 Cokriging with Multiple Attributes Porosity prediction using cokriging with multiple secondary datasets Hong Xu, Jian Sun, Brian Russell, Kris Innanen ABSTRACT The prediction of porosity is essential for
Spatial data representation: an improvement of statistical dissemination for policy analysis
 Spatial data representation: an improvement of statistical dissemination for policy analysis Edoardo Pizzoli 1, Chiara Piccini 2 1 Istat, Istituto Nazionale di Statistica, e-mail: pizzoli@istat.it 2 Freelance
Statistícal Methods for Spatial Data Analysis
 Texts in Statistícal Science Statistícal Methods for Spatial Data Analysis V- Oliver Schabenberger Carol A. Gotway PCT CHAPMAN & K Contents Preface xv 1 Introduction 1 1.1 The Need for Spatial Analysis
GEOSPATIAL TECHNOLOGY FOR GROUND WATER QUALITY PARAMETERS ASSESSMENT IN AL-KIFL DISTRICT- BABYLON -IRAQ
 International Journal of Civil Engineering and Technology (IJCIET) Volume 9, Issue 8, August 2018, pp. 952-963, Article ID: IJCIET_09_08_096 Available online at http://www.iaeme.com/ijciet/issues.asp?jtype=ijciet&vtype=9&itype=8
Interpolation {x,y} Data with Suavity. Peter K. Ott Forest Analysis & Inventory Branch BC Ministry of FLNRO Victoria, BC
 Interpolation {x,y} Data with Suavity Peter K. Ott Forest Analysis & Inventory Branch BC Ministry of FLNRO Victoria, BC Peter.Ott@gov.bc.ca 1 The Goal Given a set of points: x i, y i, i = 1,2,, n find
Conditional Distribution Fitting of High Dimensional Stationary Data
 Conditional Distribution Fitting of High Dimensional Stationary Data Miguel Cuba and Oy Leuangthong The second order stationary assumption implies the spatial variability defined by the variogram is constant
SPATIAL-TEMPORAL TECHNIQUES FOR PREDICTION AND COMPRESSION OF SOIL FERTILITY DATA
 SPATIAL-TEMPORAL TECHNIQUES FOR PREDICTION AND COMPRESSION OF SOIL FERTILITY DATA D. Pokrajac Center for Information Science and Technology Temple University Philadelphia, Pennsylvania A. Lazarevic Computer
Determining a Useful Interpolation Method for Surficial Sediments in the Gulf of Maine Ian Cochran
 Determining a Useful Interpolation Method for Surficial Sediments in the Gulf of Maine Ian Cochran ABSTRACT This study was conducted to determine if an interpolation of surficial sediments in the Gulf
Geostatistics for Seismic Data Integration in Earth Models
 2003 Distinguished Instructor Short Course Distinguished Instructor Series, No. 6 sponsored by the Society of Exploration Geophysicists European Association of Geoscientists & Engineers SUB Gottingen 7
Luc Anselin Spatial Analysis Laboratory Dept. Agricultural and Consumer Economics University of Illinois, Urbana-Champaign
 GIS and Spatial Analysis Luc Anselin Spatial Analysis Laboratory Dept. Agricultural and Consumer Economics University of Illinois, Urbana-Champaign http://sal.agecon.uiuc.edu Outline GIS and Spatial Analysis
GEOSTATISTICAL ANALYSIS OF SPATIAL DATA. Goovaerts, P. Biomedware, Inc. and PGeostat, LLC, Ann Arbor, Michigan, USA
 GEOSTATISTICAL ANALYSIS OF SPATIAL DATA Goovaerts, P. Biomedware, Inc. and PGeostat, LLC, Ann Arbor, Michigan, USA Keywords: Semivariogram, kriging, spatial patterns, simulation, risk assessment Contents
Introduction to Spatial Data and Models
 Introduction to Spatial Data and Models Sudipto Banerjee 1 and Andrew O. Finley 2 1 Biostatistics, School of Public Health, University of Minnesota, Minneapolis, Minnesota, U.S.A. 2 Department of Forestry
Spatial and Temporal Variability of Soil Moisture
 International Journal of Geosciences, 1, 1, 7-9 doi:1./ijg.1.11 Published Online August 1 (http://www.scirp.org/journal/ijg) Spatial and Temporal Variability of Soil Moisture Abstract Vanita Pandey 1,
Nonstationary models for exploring and mapping monthly precipitation in the United Kingdom
 INTERNATIONAL JOURNAL OF CLIMATOLOGY Int. J. Climatol. 3: 39 45 (21) Published online 16 March 29 in Wiley InterScience (www.interscience.wiley.com) DOI: 1.12/joc.1892 Nonstationary models for exploring
AN OPERATIONAL DROUGHT MONITORING SYSTEM USING SPATIAL INTERPOLATION METHODS FOR PINIOS RIVER BASIN, GREECE
 Proceedings of the 13 th International Conference on Environmental Science and Technology Athens, Greece, 5-7 September 2013 AN OPERATIONAL DROUGHT MONITORING SYSTEM USING SPATIAL INTERPOLATION METHODS
Modeling of Anticipated Subsidence due to Gas Extraction Using Kriging on Sparse Data Sets
 Modeling of Anticipated Subsidence due to Gas Extraction Using Kriging on Sparse Data Sets Matthew TAIT and Andrew HUNTER, Canada Key words: Kriging, Trend Surfaces, Sparse networks, Subsidence monitoring
Correcting Variogram Reproduction of P-Field Simulation
 Correcting Variogram Reproduction of P-Field Simulation Julián M. Ortiz (jmo1@ualberta.ca) Department of Civil & Environmental Engineering University of Alberta Abstract Probability field simulation is
Introduction to Spatial Data and Models
 Introduction to Spatial Data and Models Sudipto Banerjee 1 and Andrew O. Finley 2 1 Department of Forestry & Department of Geography, Michigan State University, Lansing Michigan, U.S.A. 2 Biostatistics,
Introduction to applied geostatistics. Short version. Overheads
 Introduction to applied geostatistics Short version Overheads Department of Earth Systems Analysis International Institute for Geo-information Science & Earth Observation (ITC)
Spatial Statistics For Real Estate Data 1
 1 Key words: spatial heterogeneity, spatial autocorrelation, spatial statistics, geostatistics, Geographical Information System SUMMARY: The paper presents spatial statistics tools in application to real
Mapping the Spatial Variability of Groundwater Quality in Urmia, Iran
 Mapping the Spatial Variability of Groundwater Quality in Urmia, Iran R. Taghizadeh-Mehrjardi Faculty of Agriculture and Natural Resources, University of Ardakan, PO BOX: 89515-147, Yazd, Iran Received
Spatial analysis is the quantitative study of phenomena that are located in space.
 c HYON-JUNG KIM, 2016 1 Introduction Spatial analysis is the quantitative study of phenomena that are located in space. Spatial data analysis usually refers to an analysis of the observations in which