April 18, Accessibility and Smart Scale: Using Access Scores to Prioritize Projects
|
|
|
- Geoffrey Caldwell
- 6 years ago
- Views:
Transcription


1 Accessibility and Smart Scale: Using Access Scores to Prioritize Projects April 18, 2017 Accessibility and Smart Scale: Using Access Scores to Prioritize Projects

2 State Smart Transportation Initiative Practical Solutions to Move America Forward A network of reform-oriented state DOTs, founded in 2010 and housed at the University of Wisconsin. Executive-level Community of Practice Technical assistance Resource for the transportation community April 18, 2017 Accessibility: Towards a new multimodal system performance metric 2
3 Today s Speaker Chad Tucker Assistant Administrator Division of Transportation & Mobility Planning Virginia DOT Dan Hardy, P.E., PTP Principal Renaissance Planning Matthew Pettit Product Applications Engineer Citilabs April 18, 2017 Accessibility and Smart Scale: Using Access Scores to Prioritize Projects 3

4 SMART SCALE Virginia s Prioritization Process Measuring Accessibility Chad Tucker, Virginia Department of Transportation April 18, 2017
5 Building the Foundation for SMART SCALE
6 Virginia s Statewide Prioritization Process Legislation championed by Democratic Governor and the Republican Speaker of the House 2014 Virginia General Assembly :5 of the Code of Virginia Requires Commonwealth Transportation Board (CTB) use objective and quantifiable process for the allocation of construction funds Board allocates construction funds for the Commonwealth Programming of funds for capacity enhancing projects Intent for the CTB to select the highest ranking projects however, they maintain the authority to propose adjustments to the rankings. Policy developed over a 16 month period and adopted by Commonwealth Transportation Board in June extensive stakeholder outreach 6
7 Three Key Goals Established goals for successful implementation: Performance outcomes guide project selection Provide stability to the Six-Year Improvement Program Establish project pipeline that links planning to programming Board direction: Simple and straightforward Does not require applicants to invest significant time and resources or require the use of consultants VDOT and DRPT staff will be available to provide support and tools for applicants in compiling data and information needed for application Electronic and map-based application process to manager funding requests and to facilitate automated population of key data elements 7
8 Guiding Principles for Measures Analyze what matters to people and has a meaningful impact Ensure fair and accurate benefits to cost analysis Transparent and understandable Must work for both urban and rural areas Must work for all modes of transportation Minimize overlap in measures 8
9 Benefits of Smart Scale The team successfully developed and implemented what is likely the most transformative transportation legislation in Virginia the last 30 years. Improved transparency Enhanced accountability Better certainty for project sponsors and business community Project design focused on achieving most benefits for the least cost Provides political cover to allow planning and programming to proceed without intervention 9
10 SMART Scale Measures and Scoring 10
11 Factor Areas Goals that guided measure development Safety reduce the number and rate of fatalities and severe injuries Congestion reduce person hours of delay and increase person throughput Accessibility increase access to jobs and travel options Economic Development support economic development and improve goods movement Environmental Quality improve air quality and avoid impacts to the natural environment Land Use support transportation efficient land development patterns 11
12 SMART Scale Factors and Measures Safety Congestion Mitigation Accessibility Reduction in number of Fatal and Injury Crashes (50%) Reduction in rate of Fatal and Injury Crashes (50%) Increase in Person Throughput (50%) Decrease in Person Hours of Delay (50%) Increase in access to Jobs (60%) Increase in access to Jobs for Disadvantaged Persons (20%) Increase in access to Multimodal Choices (20%) Environmental Quality Economic Development Air Quality and Energy Benefit (50%) Impact to Natural and Cultural Resources (50%) Project Support for Economic Development Sites (60%) Improvement in Intermodal Access and Efficiency (20%) Improvement in Travel Time Reliability (20%) Land Use Transportation-Efficient Land Use (100%) 12


13 How Scoring Works Everything is Relative 13 13

14 Everything is Relative Highest Value Dictates Scores Change here only affects one score Change here affects all scores The best project for that measure dictates the score for all other projects 14 14

15 Area Type Weighting Factor Congestion Mitigation Economic Development Accessibility Safety Environmental Quality Land Use Category A 45% 5% 15% 5% 10% 20% Category B 15% 20% 25% 20% 10% 10% Category C 15% 25% 25% 25% 10% Category D 10% 35% 15% 30% 10% 15

16 Sample Project Scoring 16

17 Chad Tucker Virginia Department of Transportation Transportation and Mobility Planning Division 1401 East Broad Street, Richmond, VA O:

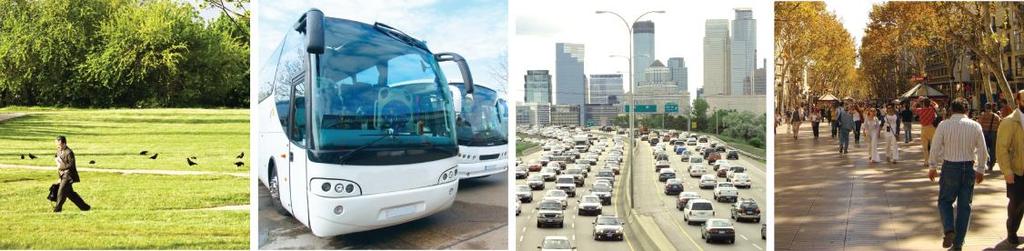
18 SMART SCALE ACCESSIBILITY APPROACH APRIL 18, 2017

19 DISCUSSION TOPICS Smart Scale technical approach to accessibility Considering multimodal approaches Key findings and future opportunities 19
20 ACCESSIBILITY APPROACH The number of jobs reachable within a given travel time on a given network, where: JOBS = Number of Jobs reachable from each Census Block (transit, peds) or Block Group (auto) TRAVEL TIME = within 45 (auto) or 60 (transit) minutes over an actual network (using peak period speeds for each mode) DECAY = Factor reflecting decrease in value of opportunities that are farther away (based on traveler surveys) 20
 and used population projections to project 2025 jobs NETWORK: AUTO: HERE (Navteq) network WALK: HERE network modified with available")
 VDOT Congestion Factor analysis for Build speeds GTFS data for transit (+ walk access to transit) DECAY: based on traveler")
21 Data Sources for Accessibility JOBS: (2025 employment by CBG): TAZ level data for MPO areas In Non MPO areas, started with Info USA data (2013) and used population projections to project 2025 jobs NETWORK: AUTO: HERE (Navteq) network WALK: HERE network modified with available data and comfort index TRANSIT: GTFS where available + digitized service data from service providers TRAVEL TIME: HERE data for No Build speeds (AM Peak) VDOT Congestion Factor analysis for Build speeds GTFS data for transit (+ walk access to transit) DECAY: based on traveler surveys 21
22 No-Build Accessibility - How Access to Jobs Tool analyzes existing accessibility to jobs
23 No-Build Accessibility - How Access to Jobs Tool moves to next block, assessing existing accessibility
24 No-Build Accessibility - How Access to Jobs Process is repeated for all block groups to establish existing accessibility to jobs
25 Build Accessibility - How Access to Jobs Tool then analyzes change in access to jobs based on proposed improvement
26 Build Accessibility - How Access to Jobs Tool moves to next block group, calculating change in job access
27 Build Accessibility - How Access to Jobs Process is repeated for all block groups increase in access for each block group is summed and used to score projects
 Walk Accessibility Map (Access to jobs in 45 minutes from each Census Block")
28 CONCEPTS ORIGINATED IN VTRANS PLANNING EFFORTS Auto Accessibility Map (Access to jobs in 45 minutes from each Census Block Group) Richmond Region Transit Accessibility Map (Access to jobs in 45 minutes from each Census Block Group) Walk Accessibility Map (Access to jobs in 45 minutes from each Census Block Group) 28

29 ROLE OF DISTANCE DECAY Accessibility to Jobs Without Distance Decay Accessibility to Jobs With Distance Decay Hampton Roads Region 29


30 CATCHMENT AREA CONCEPT Catchment area helps normalize for region size and boundaries Weighted average improvement addresses block size variability Smaller region Larger region 30
")
31 CONSIDERATION OF DECAY CURVES Separate auto decay curve for northern Virginia (DC region) 31


32 EXAMPLE OF ACCESSIBILITY INCREASE Fairfax County Parkway & Popes Head Road Interchange 32
33 Increase in jobs accessible SMART SCALE LINKING ACCESSIBILITY TO DELAY PER-CAPITA CHECK Useful check on time savings per vehicle versus access Size of circle is catchment area pop+jobs Patterns generally sensible (although circles along y-axis are from Batch 4 model data where time saved not readily attached to a link ) Results also affected by location in region: large circles at ~{500,150} reflect projects at regional edges high speed increase but far from centrality of jobs 3,000 2,500 2,000 1,500 1, Smart Scale Projects ,000 1,500 2, Time saved by project (seconds) 33
34 Big picture ideas from Smart Scale scoring TOTAL DELAY COMPARED WITH PER-CAPITA ACCESSIBILITY Check on total delay versus access Patterns generally sensible delay score incorporates volume, accessibility score is still per-capita High congestion mitigation with low accessibility include same regional edge projects. 34
35 CONSIDERING NON-MOTORIZED ACCESSIBILITY REFLECTING QUALITY OF SERVICE Use a factored pedestrian speed as surrogate for Quality of Service (QOS) Literature indicates pedestrians more likely to walk (and walk farther) where higher quality sidewalks exist 35
36 CONSIDERING NON-MOTORIZED ACCESSIBILITY QOS linked to roadway classification, number of lanes, and posted speed. Systematic improvements based on lookup matrix approach Additional speed benefits for meaningful improvements (predefined list) With Sidewalk 6+ Lanes 4 Lanes 2 Lanes Speed Speed Speed Functional Class > <=30 > <=30 > <=30 1,2 Freeway/Major Highway 3 Major arterial 4 Minor arterial/collector 5 Local Without Sidewalk (or no sidewalk data available) 6+ Lanes 4 Lanes 2 Lanes Speed Speed Speed Functional Class > <=30 > <=30 > <=30 1,2 Freeway/Major Highway 3 Major arterial 4 Minor arterial/collector 5 Local Key Prohibited 0.0 MPH (not shown above - separate field identifies whether pedestrians prohibited or not) Available 1.5 MPH Low 2.4 MPH Medium 2.7 MPH High 3.0 MPH 36


37 CONSIDERING NON-MOTORIZED ACCESSIBILITY Network approach applies to pedestrians also City of Hopewell 37

38 CONSIDERING FUTURE IMPROVEMENTS Literature review (and NHTS validation) Hatchet vs. scalpel Auto/transit/ped scoring approaches Network Strategic Plan Next generation Bike LTS Blending transit IVT/OVT 38 Example of auto project informing Network Strategic Plan

39 IMPEDANCE Perceived time Out of pocket costs Perceived costs Perceived comfort Meta analyses say these are important elements of travel behavior. How should they be reflected? 39

40 FINER NETWORK GRANULARITY Terminal time for all modes Static details (i.e., GTFS versus confidence in 13% of sidewalk inventory) Operational details Promise of big data 40

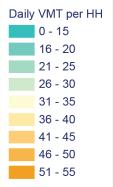

41 RELATED METRICS Accessibility can help predict VMT, mode share 41

42 RESOURCES 42

43 SCORING 400+ PROJECTS IN 1 MONTH 43


44 Building Data for Virginia Statewide Network (45 mile buffer) 30+ Regional Networks (Transit and Roadway) 44

45 Building Data for Virginia Custom ArcGIS Web App to find correct dataset


46 Leveraging Virginia s Local Data Why measure accessibility of today s population and employment when project won t be built till tomorrow? Virginia
47 Multi-Mode Accessibility Analysis Smart Scale requires Auto, Transit, and Walk analysis Streamline analysis within Sugar 47


48 Multi-Mode Accessibility Analysis Smart Scale requires Auto, Transit, and Walk analysis Streamline analysis within Sugar Accessibility Scores for every travel mode 48


49 Leveraging Cloud Processing AWS Super Machines 400+ Projects 49
50 Enabling Custom Decay Curves Allowing customization with usability 50


51 Enabling Custom Decay Curves Allowing customization with usability Local Geographies Auto HBW Nova Auto HBW Statewide

52 Enabling Custom Decay Curves Allowing customization with usability Local Geographies Trip Purpose Auto HBO Auto HBW

53 Enabling Flexible Project Analysis Link ID Speed From Speed To Walk LOS From Walk LOS To Projects can be coded through update tables Roadway Travel Times Walk Level of Service 53
54 Enabling Flexible Project Analysis Projects can be coded through intuitive network editing Transit Lines Pedestrian Paths Roadways AM Peak Headway PM Peak Headway Off Peak Headway Run Time Dwell Time

55 Enabling Flexible Project Analysis Projects can be coded through intuitive network editing Transit Lines Pedestrian Paths Roadways AM Peak Headway PM Peak Headway Off Peak Headway Run Time Dwell Time Matthew Pettit, Citilabs
56 THANK YOU! A recording of this webinar will be on the SSTI web site tomorrow. To find out about future SSTI webinars, subscribe to our newsletter and follow us on Twitter. Accessibility and Smart Scale: Using Access Scores to Prioritize Projects April 18, 2017 Accessibility and Smart Scale: Using Access Scores to Prioritize Projects
ACCESSIBILITY OF INTERMODAL CENTERS STUDY
 ACCESSIBILITY OF INTERMODAL CENTERS STUDY Presentation for VDOT Forum - Coordinating Transportation Planning and Land Use Wednesday, April 2, 2014 Vlad Gavrilovic, AICP - Renaissance Planning Group Tasks
SUGAR ACCESS USER GUIDE
 SUGAR ACCESS USER GUIDE Contents WHAT WOULD YOU LIKE TO DO?... 3 WHAT IS SUGAR ACCESS?... 4 Sugar Launch Pad... 4 Sugar Network Editor... 4 INSTALLATION AND SETUP... 5 RUNNING YOUR FIRST ACCESSIBILITY
HORIZON 2030: Land Use & Transportation November 2005
 PROJECTS Land Use An important component of the Horizon transportation planning process involved reviewing the area s comprehensive land use plans to ensure consistency between them and the longrange transportation
Accessibility in practice. A guide for transportation and land use decision making
 Accessibility in practice A guide for transportation and land use decision making October 2017 Credits Primary authors: Eric Sundquist, PhD, erics@ssti.us, and Chris McCahill, PhD, mccahill@ssti.us, with
StanCOG Transportation Model Program. General Summary
 StanCOG Transportation Model Program Adopted By the StanCOG Policy Board March 17, 2010 What are Transportation Models? General Summary Transportation Models are technical planning and decision support
Regional Performance Measures
 G Performance Measures Regional Performance Measures Introduction This appendix highlights the performance of the MTP/SCS for 2035. The performance of the Revenue Constrained network also is compared to
ADDRESSING TITLE VI AND ENVIRONMENTAL JUSTICE IN LONG-RANGE TRANSPORTATION PLANS
 ADDRESSING TITLE VI AND ENVIRONMENTAL JUSTICE IN LONG-RANGE TRANSPORTATION PLANS Activities from the National Capital Region Transportation Planning Board Sergio Ritacco Transportation Planner 2017 Association
Regional Performance Measures
 G Performance Measures Regional Performance Measures Introduction This appendix highlights the performance of the MTP/SCS for 2035. The performance of the Revenue Constrained network also is compared to
FHWA GIS Outreach Activities. Loveland, Colorado April 17, 2012
 FHWA GIS Outreach Activities Loveland, Colorado April 17, 2012 GIS for Improved Decision Making FHWA believes that geographic information systems and other geospatial technologies (remote sensing and GPS)
Cipra D. Revised Submittal 1
 Cipra D. Revised Submittal 1 Enhancing MPO Travel Models with Statewide Model Inputs: An Application from Wisconsin David Cipra, PhD * Wisconsin Department of Transportation PO Box 7913 Madison, Wisconsin
Expanding the GSATS Model Area into
 Appendix A Expanding the GSATS Model Area into North Carolina Jluy, 2011 Table of Contents LONG-RANGE TRANSPORTATION PLAN UPDATE 1. Introduction... 1 1.1 Background... 1 1.2 Existing Northern Extent of
Modeling Mode in a Statewide Context
 Modeling Mode in a Statewide Context CDM Smith ADOT Transportation Planning Applications Conference May 6, 2013 Presentation Overview Development Team AZTDM3 Overview AZTDM3 Modes of Travel Transit Abstraction
Taming the Modeling Monster
 Taming the Modeling Monster Starring: Ellen Greenberg Scott McCarey Jim Charlier Audience Poll, part 1 Elected Officials Board Members Public Staff Consultants Journalists Other Audience Poll, part 2 Modeling
Accessibility as an Instrument in Planning Practice. Derek Halden DHC 2 Dean Path, Edinburgh EH4 3BA
 Accessibility as an Instrument in Planning Practice Derek Halden DHC 2 Dean Path, Edinburgh EH4 3BA derek.halden@dhc1.co.uk www.dhc1.co.uk Theory to practice a starting point Shared goals for access to
BROOKINGS May
 Appendix 1. Technical Methodology This study combines detailed data on transit systems, demographics, and employment to determine the accessibility of jobs via transit within and across the country s 100
Weather Information for Surface Transportation (WIST): Update on Weather Impacts and WIST Progress
: Update on Weather Impacts and WIST Progress") Weather Information for Surface Transportation (WIST): Update on Weather Impacts and WIST Progress Samuel P. Williamson Office of the Federal Coordinator for Meteorological Services and Supporting Research
Weather Information for Surface Transportation (WIST): Update on Weather Impacts and WIST Progress Samuel P. Williamson Office of the Federal Coordinator for Meteorological Services and Supporting Research
Advancing Transportation Performance Management and Metrics with Census Data
 Advancing Transportation Performance Management and Metrics with Census Data Authors: Ivana Tasic, University of Utah, Department of Civil and Environmental Engineering, 110 Central Campus Drive, Salt
NOAA Surface Weather Program
 NOAA Surface Weather Program Maintenance Decision Support System Stakeholder Meeting #9 Jim O Sullivan NOAA Surface Weather Program Manager NWS Office of Climate, Water, and Weather Services September
Parking Regulations Dundas Street West, from Bathurst Street to Dovercourt Road
 STAFF REPORT ACTION REQUIRED Parking Regulations Dundas Street West, from Bathurst Street to Dovercourt Road Date: October 28, 2008 To: From: Toronto and East York Community Council Director, Transportation
John Thomas & Lori Zeller US Environmental Protection Agency Office of Sustainable Communities. Rich Kuzmyak & Alex Bell Renaissance Planning Group
 Transportation Research Board ADD30 - Transportation and Land Development Committee Methods to Better Account for Land Use in Planning Multimodal Transportation Systems and Sustainable Communities Moderator:
Transit Time Shed Analyzing Accessibility to Employment and Services
 Transit Time Shed Analyzing Accessibility to Employment and Services presented by Ammar Naji, Liz Thompson and Abdulnaser Arafat Shimberg Center for Housing Studies at the University of Florida www.shimberg.ufl.edu
GIS Data and Technology to Support Transportation & MPO Decision-Making & Planning. using an Eco-Logical* Approach within the Kansas City Region
 GIS Data and Technology to Support Transportation & MPO Decision-Making & Planning using an Eco-Logical* Approach within the Kansas City Region Authors (in alphabetical order): Tom Gerend, Tom Jacobs,
SBCAG Travel Model Upgrade Project 3rd Model TAC Meeting. Jim Lam, Stewart Berry, Srini Sundaram, Caliper Corporation December.
 SBCAG Travel Model Upgrade Project 3rd Model TAC Meeting Jim Lam, Stewart Berry, Srini Sundaram, Caliper Corporation December. 7, 2011 1 Outline Model TAZs Highway and Transit Networks Land Use Database
Indicator: Proportion of the rural population who live within 2 km of an all-season road
 Goal: 9 Build resilient infrastructure, promote inclusive and sustainable industrialization and foster innovation Target: 9.1 Develop quality, reliable, sustainable and resilient infrastructure, including
NJDOT Pedestrian Safety Analysis Tool 2015 GIS T Conference
 NJDOT Pedestrian Safety Analysis Tool 2015 GIS T Conference NJDOT Pedestrian Safety Analysis Tool Justin Furch GIT Department Manager Michael Baker International Pedestrian Safety in NJ: Has the highest
Census Transportation Planning Products (CTPP)
") Census Transportation Planning Products (CTPP) Penelope Weinberger CTPP Program Manager - AASHTO September 15, 2010 1 What is the CTPP Program Today? The CTPP is an umbrella program of data products, custom
Census Transportation Planning Products (CTPP) Penelope Weinberger CTPP Program Manager - AASHTO September 15, 2010 1 What is the CTPP Program Today? The CTPP is an umbrella program of data products, custom
MPOs SB 375 LAFCOs SCAG Practices/Experiences And Future Collaborations with LAFCOs
 Connecting LAFCOs and COGs for Mutual Benefits MPOs SB 375 LAFCOs SCAG Practices/Experiences And Future Collaborations with LAFCOs Frank Wen, Manager Research & Analysis Land Use & Environmental Planning
Impact of Metropolitan-level Built Environment on Travel Behavior
 Impact of Metropolitan-level Built Environment on Travel Behavior Arefeh Nasri 1 and Lei Zhang 2,* 1. Graduate Research Assistant; 2. Assistant Professor (*Corresponding Author) Department of Civil and
TRAVEL DEMAND MODEL. Chapter 6
 Chapter 6 TRAVEL DEMAND MODEL As a component of the Teller County Transportation Plan development, a computerized travel demand model was developed. The model was utilized for development of the Transportation
Economic and Social Urban Indicators: A Spatial Decision Support System for Chicago Area Transportation Planning
 Economic and Social Urban Indicators: A Spatial Decision Support System for Chicago Area Transportation Planning Piyushimita Thakuriah (Vonu), P.S. Sriraj, Paul Metaxatos, Inshu Minocha & Tanushri Swarup
Spatial Data Availability Energizes Florida s Citizens
 NASCIO 2016 Recognition Awards Nomination Spatial Data Availability Energizes Florida s Citizens State of Florida Agency for State Technology & Department of Environmental Protection Category: ICT Innovations
State GIS Officer/GIS Data
 State GIS Officer/GIS Data This Act creates the position of state Geographic Information Systems (GIS) officer. The Act: requires the state GIS officer to adopt or veto the GIS data standards and a statewide
2014 Certification Review Regional Data & Modeling
 2014 Certification Review Regional Data & Modeling July 22, 2014 Regional Data Census Program Coordination PAG works with and for member agencies to ensure full participation in all Census Bureau programs
East Bay BRT. Planning for Bus Rapid Transit
 East Bay BRT Planning for Bus Rapid Transit Regional Vision Draper Prison The Bottleneck is a State-Level issue, Salt Lake County 2050 Population: 1.5M Draper Prison hopefully with some State-Level funding!
Metrolinx Transit Accessibility/Connectivity Toolkit
 Metrolinx Transit Accessibility/Connectivity Toolkit Christopher Livett, MSc Transportation Planning Analyst Research and Planning Analytics Tweet about this presentation #TransitGIS OUTLINE 1. Who is
Changes in the Spatial Distribution of Mobile Source Emissions due to the Interactions between Land-use and Regional Transportation Systems
 Changes in the Spatial Distribution of Mobile Source Emissions due to the Interactions between Land-use and Regional Transportation Systems A Framework for Analysis Urban Transportation Center University
Regional Growth Strategy Work Session Growth Management Policy Board
 Regional Growth Strategy Work Session Growth Management Policy Board September 6, 2018 1 Overview Recap June GMPB work session Objectives and outcomes Regional geographies Growth scenarios Breakout Discussion:
TOWARDS THE DEVELOPMENT OF A MONITORING SYSTEM FOR PLANNING POLICY Residential Land Uses Case study of Brisbane, Melbourne, Chicago and London
 TOWARDS THE DEVELOPMENT OF A MONITORING SYSTEM FOR PLANNING POLICY Residential Land Uses Case study of Brisbane, Melbourne, Chicago and London Presented to CUPUM 12 July 2017 by Claire Daniel Urban Planning/Data
Appendixx C Travel Demand Model Development and Forecasting Lubbock Outer Route Study June 2014
 Appendix C Travel Demand Model Development and Forecasting Lubbock Outer Route Study June 2014 CONTENTS List of Figures-... 3 List of Tables... 4 Introduction... 1 Application of the Lubbock Travel Demand
A CASE STUDY ON EDUCATING ENGINEERING STUDENTS ON THE CHALLENGES OF URBANIZED AT-GRADE INTERSECTIONS
 A CASE STUDY ON EDUCATING ENGINEERING STUDENTS ON THE CHALLENGES OF URBANIZED AT-GRADE INTERSECTIONS Villanova University, Dept. of Civil & Environmental Engineering Villanova, Pennsylvania Presented by:
Advancing Urban Models in the 21 st Century. Jeff Tayman Lecturer, Dept. of Economics University of California, San Diego
 Advancing Urban Models in the 21 st Century Jeff Tayman Lecturer, Dept. of Economics University of California, San Diego 1 Regional Decision System Better tools Better data Better access Better Decisions
The I-81 Challenge: Study update and overview of travel demand model CNY Engineering Expo November 12, 2012
 The I-81 Challenge: Study update and overview of travel demand model CNY Engineering Expo November 12, 2012 Presented by: Meghan Vitale, SMTC Jason Deshaies, SMTC Presentation overview Part 1: Overview
GIS ANALYSIS METHODOLOGY
 GIS ANALYSIS METHODOLOGY No longer the exclusive domain of cartographers, computer-assisted drawing technicians, mainframes, and workstations, geographic information system (GIS) mapping has migrated to
PlaceTypes. How the built environment is measured. Variables Measures Levels. AREA TYPE + DEVELOPMENT TYPE = PlaceType
 PlaceTypes In order to better understand land use and transportation interactions and to make more informed policy decisions, neighborhood characteristics can be analyzed by the role that they play in
Creating a Staff Development Plan with Esri
 Creating a Staff Development Plan with Esri Michael Green David Schneider Guest Presenter: Shane Feirer, University of California Esri UC 2014 Technical Workshop Agenda What is a Staff Development Plan?
Finding Common Ground Through GIS
 Finding Common Ground Through GIS Matthew Stone, MPH Special Unit for Technical Assistance Chronic Disease and Injury Control California Department of Public Health ESRI Health GIS Conference Scottsdale,
Understanding Land Use and Walk Behavior in Utah
 Understanding Land Use and Walk Behavior in Utah 15 th TRB National Transportation Planning Applications Conference Callie New GIS Analyst + Planner STUDY AREA STUDY AREA 11 statistical areas (2010 census)
Appendix C Final Methods and Assumptions for Forecasting Traffic Volumes
 Fairview Ave. and Main St. Improvements and Local Streets Plan Appendices Ada County Highway District Appendix C Final Methods and Assumptions for Forecasting Traffic Volumes January 3, 207 Appendices
NEW YORK AND CONNECTICUT SUSTAINABLE COMMUNITIES. Fair Housing & Equity Assessment & Regional Planning Enhancement
 NEW YORK AND CONNECTICUT SUSTAINABLE COMMUNITIES Fair Housing & Equity Assessment & Regional Planning Enhancement November 19, 2013 White Plains Public Library Federal grant to improve regional planning
PROPOSED PROJECT. Section PROJECT DESCRIPTION
 1 2 3 4 5 6 7 8 9 10 11 12 13 14 15 16 17 18 19 20 21 22 23 24 25 26 27 28 29 30 31 32 33 34 35 36 37 38 39 40 41 42 43 1.1 PROJECT DESCRIPTION This Environmental Assessment describes the proposed improvements
California Urban Infill Trip Generation Study. Jim Daisa, P.E.
 California Urban Infill Trip Generation Study Jim Daisa, P.E. What We Did in the Study Develop trip generation rates for land uses in urban areas of California Establish a California urban land use trip
MANAGING TRANSPORTATION & LAND USE INTERACTIONS (PL-58)
") MANAGING TRANSPORTATION & LAND USE INTERACTIONS (PL-58) COURSE OUTLINE DAY ONE 1:30 2:00 p.m. MODULE 1: History and Context Understand history and foundation for transportation and land use planning today
MANAGING TRANSPORTATION & LAND USE INTERACTIONS (PL-58) COURSE OUTLINE DAY ONE 1:30 2:00 p.m. MODULE 1: History and Context Understand history and foundation for transportation and land use planning today
APPENDIX IV MODELLING
 APPENDIX IV MODELLING Kingston Transportation Master Plan Final Report, July 2004 Appendix IV: Modelling i TABLE OF CONTENTS Page 1.0 INTRODUCTION... 1 2.0 OBJECTIVE... 1 3.0 URBAN TRANSPORTATION MODELLING
3.0 ANALYSIS OF FUTURE TRANSPORTATION NEEDS
 3.0 ANALYSIS OF FUTURE TRANSPORTATION NEEDS In order to better determine future roadway expansion and connectivity needs, future population growth and land development patterns were analyzed as part of
GIS for the Non-Expert
 GIS for the Non-Expert Ann Forsyth University of Minnesota February 2006 GIS for the Non-Expert 1. Definitions and problems 2. Measures being tested in Twin Cities Walking Study Basic approach, data, variables
March 31, diversity. density. 4 D Model Development. submitted to: design. submitted by: destination
 March 31, 2010 diversity density 4 D Model Development submitted to: design submitted by: destination 4 D Model Development Team SANDAG: Mike Calandra Rick Curry Rob Rundle Parsons Brinckerhoff: Bill Davidson
The Next Generation of Traffic Management Systems
 AASHTO CTSO ITS Working Group Meeting The Next Generation of Traffic Management Systems What Resources Do Agencies Need & Is There Interest to Collaborate With TRB Technical Committees & Other Groups?
FHWA Planning Data Resources: Census Data Planning Products (CTPP) HEPGIS Interactive Mapping Portal
 HEPGIS Interactive Mapping Portal") FHWA Planning Data Resources: Census Data Planning Products (CTPP) HEPGIS Interactive Mapping Portal Jeremy Raw, P.E. FHWA, Office of Planning, Systems Planning and Analysis August 2017 Outline Census
FHWA Planning Data Resources: Census Data Planning Products (CTPP) HEPGIS Interactive Mapping Portal Jeremy Raw, P.E. FHWA, Office of Planning, Systems Planning and Analysis August 2017 Outline Census
The World Bank China Wuhan Second Urban Transport (P112838)
") EAST ASIA AND PACIFIC China Transport Global Practice IBRD/IDA Specific Investment Loan FY 2010 Seq No: 7 ARCHIVED on 28-Jun-2015 ISR18605 Implementing Agencies: Wuhan Urban Construction Utilization of
EAST ASIA AND PACIFIC China Transport Global Practice IBRD/IDA Specific Investment Loan FY 2010 Seq No: 7 ARCHIVED on 28-Jun-2015 ISR18605 Implementing Agencies: Wuhan Urban Construction Utilization of
Case Study: Orange County, California. Overview. Context
 Case Study: Orange County, California Overview The Orange County Transportation Authority (OCTA) provides transit service in a generally automobile-oriented part of southern California. Consequently, OCTA
NEW YORK AND CONNECTICUT SUSTAINABLE COMMUNITIES. Fair Housing & Equity Assessment & Regional Planning Enhancement
 NEW YORK AND CONNECTICUT SUSTAINABLE COMMUNITIES Fair Housing & Equity Assessment & Regional Planning Enhancement November 18, 2013 Fordham University Bronx, NY Federal grant to improve regional planning
How GIS Can Help With Tribal Safety Planning
 How GIS Can Help With Tribal Safety Planning Thomas A. Horan, PhD Brian Hilton, PhD Arman Majidi, MAIS Center for Information Systems and Technology Claremont Graduate University Goals & Objectives This
City of Saginaw Right of Way Division Snow and Ice Removal Policy January 18, 2016
 Snow and Ice Removal Policy January 18, 2016 It is the policy of the to provide snowplowing and ice removal services in order to: Provide safe traveling conditions for motorists and pedestrians Assist
Council Workshop on Neighbourhoods Thursday, October 4 th, :00 to 4:00 p.m. Burlington Performing Arts Centre
 Council Workshop on Neighbourhoods Thursday, October 4 th, 2012 1:00 to 4:00 p.m. Burlington Performing Arts Centre Agenda Introductions Warm-Up Exercise Presentation Exercise Neighbourhood Planning Break
The effects of impact fees on urban form and congestion in Florida
 The effects of impact fees on urban form and congestion in Florida Principal Investigators: Andres G. Blanco Ruth Steiner Presenters: Hyungchul Chung Jeongseob Kim Urban and Regional Planning Contents
An Integrated Approach to Statewide Travel Modeling Applications in Delaware
 TRB 88 th Annual Meeting Washington, D.C. January 14 th, 29 An Integrated Approach to Statewide Travel Modeling Applications in Delaware The Context: Challenges for Today s Modelers: Personnel: Vacant
Mapping Accessibility Over Time
 Journal of Maps, 2006, 76-87 Mapping Accessibility Over Time AHMED EL-GENEIDY and DAVID LEVINSON University of Minnesota, 500 Pillsbury Drive S.E., Minneapolis, MN 55455, USA; geneidy@umn.edu (Received
Regional Growth Strategy Regional Staff Committee
 Regional Growth Strategy Regional Staff Committee June 21, 2018 1 Overview Summary of June Growth Management Policy Board Regional Growth Strategy Objectives Regional Geographies Regional Growth Strategy
The purpose of this report is to recommend a Geographic Information System (GIS) Strategy for the Town of Richmond Hill.
 Strategy for the Town of Richmond Hill.") Staff Report for Committee of the Whole Meeting Department: Division: Subject: Office of the Chief Administrative Officer Strategic Initiatives SRCAO.18.12 GIS Strategy Purpose: The purpose of this report
Staff Report for Committee of the Whole Meeting Department: Division: Subject: Office of the Chief Administrative Officer Strategic Initiatives SRCAO.18.12 GIS Strategy Purpose: The purpose of this report
Susan Clark NRS 509 Nov. 29, 2005
 Susan Clark NRS 509 Nov. 29, 2005 The original intent of this project was to look at the role of GIS in the inventory of bicycle and pedestrian facilities. The research, however, indicates a different
Existing road transport network of the National Capital Region was examined for the existing connectivity, mobility and accessibility in the study.
 2 Road Network 2.1 Existing Road Network The existing transport network in National Capital Region is radial in nature. It comprises of expressways, national highways, state highways, major district and
Key Steps for Assessing Mission Critical Data for An ebook by Geo-Comm, Inc.
 Key Steps for Assessing Mission Critical Data for 9-1-1 An ebook by Geo-Comm, Inc. If you re reading this, you probably understand transitioning to Next Generation 9-1-1 (NG9-1-1) means your Geographic
The CRP stresses a number of factors that point to both our changing demographics and our future opportunities with recommendations for:
 Plan Overview The CRP represents the first broad planning initiative covering Lake, Porter and LaPorte counties. Unlike previous plans released by NIRPC, which focused primarily on transportation, the
How GIS based Visualizations Support Land Use and Transportation Modeling
 How GIS based Visualizations Support Land Use and Transportation Modeling ESRI International Users Conference San Diego, CA - July 23, 2015 Prepared by: Troy Hightower Introduction This presentation will
STATE GEOGRAPHIC INFORMATION DATABASE
 STATE GEOGRAPHIC INFORMATION DATABASE Data Information and Knowledge Management STATE GEOGRAPHIC INFORMATION DATABASE EXECUTIVE SUMMARY Utah has developed one of the most comprehensive statewide GIS resources
Measuring connectivity in London
 Measuring connectivity in London OECD, Paris 30 th October 2017 Simon Cooper TfL City Planning 1 Overview TfL Connectivity measures in TfL PTALs Travel time mapping Catchment analysis WebCAT Current and
Environmental Justice Analysis
 Environmental Justice Analysis October 2013 Transportation Department Environmental Justice Analysis Background The U.S. Environmental Protection Agency (EPA) defines environmental justice as the fair
Updating the Urban Boundary and Functional Classification of New Jersey Roadways using 2010 Census data
 Updating the Urban Boundary and Functional Classification of New Jersey Roadways using 2010 Census data By: Glenn Locke, GISP, PMP 1 GIS-T May, 2013 Presentation Overview Purpose of Project Methodology
2015 Grand Forks East Grand Forks TDM
 GRAND FORKS EAST GRAND FORKS 2015 TRAVEL DEMAND MODEL UPDATE DRAFT REPORT To the Grand Forks East Grand Forks MPO October 2017 Diomo Motuba, PhD & Muhammad Asif Khan (PhD Candidate) Advanced Traffic Analysis
Land Use in the context of sustainable, smart and inclusive growth
 Land Use in the context of sustainable, smart and inclusive growth François Salgé Ministry of sustainable development France facilitator EUROGI vice president AFIGéO board member 1 Introduction e-content+
GIS in Community & Regional Planning
 GIS in Community & Regional Planning The The role role of of GIS GIS in in Re-writing the the Zoning Bylaw for for the the City City of of Vernon LandInfo Technologies Presentation Overview The GIS Initiative
6 th Line Municipal Class Environmental Assessment
 6 th Line Municipal Class Environmental Assessment County Road 27 to St John s Road Town of Innisfil, ON September 6, 2016 APPENDIX L: TRAVEL DEMAND FORECASTING MEMORANDUM Accessible formats are available
Xiaoguang Wang, Assistant Professor, Department of Geography, Central Michigan University Chao Liu,
 Xiaoguang Wang, Email: wang9x@cmich.edu Assistant Professor, Department of Geography, Central Michigan University Chao Liu, Email: cliu8@umd.edu Research Associate, National Center for Smart Growth, Research
RURAL SETTLEMENT PATTERNS AND ACCESS TO DEVELOPMENT LAND: DEVELOPING THE EVIDENCE BASE
 School of Planning, Architecture and Civil Engineering RURAL SETTLEMENT PATTERNS AND ACCESS TO DEVELOPMENT LAND: DEVELOPING THE EVIDENCE BASE Prepared for Friends of the Earth Northern Ireland 18 th April
April 10, Mr. Curt Van De Walle, City Manager City of Castle Hills 209 Lemonwood Drive Castle Hills, Texas 78213
 Mr. Curt Van De Walle, City Manager City of Castle Hills 209 Lemonwood Drive Castle Hills, Texas 78213 Subject: Revised Castle Hills BASIS Charter School Traffic Impact Analysis Review City of Castle Hills,
Improving the Model s Sensitivity to Land Use Policies and Nonmotorized Travel
 Improving the Model s Sensitivity to Land Use Policies and Nonmotorized Travel presented to MWCOG/NCRTPB Travel Forecasting Subcommittee presented by John (Jay) Evans, P.E., AICP Cambridge Systematics,
CALOTS Upgrade for Performance Monitoring
 CALOTS Upgrade for Performance Monitoring A project of the Southern California Association of Governments supported by the UCLA Lewis Center for Regional Policy Studies Agenda 1. Revisit Project Overview
THE NEW DNR LANDSLIDE HAZARDS PROGRAM
 THE NEW DNR LANDSLIDE HAZARDS PROGRAM Kara Jacobacci, G.I.T. Landslide Hazards Program Washington Geological Survey Washington Department of Natural Resources LEGISLATIVE FUNDING 2015 session DNR requested
Developing and Validating Regional Travel Forecasting Models with CTPP Data: MAG Experience
 CTPP Webinar and Discussion Thursday, July 17, 1-3pm EDT Developing and Validating Regional Travel Forecasting Models with CTPP Data: MAG Experience Kyunghwi Jeon, MAG Petya Maneva, MAG Vladimir Livshits,
Transportation and Road Weather
 Portland State University PDXScholar TREC Friday Seminar Series Transportation Research and Education Center (TREC) 4-18-2014 Transportation and Road Weather Rhonda Young University of Wyoming Let us know
Environmental Analysis, Chapter 4 Consequences, and Mitigation
 Environmental Analysis, Chapter 4 4.17 Environmental Justice This section summarizes the potential impacts described in Chapter 3, Transportation Impacts and Mitigation, and other sections of Chapter 4,
Trip Generation Model Development for Albany
 Trip Generation Model Development for Albany Hui (Clare) Yu Department for Planning and Infrastructure Email: hui.yu@dpi.wa.gov.au and Peter Lawrence Department for Planning and Infrastructure Email: lawrence.peter@dpi.wa.gov.au
CLAREMONT MASTER PLAN 2017: LAND USE COMMUNITY INPUT
 Planning and Development Department 14 North Street Claremont, New Hampshire 03743 Ph: (603) 542-7008 Fax: (603) 542-7033 Email: cityplanner@claremontnh.com www.claremontnh.com CLAREMONT MASTER PLAN 2017:
D2E GIS Coordination Initiative Functional Transformation Kick-Off Meeting
 D2E GIS Coordination Initiative Functional Transformation Kick-Off Meeting GIS Functional Transformation Kick-Off Meeting May 13, 2008 D2E GIS Coordination Initiative Functional Transformation Kick-Off
TRAFFIC IMPACT STUDY. Platte Canyon Villas Arapahoe County, Colorado (Arapahoe County Case Number: Z16-001) For
 For") TRAFFIC IMPACT STUDY For Platte Canyon Villas Arapahoe County, Colorado (Arapahoe County Case Number: Z16-001) February 2015 Revised: August 2015 April 2016 July 2016 September 2016 Prepared for: KB Home
TRAFFIC IMPACT STUDY For Platte Canyon Villas Arapahoe County, Colorado (Arapahoe County Case Number: Z16-001) February 2015 Revised: August 2015 April 2016 July 2016 September 2016 Prepared for: KB Home
Committee Meeting November 6, 2018
 Committee Meeting November 6, 2018 Agenda Where we are in the process Land Use Plan Transportation Element Housing & Neighborhoods Elements Next Steps Schedule November 6: Plan Elements December: Plan
GIS Geographical Information Systems. GIS Management
 GIS Geographical Information Systems GIS Management Difficulties on establishing a GIS Funding GIS Determining Project Standards Data Gathering Map Development Recruiting GIS Professionals Educating Staff
Alluvium Consulting Australia Senior integrated water management specialist Position Description March 2018
 Alluvium Consulting Australia Senior integrated water management specialist Position Description March 2018 Overview of Alluvium We are an employee-owned consulting firm founded in 2006 to provide advice
Study Overview. the nassau hub study. The Nassau Hub
 Livable Communities through Sustainable Transportation the nassau hub study AlternativeS analysis / environmental impact statement The Nassau Hub Study Overview Nassau County has initiated the preparation
STAFF REPORT. MEETING DATE: July 3, 2008 AGENDA ITEM: 7
 STAFF REPORT SUBJECT: Travel Models MEETING DATE: July 3, 2008 AGENDA ITEM: 7 RECOMMENDATION: Receive information on status of travel model development in Santa Barbara County and review factors to achieve