CVS Derwood. Local Area Transportation Review
|
|
|
- Myron Ralph Boyd
- 5 years ago
- Views:
Transcription
1 CVS Derwood Montgomery County, Maryland May 27, 2016 Local Area Transportation Review Prepared for: JC Bar Properties, Inc. Steve Fleming, PE 415 Fallowfield Road, Suite 301 Camp Hill, Pennsylvania (717)
2 TABLE OF CONTENTS INTRODUCTION and SUMMARY OF FINDINGS... 1 EXISTING TRAFFIC CONDITIONS Site Location Map A Concept Plan Existing Lane Use Existing Peak Hour Traffic Volumes Results of Pedestrian Crossing Timing Analysis Existing Pedestrian & Bicycle Facilities and Transit Service BACKGROUND TRAFFIC CONDITIONS Pipeline Developments Trip Generation for Pipeline Developments A Trip Assignment for Bowie Mill Estates B Trip Assignment for Alfred House Background Peak Hour Traffic Volumes TOTAL TRAFFIC CONDITIONS Trip Generation for Subject Site Trip Distribution Percentage for Subject Site Trip Assignment for Subject Site Pass By Trip Assignment Total Peak Hour Traffic Volumes Results of Intersection Capacity Analyses (CLV) HCM Queue Analysis for MD 115 & Redland Rd RESULTS, RECOMMENDATIONS, AND CONCLUSIONS... 28
3
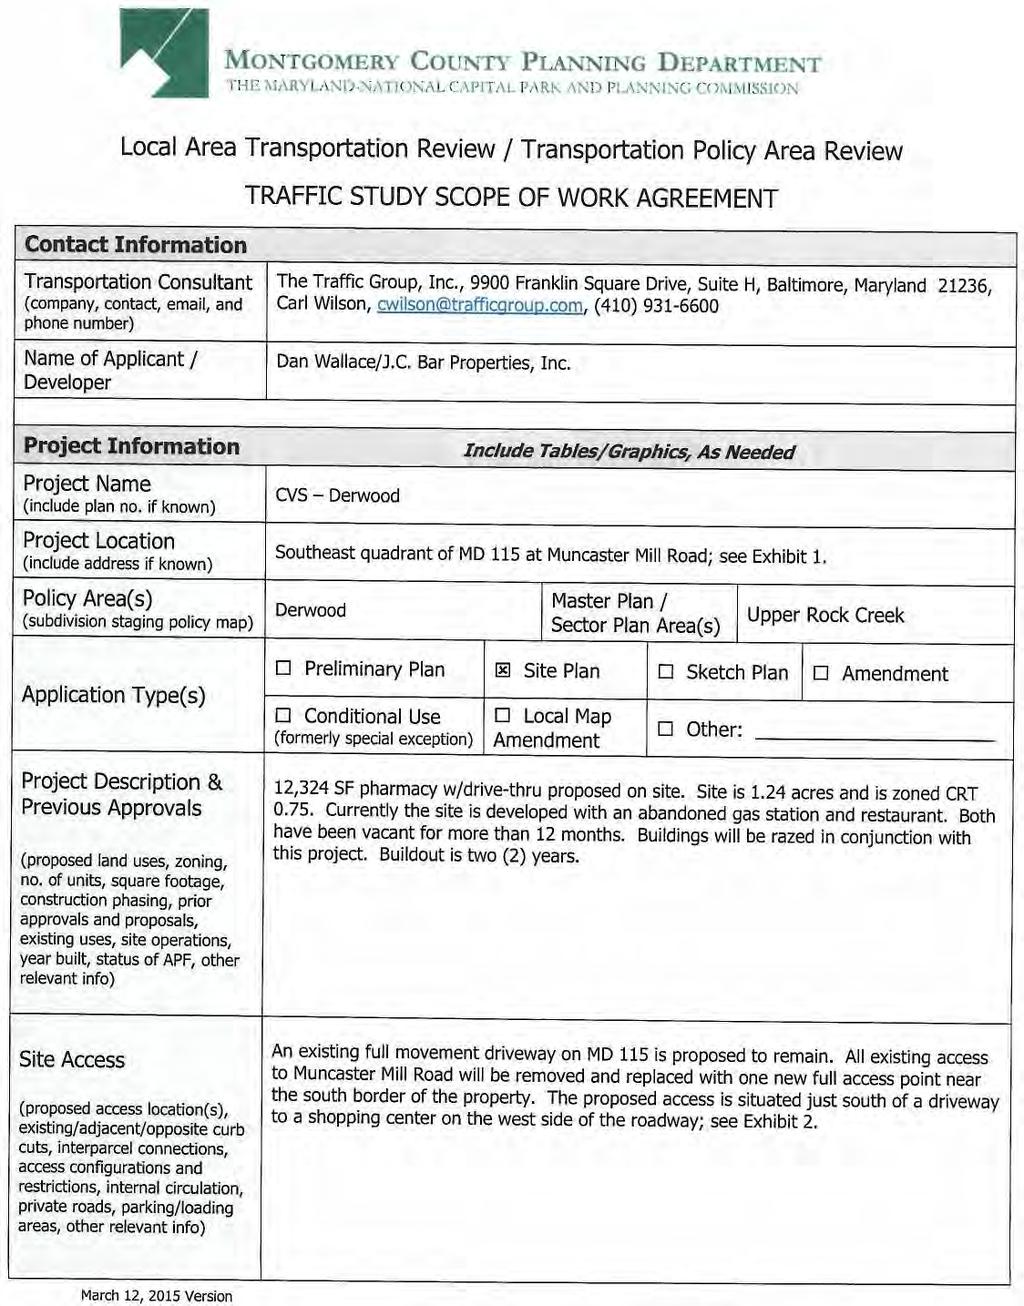
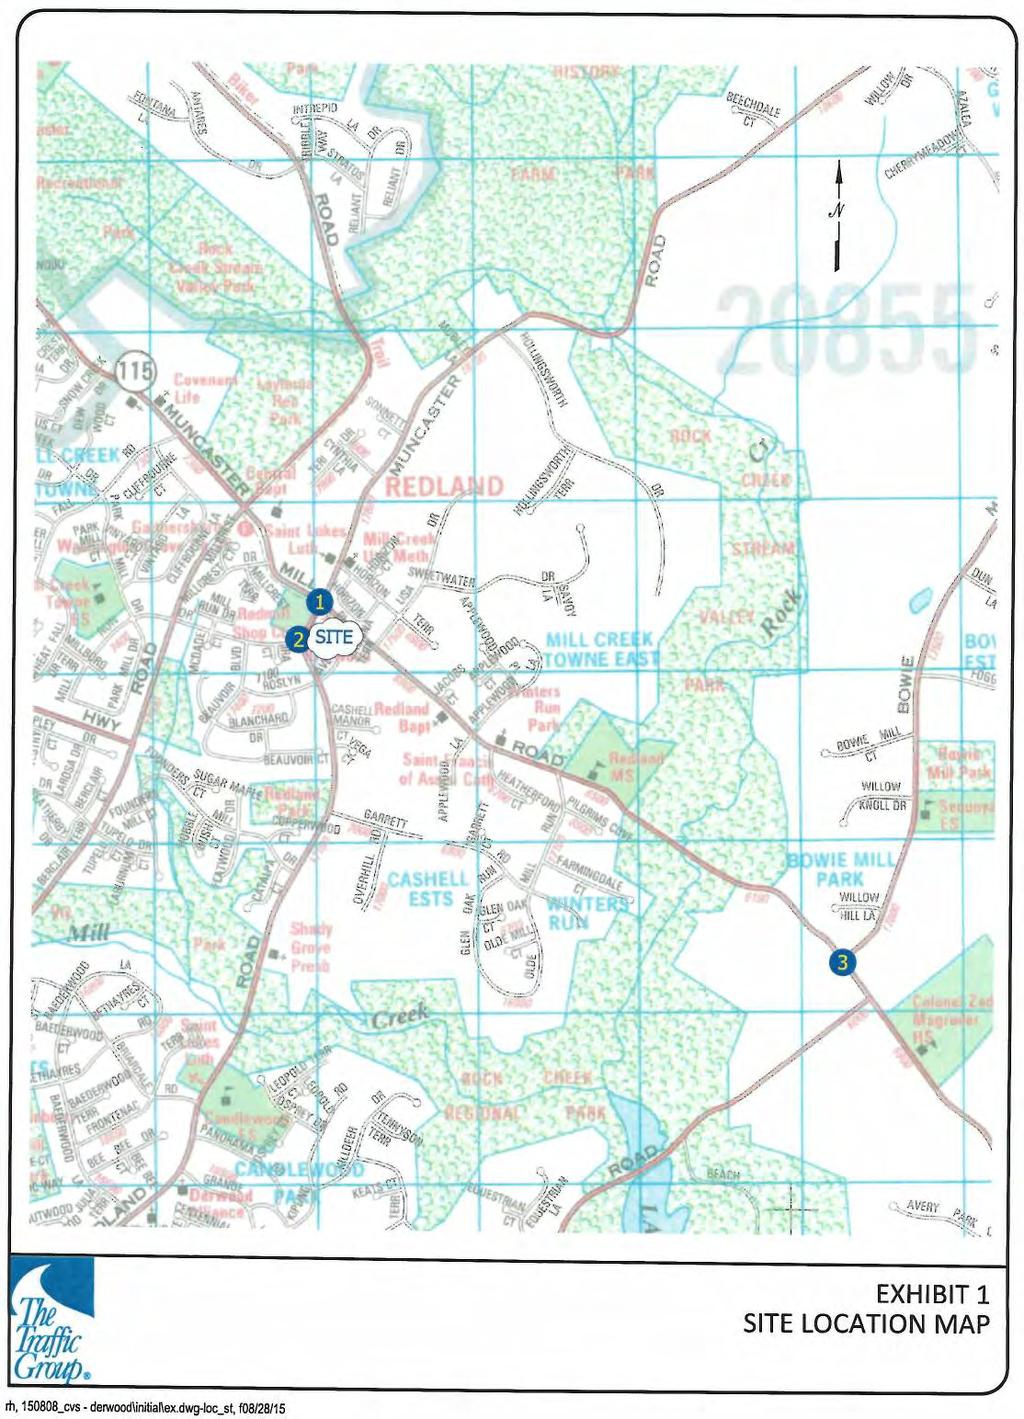
4 INTRODUCTION AND SUMMARY OF FINDINGS Study Purpose The Traffic Group, Inc. has prepared this Local Area Transportation Review (LATR) to quantify the impact that the proposed development of a 9,965 sq. ft. CVS Pharmacy with drive thru will have on surrounding roadway network in the Derwood section of Montgomery County. The subject site is located in the southeast quadrant of MD 115 (Muncaster Mill Road) at Redland Road. The site currently features two abandoned properties which will be consolidated into a single lot. The combined properties feature two access points to MD 115 and four access points to Redland Road. The access is proposed to be consolidated into a single full movement point along MD 115 and a single left in/right in/right out full movement point along Redland Road. Each access point will operate under stop control. Restrictions will be placed by signing to prohibit certain movements during certain peak hours. Study Criteria/Methodology This report has been prepared in accordance with standards set forth in the Maryland National Capital Park and Planning Commissions (M NCPPC) Local Area Transportation Review and Transportation Policy Area Review Guidelines, a document published in January A scoping agreement for this site was approved by M NCPPC on September 4, A copy of the scoping agreement can be found in Appendix D. CVS Derwood is located within the Derwood Policy Area. As a result, the acceptable CLV threshold is 1,475 for all intersections. With regard to Transportation Policy Area Review (TPAR), the Derwood Policy Area is considered to have an adequate roadway test result but an inadequate transit test result. Therefore, the development is subject to a TPAR payment of 25% of the Impact Tax. As a result of the proposed access locations adjacent to the signalized intersection of MD 115 at Redland Road, M NCPPC has requested queueing analysis for the intersection. All queueing analysis for this location was prepared in accordance with Highway Capacity Manual (HCM Procedures) as required by M NCPPC. 1
5 It is anticipated that the subject site will generate significantly fewer than 249 peak hour trips. Therefore, a single tier of signalized intersections is incorporated within this document. Scope of Services The principle scope of services undertaken for the study was as follows: Conduct a field inspection to collect physical information concerning the nearby road system including a compilation of aerial photography. Collect intersection turning movement counts from 6:30 9:30 a.m. and 4 7 p.m. at each study intersection. Obtain a list of approved background developments from M NCPPC sources. Prepare Trip Generation and Trip Distribution for all background developments and the subject site. Undertake Level of Service Evaluations for each study intersection using existing, background and total traffic conditions. Review pedestrian amenities and transit service in the area and develop a Pedestrian Impact Statement. Calculate the required TPAR payment for this site. Summary of Findings and Recommendations This document will demonstrate that each study intersection currently exhibits acceptable operations based on the CLV congestion standard. With the additional traffic to be generated by the approved background developments and the subject site, each intersection is projected to maintain acceptable operations. Therefore, it is our opinion that the surrounding road network is capable of supporting the proposed development without further off site improvements. With regard to queueing, the northbound approach of Redland Road currently experiences queues that extend beyond the proposed site access point during the evening peak period. During the morning peak period, and throughout the 2
6 rest of the day, the northbound queue is significantly less and does not impact the site access point. In order to adequately address questions raised by Montgomery County Department of Transportation officials, the access point to Redland Road will be designed with an island to restrict all left turns out of the property. An R3 2(1) sign will be posted along Redland Road to prohibit left turns into the site from 3 PM 7 PM. SHA raised questions about traffic exiting the subject site during the AM peak hour because of the queuing on MD 115. It was agreed to with SHA officials that a sign will be required on property to restrict left turns exiting the site. The R3 2(1) sign will feature a restriction from 7 9 AM and 4 6 PM. No physical channelization will be constructed within the MD 115 driveway. Copies of meeting correspondence can be found in Appendix D. To satisfy TPAR, a payment will be required to address the transit test results for the Derwood Policy Area. With the payment of the fee all adequacy requirements are satisfied. 3
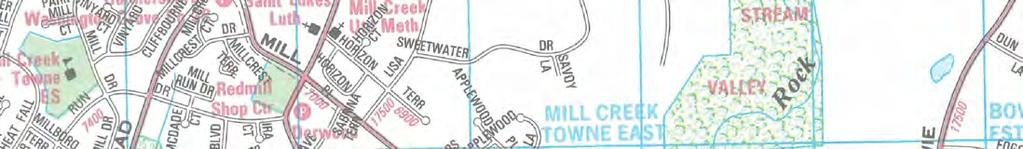
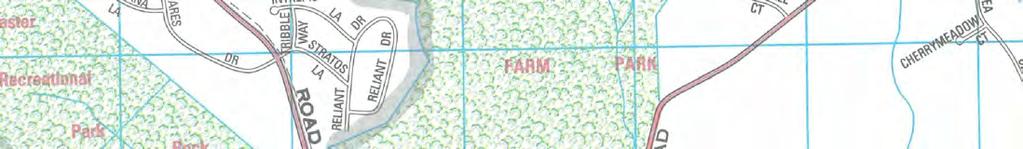
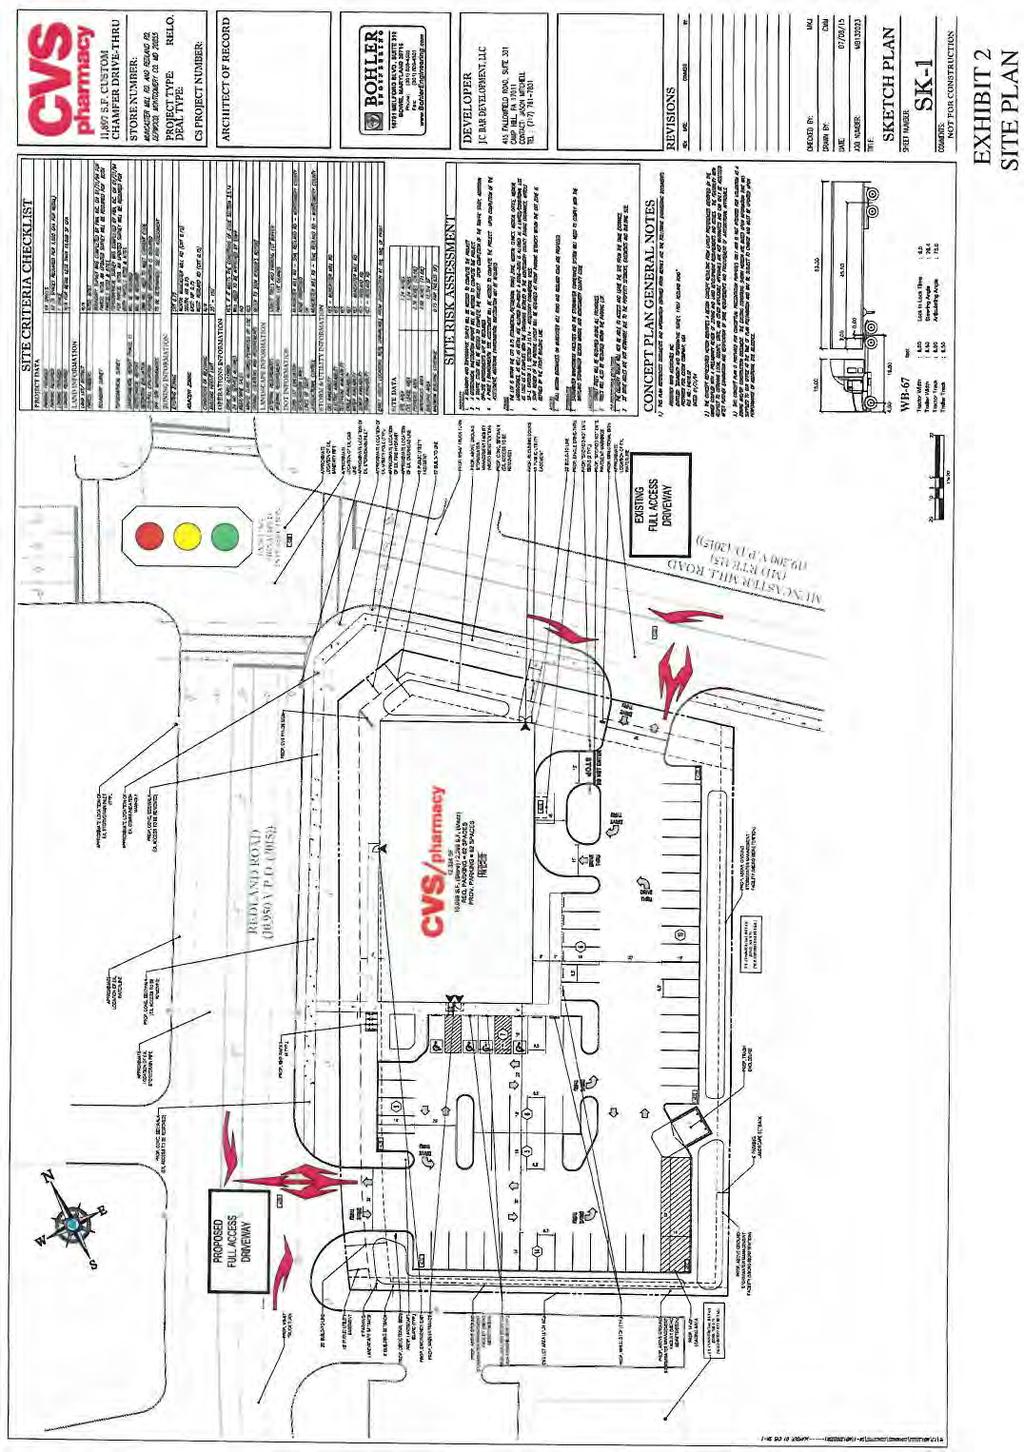
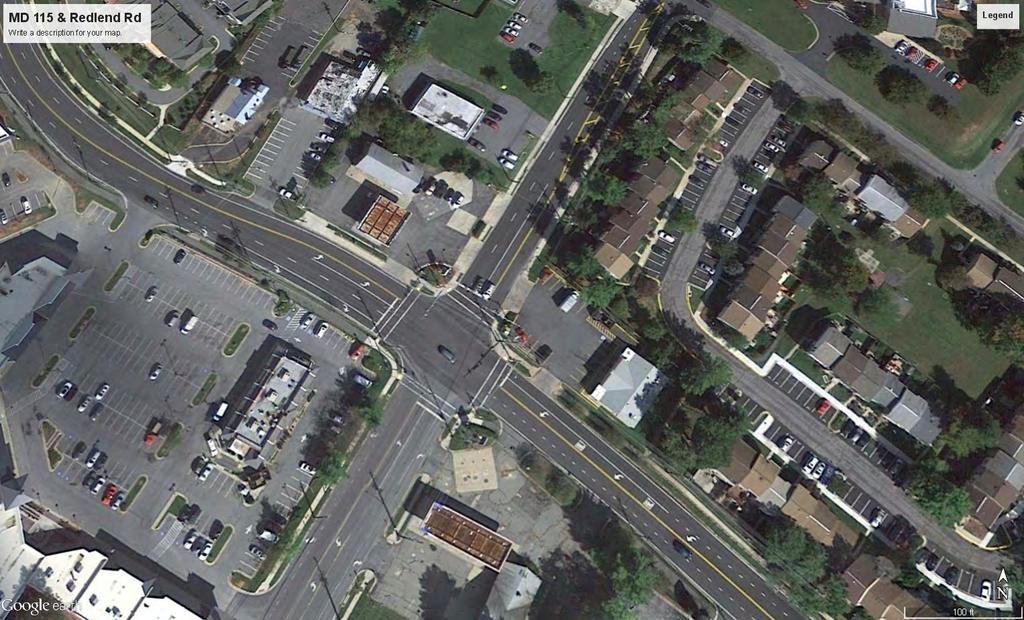
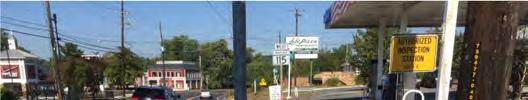
7 EXISTING TRAFFIC CONDITIONS Site Information The CVS Derwood is located in the southeast quadrant of the intersection of MD 115 (Muncaster Mill Road) at Redland Road in the Derwood section of Montgomery County. The site is currently developed with an abandoned gas station and an abandoned convenience store which will be razed. A map showing the site and the existing road network can be found in Exhibit 1. A concept plan detailing the proposed development can be found in Exhibit 1A. Study Area Based on the location of the property and the projected trip generation, M NCPPC identified the following intersection to be included within this analysis. MD 115 at Redland Road Redland Road at Mill Run Drive MD 115 at Bowie Mill Road Redland Road at Site Access to Red Mill Shopping Center Near the proposed site, MD 115 features one thru lane in the westbound direction and two thru lanes in the eastbound direction. Just east of the site, the roadway narrows down to a single travel lane. There are auxiliary turn lanes along eastbound and westbound MD 115. Redland Road features one travel lane in each direction accompanied by auxiliary lanes. In the northbound direction the 120 foot long west turn lane is followed by a 220 foot long two way left turn lane. The Two Way Left Turn Lane (TWLTL) features access to properties on both the east and west side of the roadway. The intersection of MD 115 at Muncaster Mill Road is controlled by signalization. To the south, the intersection of Redland Road at Mill Run Drive features stop control. This intersection is situated approximately 500 feet south of MD 115. MD 115 is maintained by the Maryland State Highway Administration (SHA). It traverses Montgomery County in the east/west direction for a distance of approximately 5.83 miles from MD 124 (Woodfield Road) to MD 28/MD 355 (Norbeck Road). In the vicinity of the subject site, MD 115 is classified as an Urban Minor Arterial on the state secondary system. There are no access 4
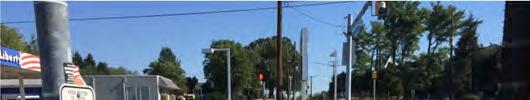
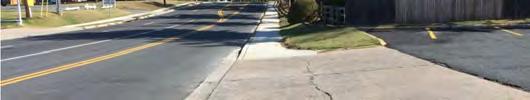
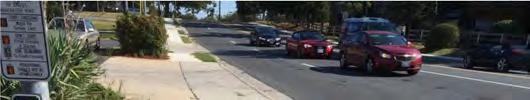
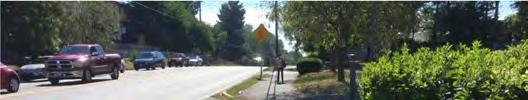
8 controls, and the roadway is not considered part of the National Highway System. Montgomery County also classifies MD 115 as an arterial route. Redland Road is a county maintained roadway extending from I 270 northerly/easterly to MD 115. North of MD 115 the roadway continues as Muncaster Mill Road. Montgomery County classifies Redland Road as a residential primary street on its Master Plan of Highways. Exhibit 2 has been prepared to detail the speed limits traffic control devices and lane use configurations at each of the study intersections. Aerial photographs provided in further detail can be found in Appendix A. Traffic Volumes Intersection turning movement counts were collected at each of the study intersections from 6:30 9:30 a.m. and from 4 7 p.m. on a typical weekday while public school was in session for a full day. Exhibit 3 contains a summary of the peak hour volumes passing through each of the study intersections. Full details on the traffic data can be found in Appendix A. Pedestrian Impact Statement While the turning movement counts were collected, pedestrian volumes were also observed at all intersections. Details on the pedestrian counts can be found in Appendix A. A review of the data contained in Appendix A reveals that relatively minimal pedestrian activity was observed throughout the counting period. The most intense observations were along the south leg of Redland Road at MD 115 where a total of 26 pedestrians crossed the intersection during the entire three hour afternoon counting period. Similarly the west leg of Mill Run Drive at Redland Road featured a total of 37 pedestrians throughout the entire count period. There were no pedestrians observed at the intersection of MD 115 and Bowie Mill Road. The intersection of MD 115 at Redland Road is the only location within the study area that features pedestrian signals. Therefore, the crossing timing analysis is provided for this location only. As shown in Exhibit 4, the available time to cross each of the four legs is greater than the desired time. 5
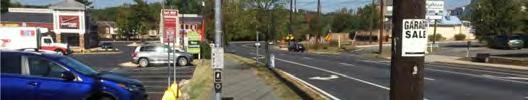
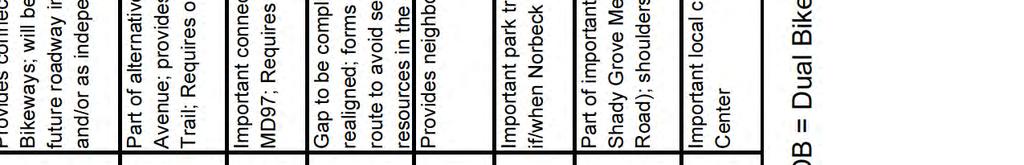
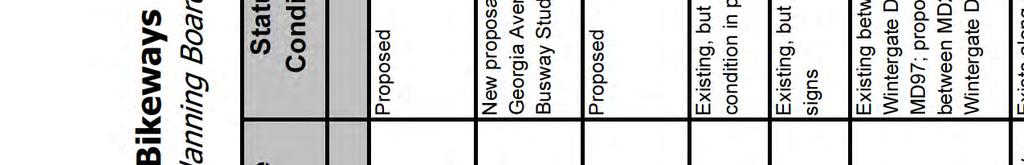
9 Pedestrian facilities were inventoried at each of the study locations. Exhibit 5 details the existing amenities. Specifically, a five foot wide sidewalk is available throughout the study area. The sidewalk does not extend easterly to Bowie Mill Road, thus there are no pedestrian amenities. There are ADA compliant ramps located at the signalized intersection of MD 115 and Redland Road. Two bus routes currently utilize the MD 115/Redland Road corridors. They are Routes 53 and 57, operated by Ride On. Various stops are available throughout the study area. Details on the bus schedule can be found in Appendix C. Bikeway BL 35 traverses MD 115 within the study area. Bikeway. It is an on street Analysis of Existing Traffic Conditions Intersection Capacity Analyses were undertaken for each of the study intersections using Critical Lane Volume (CLV) Methodology. The results are summarized in Exhibit 15. Complete capacity worksheets can be found in Appendix B. A review of Exhibit 15 reveals that each intersection currently operates below the 1475 Congestion Standard. Queueing Analysis was undertaken for the intersection of MD 115 at Redland Road as required by M NCPPC. HCM results can be found in Exhibit 16. As shown within the results, the existing northbound Redland Road left turn exceeds the available storage space during the afternoon peak. During other time periods, the storage length is adequate to accommodate demand. Similarly, the eastbound MD 115 left turn slightly exceeds the available storage space for the PM peak period only. 6


10 7


11 EXHIBIT 1A 8 CONCEPT PLAN
12 9
13 10
14 RESULTS OF PEDESTRIAN CROSSING TIMING ANALYSIS INTERSECTION Crossing Distance (ft) Available Time (Second) Desired Time (Second) MD 115 & Redland Rd/Muncaster Rd East Leg of MD West Leg of MD North Leg of Muncaster Rd South Leg of Redland Rd Note: 1. Desired Time is calculated by divide Crossing Distance by 3.5 ft/sec walking speed then subtracting red clearance time. The existing pedestrian signal timing can be found in attached document provided by Transportation Management Center. 2. Crossing distance are measured from curb to the far edge of the far travel lane. EXHIBIT 4 RESULTS OF PEDESTRIAN CROSSING TIMING ANALYSIS rh, \initial\pedtiming.xls-pedtime1, f10/01/15 11
15 12
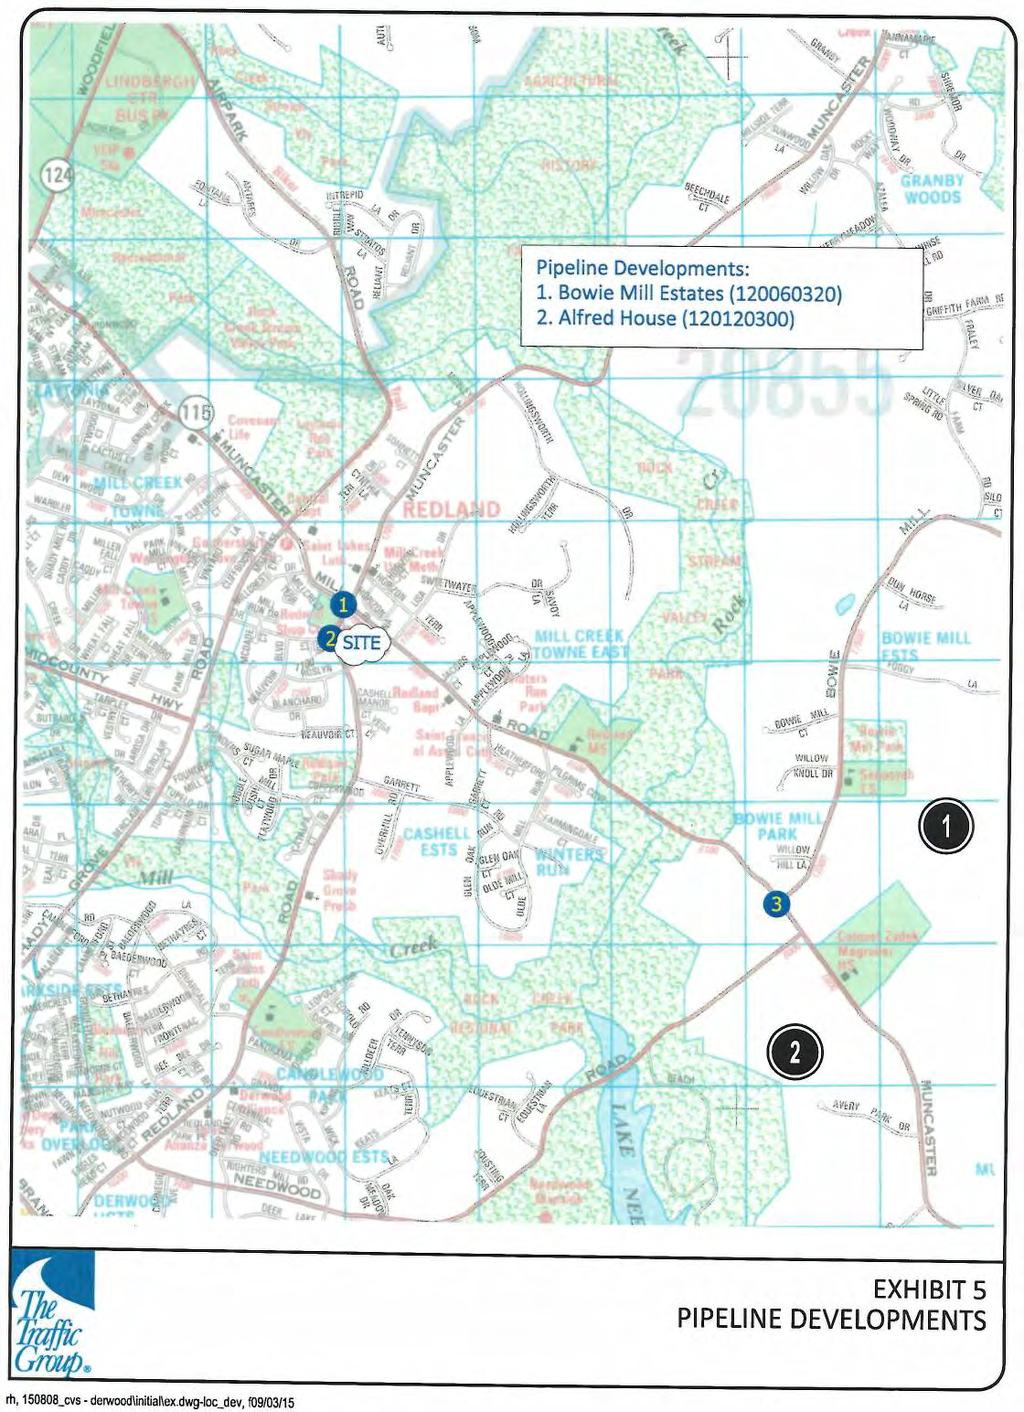
16 BACKGROUND TRAFFIC CONDITIONS Background Traffic Representatives from M NCPPC confirmed that there are two approved pipeline developments near the subject site. They include: Bowie Mill Estates ( ) Alfred House ( ) Exhibit 6 details the relative locations of the background developments. The trips projected to be generated by each of the background developments were distributed and assigned to the road network based on current traffic patterns and projected future demand. Exhibit 7 details the trip generation for the individual background developments, which is based on M NCPPC rates. The trips are assigned in Exhibits 8A and 8B. Adding the trips to be generated by each of the background developments to the existing peak hour traffic volumes results in the background peak hour traffic volumes as shown in Exhibit 9. Analysis of Background Traffic Conditions CLV Analysis was again undertaken for each of the study intersections, this time with consideration given to each of the background developments. The results of the CLV Analysis are summarized in Exhibit 15. Complete capacity worksheets can be found in Appendix B. A review of Exhibit 15 reveals that each intersection is projected to operate acceptably with the development of all background properties. Queueing Analysis was also undertaken for the background condition at the intersection of MD 115 at Redland Road. As shown in Exhibit 16, the queue lengths remain similar under the background condition. 13
17 14
18 Trip Generation Rates Formula/Rate Directional Distribution AM Peak Hour PM Peak Hour IN OUT IN OUT Single-Family Detached (Montgomery County Rate, 75 units or more) Morning Trips = 0.62 x (Units) % 75% 64% 36% Evening Trips = 0.82 x (Units) + 21 Senior/Elderly Housing (Montgomery County Rate, Assisted-Living Facility) Morning Trips = 0.03 x Units Evening Trips = 0.06 x Units Trip Generation for Pipeline Developments No. Land Use Size AM Peak Hour PM Peak Hour In Out Total In Out Total 1. Bowie Mill Estates ( )- Approved 186 SFD, 79 Unbuild Single Family Detached 79 Units AlfredHouse Assisted Living Units 34 Units FH F:\2015\ _CVS - Derwood\ENG\INITIAL\Trips.xls,10/1/2015 EXHIBIT 7 TRIP GENERATION FOR PIPELINE DEVELOPMENTS 15
19 16
20 17
21 18
22 TOTAL TRAFFIC CONDITIONS Site Information CVS Derwood is proposed to be developed in the southeast corner of the intersection of MD 115 at Redland Road in the Derwood section of Montgomery County. A pharmacy with drive thru containing 9,965 sq. ft. is proposed to be developed on site. Access to the property is proposed via one point along MD 115 and one point along Redland Road. Each location will operate under stop control. Along MD 115 left turns will be restricted by signing during the peak periods. Along Redland Road left turns out will be precluded at all times through channelization. Left turns in will be restricted by signing from 4 PM 7 PM. The access points are positioned as far from the signalized intersection as possible to provide the most efficient access scenario. Trip Generation/Distribution Since M NCPPC does not have an established trip rate for a pharmacy land use, the Institute of Transportation Engineers (ITE) Trip Generation (9 th Edition) was used to quantify the projected trips associated with the developments as shown in Exhibit 10 a total of 33 AM peak hour trips, and 96 evening peak hour trips are expected. It is important to recognize the trips generated by the proposed development are significantly lower than the trips associated with the previous uses on site. Because those uses have been abandoned for such a long period of time, no reduction is taken in this section of the analysis. The pharmacy land use is considered convenience retail and will have a significant amount of pass by trips. Pass by trips represent vehicles that are already travelling on the road network stopping by the pharmacy as an intermediate destination while travelling to their final destination. ITE permits a reduction of up to 49% of the trips during the peak p.m. period. No rate is provided for the morning peak period, so no reduction is taken. It stands to reason that given the proximity of this pharmacy to the intersection of MD 115 at Redland Road that the true pass by rate would likely even be higher. The trips projected to be generated by the CVS pharmacy were distributed and assigned to the road network based on current traffic patterns, projected future demand, and the restricted access configurations. Exhibit 11 contains a summary of the trip distribution percentage while the trip assignment can be found in Exhibit 12. The corresponding pass by trip assignment is summarized in Exhibit 13. It is important to recognize no new trips were assigned to or from the south because of the restricted left turn egress. It is likely that additional movements will occur during non peak hours to the south. Combining all site 19
23 trips with the background peak hour traffic volumes results in the total peak hour traffic volumes as shown on Exhibit 14. Analysis of Total Traffic Conditions Intersection Capacity Analysis was again undertaken for each of the study intersections this time with consideration given to the full buildout of CVS Derwood. The results of the CLV analysis can be found in Exhibit 15. Appendix B contains complete capacity worksheets. As shown within Exhibit 15 each intersection, including the site access points, is projected to operate below the 1475 Congestion Standard. Queueing Analysis was again undertaken for the intersection of MD 115 at Redland Road using HCM criteria. The results are shown in Exhibit 16. A review of the exhibit reveals that the subject site will not increase any queue length by more than one vehicle. While the northbound Redland Road left turn exceeds the available storage, the subject site has a minimal impact on this movement because of the limited anticipated demand. During the morning peak period the northbound Redland Road left turn is capable of stacking within the existing storage length. The configuration of the surrounding road network does not permit any further lengthening of this turn bay. It is understood that site traffic will be delayed as a result of the p.m. queueing. Traffic exiting the site will have to wait for an appropriate gap before entering the traffic stream. The delays will not impact existing traffic on Redland Road. Transportation Policy Area Review (TPAR) For sites located within the Derwood Policy Area, TPAR dictates a payment equal to 25% of the Transportation Impact Tax is required to satisfy the transit test result. Effective July 1, 2015, the Transportation Impact Tax is assessed at $11.40 per square foot of retail development. There are two existing structures on site for which a credit can be applied to the Transportation Impact Tax: a 3,067 sq. ft. gas station and a 616 sq. ft. convenience store. Therefore, the TPAR payment for this 9,965 sq. ft. building is calculated as follows: 9,965 SF CVS 2,067 SF Gas Station 616 SF Convenience Store = 7,282 SF 7,282 SF x $11.40 x 25% = $20,
24 Trip Generation Rates Formula/Rate Pharmacy/Drugstore w/drive Thru (ksf, ITE-881) Directional Distribution AM Peak Hour PM Peak Hour On Out In Out Morning Trips = 3.45 x ksf 52% 48% 50% 50% Evening Trips = 9.91 x ksf Trip Generation for CVS - Proposed Land Use Size AM Peak Hour PM Peak Hour In Out Total In Out Total Pharmacy w/drive Thru 9,965 sq.ft Pass-by Trips (PM-49%) Net Trips Note: Site trips are based on ITE Trip Generation 9th Edition. Pass by trips are based on ITE Trip Generation Handbook 3rd Edition. FH, F:\2015\ _CVS - Derwood\ENG\REV3\Trips, 5/6/2016 EXHIBIT 10 TRIP GENERATION FOR 21 SUBJECT SITE
25 22
26 23
27 24
28 25
29 CLV Existing Traffic Background Traffic Total Traffic Morning Peak Hour Traffic CLV CLV CLV 1. MD 115 & Redland Rd/Muncaster Rd Redland Rd & Mill Run Dr MD 115 & Bowie Mill Rd MD 115 & Site Access MD 115 & Site Access Evening Peak Hour Traffic 1. MD 115 & Redland Rd/Muncaster Rd Redland Rd & Mill Run Dr MD 115 & Bowie Mill Rd MD 115 & Site Access MD 115 & Site Access Note: Congestion Standard for Derwood Policy Area is EXHIBIT 15 RESULTS OF INTERSECTION CAPACITY ANALYSES (CLV) rh, \rev3\los.xls-result, f05/06/16 26
30 HCM th Queue Existing Traffic Background Traffic Total Traffic Morning Peak Hour Traffic 1. MD 115 & Redland Rd/Muncaster Rd Storage Length Queue (ft) Queue (ft) Queue (ft) EB MD 115 Left Turn 110' WB MD 115 Left Turn 415' NB Redland Left Turn 340' SB Muncaster Rd Left Turn 150' Evening Peak Hour Traffic 1. MD 115 & Redland Rd/Muncaster Rd EB MD 115 Left Turn 110' WB MD 115 Left Turn 415' NB Redland Left Turn 340' SB Muncaster Rd Left Turn 150' EXHIBIT 16 HCM QUEUE ANALYSIS FOR MD 115 & REDLAND RD rh, \rev3\los.xls-q, f05/06/16 27
31 RESULTS, RECOMMENDATIONS, AND CONCLUSIONS Study Purpose The Traffic Group, Inc. has prepared this Local Area Transportation Review (LATR) to quantify the impact that the proposed development of a 9,965 sq. ft. CVS Pharmacy with drive thru will have on surrounding roadway network in the Derwood section of Montgomery County. The subject site is located in the southeast quadrant of MD 115 (Muncaster Mill Road) at Redland Road. The site currently features two abandoned properties which will be consolidated into a single lot. The combined properties feature two access points to MD 115 and four access points to Redland Road. The access is proposed to be consolidated into a single full movement point along MD 115 and a single left in/right in/right out full movement point along Redland Road. Each access point will operate under stop control. Restrictions will be placed by signing to prohibit certain movements during certain peak hours. Study Criteria/Methodology This report has been prepared in accordance with standards set forth in the Maryland National Capital Park and Planning Commissions (M NCPPC) Local Area Transportation Review and Transportation Policy Area Review Guidelines, a document published in January A scoping agreement for this site was approved by M NCPPC on September 4, A copy of the scoping agreement can be found in Appendix D. CVS Derwood is located within the Derwood Policy Area. As a result, the acceptable CLV threshold is 1,475 for all intersections. With regard to Transportation Policy Area Review (TPAR), the Derwood Policy Area is considered to have an adequate roadway test result but an inadequate transit test result. Therefore, the development is subject to a TPAR payment of 25% of the Impact Tax. As a result of the proposed access locations adjacent to the signalized intersection of MD 115 at Redland Road, M NCPPC has requested queueing analysis for the intersection. All queueing analysis for this location was prepared in accordance with Highway Capacity Manual (HCM Procedures) as required by M NCPPC. 28
32 It is anticipated that the subject site will generate significantly fewer than 249 peak hour trips. Therefore, a single tier of signalized intersections is incorporated within this document. Summary of Findings and Recommendations This document will demonstrate that each study intersection currently exhibits acceptable operations based on the CLV congestion standard. With the additional traffic to be generated by the approved background developments and the subject site, each intersection is projected to maintain acceptable operations. Therefore, it is our opinion that the surrounding road network is capable of supporting the proposed development without further off site improvements. With regard to queueing, the northbound approach of Redland Road currently experiences queues that extend beyond the proposed site access point during the evening peak period. During the morning peak period, and throughout the rest of the day, the northbound queue is significantly less and does not impact the site access point. In order to adequately address safety concerns raised by Montgomery County Department of Transportation officials, the access point to Redland Road will be designed with an island to restrict all left turns out of the property. An R3 2(1) sign will be posted along Redland Road to prohibit left turns into the site from 3 PM 7 PM. SHA raised questions about traffic exiting the subject site during the AM peak hour because of the queuing on MD 115. It was agreed to with SHA officials that a sign will be required on property to restrict left turns exiting the site. The R3 2(1) sign will feature a restriction from 7 9 AM and 4 6 PM. No physical channelization will be constructed within the MD 115 driveway. Copies of meeting correspondence can be found in Appendix D. To satisfy TPAR, a payment will be required to address the transit test results for the Derwood Policy Area. With the payment of the fee all adequacy requirements are satisfied. 29
33 APPENDIX A Scope of Work Agreement Intersection Turning Movement Counts, And Photos
34 1
35 2
36 3
37 4
38 5
39 6
40 7
41 8
42 9
43 VEHICLES TURNING MOVEMENT COUNT - SUMMARY Counted by: VCU Intersection of: MD 115 Date: September 22, 2015 Tuesday and: Muncaster Road - Redland Road Weather: Sunny/Warm Location: Montgomery County, Maryland Entered by: SN Star Rating: 5 TRAFFIC FROM NORTH TRAFFIC FROM SOUTH TRAFFIC FROM EAST TRAFFIC FROM WEST TOTAL on: Muncaster Road on: Redland Road on: MD 115 on: MD 115 N + S TIME + RIGHT THRU LEFT U-TN TOTAL RIGHT THRU LEFT U-TN TOTAL RIGHT THRU LEFT U-TN TOTAL RIGHT THRU LEFT U-TN TOTAL E + W AM 6:30-6: :45-7: :00-7: :15-7: :30-7: :45-8: :00-8: :15-8: :30-8: :45-9: :00-9: :15-9: Hr Totals Hr Totals 6:30-7: :45-7: :00-8: :15-8: :30-8: :45-8: :00-9: :15-9: :30-9: PEAK HOUR 7:15-8: PM 4:00-4: :15-4: :30-4: :45-5: :00-5: :15-5: :30-5: :45-6: :00-6: :15-6: :30-6: :45-7: Hr Totals Hr Totals 4:00-5: :15-5: :30-5: :45-5: :00-6: :15-6: :30-6: :45-6: :00-7: PEAK HOUR 5:00-6:
44 BICYCLES TURNING MOVEMENT COUNT - SUMMARY Counted by: VCU Intersection of: MD 115 Date: September 22, 2015 Tuesday and: Muncaster Road - Redland Road Weather: Sunny/Warm Location: Montgomery County, Maryland Entered by: SN Star Rating: 5 TRAFFIC FROM NORTH TRAFFIC FROM SOUTH TRAFFIC FROM EAST TRAFFIC FROM WEST TOTAL on: Muncaster Road on: Redland Road on: MD 115 on: MD 115 N + S TIME + RIGHT THRU LEFT U-TN TOTAL RIGHT THRU LEFT U-TN TOTAL RIGHT THRU LEFT U-TN TOTAL RIGHT THRU LEFT U-TN TOTAL E + W AM 6:30-6: :45-7: :00-7: :15-7: :30-7: :45-8: :00-8: :15-8: :30-8: :45-9: :00-9: :15-9: Hr Totals Hr Totals 6:30-7: :45-7: :00-8: :15-8: :30-8: :45-8: :00-9: :15-9: :30-9: PEAK HOUR 7:15-8: PM 4:00-4: :15-4: :30-4: :45-5: :00-5: :15-5: :30-5: :45-6: :00-6: :15-6: :30-6: :45-7: Hr Totals Hr Totals 4:00-5: :15-5: :30-5: :45-5: :00-6: :15-6: :30-6: :45-6: :00-7: PEAK HOUR 5:00-6:
45 PEDESTRIAN OBSERVATIONS - SUMMARY TIME AM Counted by: VCU Intersection of: MD 115 Date: September 22, 2015 Tuesday and: Muncaster Road - Redland Road Weather: Sunny/Warm Location: Montgomery County, Maryland Entered by: SN Star Rating: 5 6:30-6: :45-7: :00-7: :15-7: :30-7: :45-8: :00-8: :15-8: :30-8: :45-9: :00-9: :15-9: TOTALS PM NORTH LEG SOUTH LEG EAST LEG WEST LEG Muncaster Road Redland Road MD 115 MD 115 4:00-4: :15-4: :30-4: :45-5: :00-5: :15-5: :30-5: :45-6: :00-6: :15-6: :30-6: :45-7: TOTALS
46 MD 115 & Redland/Muncaster Rd 13
47 VEHICLES TURNING MOVEMENT COUNT - SUMMARY Counted by: VCU Intersection of: Redland Road Date: September 22, 2015 Tuesday and: Mill Run Drive Weather: Sunny/Warm Location: Montgomery County, Maryland Entered by: SN Star Rating: 5 TRAFFIC FROM NORTH TRAFFIC FROM SOUTH TRAFFIC FROM EAST TRAFFIC FROM WEST TOTAL on: Redland Road on: Redland Road on: on: Mill Run Drive N + S TIME + RIGHT THRU LEFT U-TN TOTAL RIGHT THRU LEFT U-TN TOTAL RIGHT THRU LEFT U-TN TOTAL RIGHT THRU LEFT U-TN TOTAL E + W AM 6:30-6: :45-7: :00-7: :15-7: :30-7: :45-8: :00-8: :15-8: :30-8: :45-9: :00-9: :15-9: Hr Totals Hr Totals 6:30-7: :45-7: :00-8: :15-8: :30-8: :45-8: :00-9: :15-9: :30-9: PEAK HOUR 7:15-8: PM 4:00-4: :15-4: :30-4: :45-5: :00-5: :15-5: :30-5: :45-6: :00-6: :15-6: :30-6: :45-7: Hr Totals Hr Totals 4:00-5: :15-5: :30-5: :45-5: :00-6: :15-6: :30-6: :45-6: :00-7: PEAK HOUR 5:15-6:
48 BICYCLES TURNING MOVEMENT COUNT - SUMMARY Counted by: VCU Intersection of: Redland Road Date: September 22, 2015 Tuesday and: Mill Run Drive Weather: Sunny/Warm Location: Montgomery County, Maryland Entered by: SN Star Rating: 5 TRAFFIC FROM NORTH TRAFFIC FROM SOUTH TRAFFIC FROM EAST TRAFFIC FROM WEST TOTAL on: Redland Road on: Redland Road on: on: Mill Run Drive N + S TIME + RIGHT THRU LEFT U-TN TOTAL RIGHT THRU LEFT U-TN TOTAL RIGHT THRU LEFT U-TN TOTAL RIGHT THRU LEFT U-TN TOTAL E + W AM 6:30-6: :45-7: :00-7: :15-7: :30-7: :45-8: :00-8: :15-8: :30-8: :45-9: :00-9: :15-9: Hr Totals Hr Totals 6:30-7: :45-7: :00-8: :15-8: :30-8: :45-8: :00-9: :15-9: :30-9: PEAK HOUR 7:15-8: PM 4:00-4: :15-4: :30-4: :45-5: :00-5: :15-5: :30-5: :45-6: :00-6: :15-6: :30-6: :45-7: Hr Totals Hr Totals 4:00-5: :15-5: :30-5: :45-5: :00-6: :15-6: :30-6: :45-6: :00-7: PEAK HOUR 5:15-6:
49 PEDESTRIAN OBSERVATIONS - SUMMARY TIME AM Counted by: VCU Intersection of: Redland Road Date: September 22, 2015 Tuesday and: Mill Run Drive Weather: Sunny/Warm Location: Montgomery County, Maryland Entered by: SN Star Rating: 5 6:30-6: :45-7: :00-7: :15-7: :30-7: :45-8: :00-8: :15-8: :30-8: :45-9: :00-9: :15-9: TOTALS PM NORTH LEG SOUTH LEG EAST LEG WEST LEG Redland Road Redland Road Mill Run Drive 4:00-4: :15-4: :30-4: :45-5: :00-5: :15-5: :30-5: :45-6: :00-6: :15-6: :30-6: :45-7: TOTALS

50 Redland Rd & Mill Run Dr 17
51 VEHICLES TURNING MOVEMENT COUNT - SUMMARY Counted by: VCU Intersection of: MD 115 Date: September 22, 2015 Tuesday and: Bowie Mill Road Weather: Sunny/Warm Location: Montgomery County, Maryland Entered by: SN Star Rating: 5 TRAFFIC FROM NORTH TRAFFIC FROM SOUTH TRAFFIC FROM EAST TRAFFIC FROM WEST TOTAL on: Bowie Mill Road on: on: MD 115 on: MD 115 N + S TIME + RIGHT THRU LEFT U-TN TOTAL RIGHT THRU LEFT U-TN TOTAL RIGHT THRU LEFT U-TN TOTAL RIGHT THRU LEFT U-TN TOTAL E + W AM 6:30-6: :45-7: :00-7: :15-7: :30-7: :45-8: :00-8: :15-8: :30-8: :45-9: :00-9: :15-9: Hr Totals Hr Totals 6:30-7: :45-7: :00-8: :15-8: :30-8: :45-8: :00-9: :15-9: :30-9: PEAK HOUR 7:45-8: PM 4:00-4: :15-4: :30-4: :45-5: :00-5: :15-5: :30-5: :45-6: :00-6: :15-6: :30-6: :45-7: Hr Totals Hr Totals 4:00-5: :15-5: :30-5: :45-5: :00-6: :15-6: :30-6: :45-6: :00-7: PEAK HOUR 4:15-5:
52 BICYCLES TURNING MOVEMENT COUNT - SUMMARY Counted by: VCU Intersection of: MD 115 Date: September 22, 2015 Tuesday and: Bowie Mill Road Weather: Sunny/Warm Location: Montgomery County, Maryland Entered by: SN Star Rating: 5 TRAFFIC FROM NORTH TRAFFIC FROM SOUTH TRAFFIC FROM EAST TRAFFIC FROM WEST TOTAL on: Bowie Mill Road on: on: MD 115 on: MD 115 N + S TIME + RIGHT THRU LEFT U-TN TOTAL RIGHT THRU LEFT U-TN TOTAL RIGHT THRU LEFT U-TN TOTAL RIGHT THRU LEFT U-TN TOTAL E + W AM 6:30-6: :45-7: :00-7: :15-7: :30-7: :45-8: :00-8: :15-8: :30-8: :45-9: :00-9: :15-9: Hr Totals Hr Totals 6:30-7: :45-7: :00-8: :15-8: :30-8: :45-8: :00-9: :15-9: :30-9: PEAK HOUR 7:45-8: PM 4:00-4: :15-4: :30-4: :45-5: :00-5: :15-5: :30-5: :45-6: :00-6: :15-6: :30-6: :45-7: Hr Totals Hr Totals 4:00-5: :15-5: :30-5: :45-5: :00-6: :15-6: :30-6: :45-6: :00-7: PEAK HOUR 4:15-5:

53 PEDESTRIAN OBSERVATIONS - SUMMARY TIME AM Counted by: VCU Intersection of: MD 115 Date: September 22, 2015 Tuesday and: Bowie Mill Road Weather: Sunny/Warm Location: Montgomery County, Maryland Entered by: SN Star Rating: 5 6:30-6: :45-7: :00-7: :15-7: :30-7: :45-8: :00-8: :15-8: :30-8: :45-9: :00-9: :15-9: TOTALS PM NORTH LEG SOUTH LEG EAST LEG WEST LEG Bowie Mill Road MD 115 MD 115 4:00-4: :15-4: :30-4: :45-5: :00-5: :15-5: :30-5: :45-6: :00-6: :15-6: :30-6: :45-7: TOTALS

54 MD 115 & Bowie Mill Rd 21
55 VEHICLES TURNING MOVEMENT COUNT - SUMMARY Counted by: VCU Intersection of: Redland Road Date: September 22, 2015 Tuesday and: Site Access Weather: Sunny/Warm Location: Montgomery County, Maryland Entered by: SN Star Rating: 5 TRAFFIC FROM NORTH TRAFFIC FROM SOUTH TRAFFIC FROM EAST TRAFFIC FROM WEST TOTAL on: Redland Road on: Redland Road on: on: Site Access N + S TIME + RIGHT THRU LEFT U-TN TOTAL RIGHT THRU LEFT U-TN TOTAL RIGHT THRU LEFT U-TN TOTAL RIGHT THRU LEFT U-TN TOTAL E + W AM 6:30-6: :45-7: :00-7: :15-7: :30-7: :45-8: :00-8: :15-8: :30-8: :45-9: :00-9: :15-9: Hr Totals Hr Totals 6:30-7: :45-7: :00-8: :15-8: :30-8: :45-8: :00-9: :15-9: :30-9: PEAK HOUR 7:30-8: PM 4:00-4: :15-4: :30-4: :45-5: :00-5: :15-5: :30-5: :45-6: :00-6: :15-6: :30-6: :45-7: Hr Totals Hr Totals 4:00-5: :15-5: :30-5: :45-5: :00-6: :15-6: :30-6: :45-6: :00-7: PEAK HOUR 5:00-6:
56 BICYCLES TURNING MOVEMENT COUNT - SUMMARY Counted by: VCU Intersection of: Redland Road Date: September 22, 2015 Tuesday and: Site Access Weather: Sunny/Warm Location: Montgomery County, Maryland Entered by: SN Star Rating: 5 TRAFFIC FROM NORTH TRAFFIC FROM SOUTH TRAFFIC FROM EAST TRAFFIC FROM WEST TOTAL on: Redland Road on: Redland Road on: on: Site Access N + S TIME + RIGHT THRU LEFT U-TN TOTAL RIGHT THRU LEFT U-TN TOTAL RIGHT THRU LEFT U-TN TOTAL RIGHT THRU LEFT U-TN TOTAL E + W AM 6:30-6: :45-7: :00-7: :15-7: :30-7: :45-8: :00-8: :15-8: :30-8: :45-9: :00-9: :15-9: Hr Totals Hr Totals 6:30-7: :45-7: :00-8: :15-8: :30-8: :45-8: :00-9: :15-9: :30-9: PEAK HOUR 7:30-8: PM 4:00-4: :15-4: :30-4: :45-5: :00-5: :15-5: :30-5: :45-6: :00-6: :15-6: :30-6: :45-7: Hr Totals Hr Totals 4:00-5: :15-5: :30-5: :45-5: :00-6: :15-6: :30-6: :45-6: :00-7: PEAK HOUR 5:00-6:
57 PEDESTRIAN OBSERVATIONS - SUMMARY TIME AM Counted by: VCU Intersection of: Redland Road Date: September 22, 2015 Tuesday and: Site Access Weather: Sunny/Warm Location: Montgomery County, Maryland Entered by: SN Star Rating: 5 6:30-6: :45-7: :00-7: :15-7: :30-7: :45-8: :00-8: :15-8: :30-8: :45-9: :00-9: :15-9: TOTALS PM NORTH LEG SOUTH LEG EAST LEG WEST LEG Redland Road Redland Road Site Access 4:00-4: :15-4: :30-4: :45-5: :00-5: :15-5: :30-5: :45-6: :00-6: :15-6: :30-6: :45-7: TOTALS

58 Redland & Site Access/Shop. Ctr. Access 25
59 APPENDIX B Intersection Capacity Analysis Worksheets
60 CRITICAL LANE VOLUME (CLV) METHODOLOGY for Montgomery County E/W Road: MD 115 Date of Count: 9/22/2015 N/S Road: Muncaster Road/Redland Road Day of Count: Tuesday Conditions: Existing Traffic Analyst: Richard Huang rh, \rev3\clv\1.xls-clv, f04/28/16 MUNCASTER ROAD Peak: 7:15-8:15 Peak: 5:00-6: PM AM R T L TR T L MD 115 TR R L T L AM PM PM AM L L T T T R R L T R MD 115 L T R AM PM REDLAND ROAD Capacity Analysis Morning Peak Hour Evening Peak Hour Thru Volumes + Opposing Lefts AM Thru Volumes + Opposing Lefts PM Dir VOL x LUF = Total VOL x LUF = Total CLV Dir VOL x LUF = Total VOL x LUF = Total CLV NB NB SB SB EB EB WB WB CLV TOTAL= 983 CLV TOTAL= 1,298 Scenario ID - EXIST1 1

61 CRITICAL LANE VOLUME (CLV) METHODOLOGY for Montgomery County E/W Road: MD 115 Date of Count: 9/22/2015 N/S Road: Muncaster Road/Redland Road Day of Count: Tuesday Conditions: Background Traffic Analyst: Richard Huang rh, \rev3\clv\1.xls-clv, f04/28/16 MUNCASTER ROAD Peak: 7:15-8:15 Peak: 5:00-6: PM AM R T L TR T L MD 115 TR R L T L AM PM PM AM L L T T T R R L T R MD 115 L T R AM PM REDLAND ROAD Capacity Analysis Morning Peak Hour Evening Peak Hour Thru Volumes + Opposing Lefts AM Thru Volumes + Opposing Lefts PM Dir VOL x LUF = Total VOL x LUF = Total CLV Dir VOL x LUF = Total VOL x LUF = Total CLV NB NB SB SB EB EB WB WB CLV TOTAL= 1,017 CLV TOTAL= 1,318 Scenario ID - BACK1 2
62 CRITICAL LANE VOLUME (CLV) METHODOLOGY for Montgomery County E/W Road: MD 115 Date of Count: 9/22/2015 N/S Road: Muncaster Road/Redland Road Day of Count: Tuesday Conditions: Total Traffic Analyst: Richard Huang rh, \rev3\clv\1.xls-clv, f05/06/16 MUNCASTER ROAD Peak: 7:15-8:15 Peak: 5:00-6: PM AM R T L TR T L MD 115 TR R L T L AM PM PM AM L L T T T R R L T R MD 115 L T R AM PM REDLAND ROAD Capacity Analysis Morning Peak Hour Evening Peak Hour Thru Volumes + Opposing Lefts AM Thru Volumes + Opposing Lefts PM Dir VOL x LUF = Total VOL x LUF = Total CLV Dir VOL x LUF = Total VOL x LUF = Total CLV NB NB SB SB EB EB WB WB CLV TOTAL= 1,025 CLV TOTAL= 1,328 3
63 CRITICAL LANE VOLUME (CLV) METHODOLOGY for Montgomery County E/W Road Name: Mill Run Drive Date of Count: 9/22/2015 N/S Road Name: Redland Road Day of Count: Tuesday Conditions: Existing Traffic Analyst: Richard Huang rh, \rev3\clv\2.xls-clv, f04/28/16 REDLAND ROAD AM Peak: 07:30-8:30 PM Peak: 04:00-5: PM AM R T MILL RUN DRIVE R T PM AM L R LR LT T L T AM PM REDLAND ROAD Capacity Analysis Morning Peak Hour Evening Peak Hour Thru Volumes + Opposing Lefts AM Thru Volumes + Opposing Lefts PM Dir VOL x LUF = Total VOL x LUF = Total CLV Dir VOL x LUF = Total VOL x LUF = Total CLV EB EB NB NB SB SB CLV TOTAL= 1,253 CLV TOTAL= 581 Scenario ID - EXIST2 4
64 CRITICAL LANE VOLUME (CLV) METHODOLOGY for Montgomery County E/W Road Name: Mill Run Drive Date of Count: 9/22/2015 N/S Road Name: Redland Road Day of Count: Tuesday Conditions: Background Traffic Analyst: Richard Huang rh, \rev3\clv\2.xls-clv, f04/28/16 REDLAND ROAD AM Peak: 07:30-8:30 PM Peak: 04:00-5: PM AM R T MILL RUN DRIVE R T PM AM L R LR LT T L T AM PM REDLAND ROAD Capacity Analysis Morning Peak Hour Evening Peak Hour Thru Volumes + Opposing Lefts AM Thru Volumes + Opposing Lefts PM Dir VOL x LUF = Total VOL x LUF = Total CLV Dir VOL x LUF = Total VOL x LUF = Total CLV EB EB NB NB SB SB CLV TOTAL= 1,253 CLV TOTAL= 581 Scenario ID - BACK2 5
65 CRITICAL LANE VOLUME (CLV) METHODOLOGY for Montgomery County E/W Road Name: Mill Run Drive Date of Count: 9/22/2015 N/S Road Name: Redland Road Day of Count: Tuesday Conditions: Total Traffic Analyst: Richard Huang rh, \rev3\clv\2.xls-clv, f05/06/16 REDLAND ROAD AM Peak: 07:30-8:30 PM Peak: 04:00-5: PM AM R T MILL RUN DRIVE R T PM AM L R LR LT T L T AM PM REDLAND ROAD Capacity Analysis Morning Peak Hour Evening Peak Hour Thru Volumes + Opposing Lefts AM Thru Volumes + Opposing Lefts PM Dir VOL x LUF = Total VOL x LUF = Total CLV Dir VOL x LUF = Total VOL x LUF = Total CLV EB EB NB NB SB SB CLV TOTAL= 1,253 CLV TOTAL= 581 6
66 CRITICAL LANE VOLUME (CLV) METHODOLOGY for Montgomery County E/W Road: MD 115 Date of Count: 9/22/2015 N/S Road: Bowie Mill Road Day of Count: Tuesday Conditions: Existing Traffic Analyst: Richard Huang rh, \rev3\clv\3.xls-clv, f04/28/16 BOWIE MILL ROAD Peak: 7:45-8:45 Peak: 4:15-5: PM AM R L R L MD 115 R R T T AM PM PM AM L L T T MD 115 Capacity Analysis Morning Peak Hour Evening Peak Hour Thru Volumes + Opposing Lefts AM Thru Volumes + Opposing Lefts PM Dir VOL x LUF = Total VOL x LUF = Total CLV Dir VOL x LUF = Total VOL x LUF = Total CLV SB SB EB EB WB WB CLV TOTAL= 1,248 CLV TOTAL= 1,099 Scenario ID - EXIST3 7
67 CRITICAL LANE VOLUME (CLV) METHODOLOGY for Montgomery County E/W Road: MD 115 Date of Count: 9/22/2015 N/S Road: Bowie Mill Road Day of Count: Tuesday Conditions: Background Traffic Analyst: Richard Huang rh, \rev3\clv\3.xls-clv, f04/28/16 BOWIE MILL ROAD Peak: 7:45-8:45 Peak: 4:15-5: PM AM R L R L MD 115 R R T T AM PM PM AM L L T T MD 115 Capacity Analysis Morning Peak Hour Evening Peak Hour Thru Volumes + Opposing Lefts AM Thru Volumes + Opposing Lefts PM Dir VOL x LUF = Total VOL x LUF = Total CLV Dir VOL x LUF = Total VOL x LUF = Total CLV SB SB EB EB WB WB CLV TOTAL= 1,271 CLV TOTAL= 1,145 Scenario ID - BACK3 8
68 CRITICAL LANE VOLUME (CLV) METHODOLOGY for Montgomery County E/W Road: MD 115 Date of Count: 9/22/2015 N/S Road: Bowie Mill Road Day of Count: Tuesday Conditions: Total Traffic Analyst: Richard Huang rh, \rev3\clv\3.xls-clv, f05/06/16 BOWIE MILL ROAD Peak: 7:45-8:45 Peak: 4:15-5: PM AM R L R L MD 115 R R T T AM PM PM AM L L T T MD 115 Capacity Analysis Morning Peak Hour Evening Peak Hour Thru Volumes + Opposing Lefts AM Thru Volumes + Opposing Lefts PM Dir VOL x LUF = Total VOL x LUF = Total CLV Dir VOL x LUF = Total VOL x LUF = Total CLV SB SB EB EB WB WB CLV TOTAL= 1,276 CLV TOTAL= 1,155 9
69 CRITICAL LANE VOLUME (CLV) METHODOLOGY for Montgomery County E/W Road: MD 115 Date of Count: N/S Road: Site Access 1 Day of Count: Conditions: Total Traffic Analyst: Richard Huang rh, \rev3\clv\4.xls-clv, f05/06/16 MD 115 T T L L 7 18 AM PM PM AM T T R TR MD 115 R L R AM 0 6 PM 0 19 SITE ACCESS 1 Capacity Analysis Morning Peak Hour Evening Peak Hour Thru Volumes + Opposing Lefts AM Thru Volumes + Opposing Lefts PM Dir VOL x LUF = Total VOL x LUF = Total CLV Dir VOL x LUF = Total VOL x LUF = Total CLV NB NB EB EB WB WB CLV TOTAL= 742 CLV TOTAL=
70 CRITICAL LANE VOLUME (CLV) METHODOLOGY for Montgomery County E/W Road: Site Access/Business Ent Date of Count: 9/22/2015 N/S Road: Redland Road Day of Count: Tuesday Conditions: Existing Traffic Analyst: Richard Huang rh, \rev3\clv\5.xls-eb, f04/28/16 REDLAND ROAD Peak: 7:30-8:30 Peak: 5:00-6: PM AM R T L R T L BUSINESS ENT R 0 0 T 0 0 L 0 0 AM PM PM AM L 0 0 T R LTR L T R SITE ACCESS L T R AM PM REDLAND ROAD Capacity Analysis Morning Peak Hour Evening Peak Hour Thru Volumes + Opposing Lefts AM Thru Volumes + Opposing Lefts PM Dir VOL x LUF = Total VOL x LUF = Total CLV Dir VOL x LUF = Total VOL x LUF = Total CLV NB NB SB SB EB EB WB WB CLV TOTAL= 1,232 CLV TOTAL=
71 CRITICAL LANE VOLUME (CLV) METHODOLOGY for Montgomery County E/W Road: Site Access/Business Ent Date of Count: 9/22/2015 N/S Road: Redland Road Day of Count: Tuesday Conditions: Background Traffic Analyst: Richard Huang rh, \rev3\clv\5.xls-eb, f04/28/16 REDLAND ROAD Peak: 7:30-8:30 Peak: 5:00-6: PM AM R T L R T L BUSINESS ENT R 0 0 T 0 0 L 0 0 AM PM PM AM L 0 0 T R LTR L T R SITE ACCESS L T R AM PM REDLAND ROAD Capacity Analysis Morning Peak Hour Evening Peak Hour Thru Volumes + Opposing Lefts AM Thru Volumes + Opposing Lefts PM Dir VOL x LUF = Total VOL x LUF = Total CLV Dir VOL x LUF = Total VOL x LUF = Total CLV NB NB SB SB EB EB WB WB CLV TOTAL= 1,232 CLV TOTAL=
72 CRITICAL LANE VOLUME (CLV) METHODOLOGY for Montgomery County E/W Road: Site Access Date of Count: 9/22/2015 N/S Road: Redland Road Day of Count: Tuesday Conditions: Total Traffic Analyst: Richard Huang rh, \rev3\clv\5.xls-clv, f05/06/16 REDLAND ROAD Peak: 7:30-8:30 Peak: 5:00-6: PM AM R T L R T L SITE ACCESS LTR R T 0 0 L 0 0 AM PM PM AM L 0 0 T R LTR L T R SITE ACCESS L T R AM PM REDLAND ROAD Capacity Analysis Morning Peak Hour Evening Peak Hour Thru Volumes + Opposing Lefts AM Thru Volumes + Opposing Lefts PM Dir VOL x LUF = Total VOL x LUF = Total CLV Dir VOL x LUF = Total VOL x LUF = Total CLV NB NB SB SB EB EB WB WB CLV TOTAL= 1,232 CLV TOTAL=

, veh/h 123 641 575 147 541 20 73 44 58 40 427 0 Signal Information Cycle, s")

, s 0.2 5.2 0.3 5.3 0.1 1.3 0.1 1.2 Phase Call Probability 0.97 1.00 0.")

73 HCS 2010 Signalized Intersection Results Summary General Information Intersection Information Agency The Traffic Group, Inc Duration, h 0.25 Analyst RH Analysis Date 10/1/2015 Area Type Other Jurisdiction Montgomery County Time Period Existing AM Peak PHF 0.93 Urban Street MD 115 Analysis Year 2015 Analysis Period 1> 7:00 Intersection MD 115 & Redland Rd File Name EA.xus Project Description CVS Derwood Demand Information EB WB NB SB Approach Movement L T R L T R L T R L T R Demand ( v ), veh/h Signal Information Cycle, s 98.1 Reference Phase 2 Offset, s 0 Reference Point End Uncoordinated Yes Simult. Gap E/W On Force Mode Fixed Simult. Gap N/S On Green Yellow Red Timer Results EBL EBT WBL WBT NBL NBT SBL SBT Assigned Phase Case Number Phase Duration, s Change Period, ( Y+R c ), s Max Allow Headway ( MAH ), s Queue Clearance Time ( g s ), s Green Extension Time ( g e ), s Phase Call Probability Max Out Probability Movement Group Results EB WB NB SB Approach Movement L T R L T R L T R L T R Assigned Movement Adjusted Flow Rate ( v ), veh/h Adjusted Saturation Flow Rate ( s ), veh/h/ln Queue Service Time ( g s ), s Cycle Queue Clearance Time ( g c ), s Green Ratio ( g/c ) Capacity ( c ), veh/h Volume-to-Capacity Ratio ( X ) Available Capacity ( c a ), veh/h Back of Queue ( Q ), veh/ln ( 95 th percentile) Queue Storage Ratio ( RQ ) ( 95 th percentile) Uniform Delay ( d 1 ), s/veh Incremental Delay ( d 2 ), s/veh Initial Queue Delay ( d 3 ), s/veh Control Delay ( d ), s/veh Level of Service (LOS) B B C D B C C C C D Approach Delay, s/veh / LOS 23.6 C 24.9 C 34.3 C 40.6 D Intersection Delay, s/veh / LOS 27.6 C Multimodal Results EB WB NB SB Pedestrian LOS Score / LOS 2.8 C 2.4 B 2.7 B 2.6 B Bicycle LOS Score / LOS 1.7 A 1.7 A 0.8 A 0.9 A Copyright 2015 University of Florida, All Rights Reserved. HCS 2010 Streets Version 6.70 Generated: 10/1/2015 2:00:26 PM 14
74 HCS 2010 Signalized Intersection Results Summary General Information Intersection Information Agency The Traffic Group, Inc Duration, h 0.25 Analyst RH Analysis Date 10/1/2015 Area Type Other Jurisdiction Montgomery County Time Period Existing PM Peak PHF 0.95 Urban Street MD 115 Analysis Year 2015 Analysis Period 1> 7:00 Intersection MD 115 & Redland Rd File Name EP.xus Project Description CVS Derwood Demand Information EB WB NB SB Approach Movement L T R L T R L T R L T R Demand ( v ), veh/h Signal Information Cycle, s Reference Phase 2 Offset, s 0 Reference Point End Uncoordinated Yes Simult. Gap E/W On Force Mode Fixed Simult. Gap N/S On Green Yellow Red Timer Results EBL EBT WBL WBT NBL NBT SBL SBT Assigned Phase Case Number Phase Duration, s Change Period, ( Y+R c ), s Max Allow Headway ( MAH ), s Queue Clearance Time ( g s ), s Green Extension Time ( g e ), s Phase Call Probability Max Out Probability Movement Group Results EB WB NB SB Approach Movement L T R L T R L T R L T R Assigned Movement Adjusted Flow Rate ( v ), veh/h Adjusted Saturation Flow Rate ( s ), veh/h/ln Queue Service Time ( g s ), s Cycle Queue Clearance Time ( g c ), s Green Ratio ( g/c ) Capacity ( c ), veh/h Volume-to-Capacity Ratio ( X ) Available Capacity ( c a ), veh/h Back of Queue ( Q ), veh/ln ( 95 th percentile) Queue Storage Ratio ( RQ ) ( 95 th percentile) Uniform Delay ( d 1 ), s/veh Incremental Delay ( d 2 ), s/veh Initial Queue Delay ( d 3 ), s/veh Control Delay ( d ), s/veh Level of Service (LOS) C C B E D D D C D D D Approach Delay, s/veh / LOS 22.8 C 41.7 D 39.5 D 53.1 D Intersection Delay, s/veh / LOS 34.6 C Multimodal Results EB WB NB SB Pedestrian LOS Score / LOS 2.8 C 2.4 B 2.7 B 2.6 B Bicycle LOS Score / LOS 1.4 A 1.8 A 1.9 A 0.6 A Copyright 2015 University of Florida, All Rights Reserved. HCS 2010 Streets Version 6.70 Generated: 10/1/2015 2:00:26 PM 15
75 HCS 2010 Signalized Intersection Results Summary General Information Intersection Information Agency The Traffic Group, Inc Duration, h 0.25 Analyst RH Analysis Date 10/1/2015 Area Type Other Jurisdiction Montgomery County Time Period Background AM Peak PHF 0.93 Urban Street MD 115 Analysis Year 2015 Analysis Period 1> 7:00 Intersection MD 115 & Redland Rd File Name BA.xus Project Description CVS Derwood Demand Information EB WB NB SB Approach Movement L T R L T R L T R L T R Demand ( v ), veh/h Signal Information Cycle, s 98.4 Reference Phase 2 Offset, s 0 Reference Point End Uncoordinated Yes Simult. Gap E/W On Force Mode Fixed Simult. Gap N/S On Green Yellow Red Timer Results EBL EBT WBL WBT NBL NBT SBL SBT Assigned Phase Case Number Phase Duration, s Change Period, ( Y+R c ), s Max Allow Headway ( MAH ), s Queue Clearance Time ( g s ), s Green Extension Time ( g e ), s Phase Call Probability Max Out Probability Movement Group Results EB WB NB SB Approach Movement L T R L T R L T R L T R Assigned Movement Adjusted Flow Rate ( v ), veh/h Adjusted Saturation Flow Rate ( s ), veh/h/ln Queue Service Time ( g s ), s Cycle Queue Clearance Time ( g c ), s Green Ratio ( g/c ) Capacity ( c ), veh/h Volume-to-Capacity Ratio ( X ) Available Capacity ( c a ), veh/h Back of Queue ( Q ), veh/ln ( 95 th percentile) Queue Storage Ratio ( RQ ) ( 95 th percentile) Uniform Delay ( d 1 ), s/veh Incremental Delay ( d 2 ), s/veh Initial Queue Delay ( d 3 ), s/veh Control Delay ( d ), s/veh Level of Service (LOS) B B C D C C C D C D Approach Delay, s/veh / LOS 23.7 C 25.3 C 34.4 C 40.7 D Intersection Delay, s/veh / LOS 27.7 C Multimodal Results EB WB NB SB Pedestrian LOS Score / LOS 2.8 C 2.4 B 2.7 B 2.6 B Bicycle LOS Score / LOS 1.7 A 1.8 A 0.8 A 0.9 A Copyright 2015 University of Florida, All Rights Reserved. HCS 2010 Streets Version 6.70 Generated: 10/1/ :19:26 PM
76 HCS 2010 Signalized Intersection Results Summary General Information Intersection Information Agency The Traffic Group, Inc Duration, h 0.25 Analyst RH Analysis Date 10/1/2015 Area Type Other Jurisdiction Montgomery County Time Period Background PM Peak PHF 0.95 Urban Street MD 115 Analysis Year 2015 Analysis Period 1> 7:00 Intersection MD 115 & Redland Rd File Name BP.xus Project Description CVS Derwood Demand Information EB WB NB SB Approach Movement L T R L T R L T R L T R Demand ( v ), veh/h Signal Information Cycle, s Reference Phase 2 Offset, s 0 Reference Point End Uncoordinated Yes Simult. Gap E/W On Force Mode Fixed Simult. Gap N/S On Green Yellow Red Timer Results EBL EBT WBL WBT NBL NBT SBL SBT Assigned Phase Case Number Phase Duration, s Change Period, ( Y+R c ), s Max Allow Headway ( MAH ), s Queue Clearance Time ( g s ), s Green Extension Time ( g e ), s Phase Call Probability Max Out Probability Movement Group Results EB WB NB SB Approach Movement L T R L T R L T R L T R Assigned Movement Adjusted Flow Rate ( v ), veh/h Adjusted Saturation Flow Rate ( s ), veh/h/ln Queue Service Time ( g s ), s Cycle Queue Clearance Time ( g c ), s Green Ratio ( g/c ) Capacity ( c ), veh/h Volume-to-Capacity Ratio ( X ) Available Capacity ( c a ), veh/h Back of Queue ( Q ), veh/ln ( 95 th percentile) Queue Storage Ratio ( RQ ) ( 95 th percentile) Uniform Delay ( d 1 ), s/veh Incremental Delay ( d 2 ), s/veh Initial Queue Delay ( d 3 ), s/veh Control Delay ( d ), s/veh Level of Service (LOS) C C B E D D D C D E E Approach Delay, s/veh / LOS 23.3 C 43.8 D 41.5 D 55.1 E Intersection Delay, s/veh / LOS 35.9 D Multimodal Results EB WB NB SB Pedestrian LOS Score / LOS 2.8 C 2.4 B 2.7 B 2.6 B Bicycle LOS Score / LOS 1.4 A 1.8 A 1.9 A 0.6 A Copyright 2015 University of Florida, All Rights Reserved. HCS 2010 Streets Version 6.70 Generated: 10/1/ :00:26 PM
77 HCS 2010 Signalized Intersection Results Summary General Information Intersection Information Agency The Traffic Group, Inc Duration, h 0.25 Analyst RH Analysis Date 10/1/2015 Area Type Other Jurisdiction Montgomery County Time Period Total AM Peak PHF 0.93 Urban Street MD 115 Analysis Year 2015 Analysis Period 1> 7:00 Intersection MD 115 & Redland Rd File Name TA.xus Project Description CVS Derwood Demand Information EB WB NB SB Approach Movement L T R L T R L T R L T R Demand ( v ), veh/h Signal Information Cycle, s Reference Phase 2 Offset, s 0 Reference Point End Uncoordinated Yes Simult. Gap E/W On Force Mode Fixed Simult. Gap N/S On Green Yellow Red Timer Results EBL EBT WBL WBT NBL NBT SBL SBT Assigned Phase Case Number Phase Duration, s Change Period, ( Y+R c ), s Max Allow Headway ( MAH ), s Queue Clearance Time ( g s ), s Green Extension Time ( g e ), s Phase Call Probability Max Out Probability Movement Group Results EB WB NB SB Approach Movement L T R L T R L T R L T R Assigned Movement Adjusted Flow Rate ( v ), veh/h Adjusted Saturation Flow Rate ( s ), veh/h/ln Queue Service Time ( g s ), s Cycle Queue Clearance Time ( g c ), s Green Ratio ( g/c ) Capacity ( c ), veh/h Volume-to-Capacity Ratio ( X ) Available Capacity ( c a ), veh/h Back of Queue ( Q ), veh/ln ( 95 th percentile) Queue Storage Ratio ( RQ ) ( 95 th percentile) Uniform Delay ( d 1 ), s/veh Incremental Delay ( d 2 ), s/veh Initial Queue Delay ( d 3 ), s/veh Control Delay ( d ), s/veh Level of Service (LOS) B B C D C C C D C D Approach Delay, s/veh / LOS 24.2 C 25.8 C 34.7 C 41.4 D Intersection Delay, s/veh / LOS 28.3 C Multimodal Results EB WB NB SB Pedestrian LOS Score / LOS 2.8 C 2.4 B 2.7 B 2.6 B Bicycle LOS Score / LOS 1.7 A 1.8 A 0.8 A 0.9 A Copyright 2016 University of Florida, All Rights Reserved. HCS 2010 Streets Version 6.70 Generated: 5/6/2016 3:28:50 PM 18
78 HCS 2010 Signalized Intersection Results Summary General Information Intersection Information Agency The Traffic Group, Inc Duration, h 0.25 Analyst RH Analysis Date 10/1/2015 Area Type Other Jurisdiction Montgomery County Time Period Total PM Peak PHF 0.95 Urban Street MD 115 Analysis Year 2015 Analysis Period 1> 7:00 Intersection MD 115 & Redland Rd File Name TP.xus Project Description CVS Derwood Demand Information EB WB NB SB Approach Movement L T R L T R L T R L T R Demand ( v ), veh/h Signal Information Cycle, s Reference Phase 2 Offset, s 0 Reference Point End Uncoordinated Yes Simult. Gap E/W On Force Mode Fixed Simult. Gap N/S On Green Yellow Red Timer Results EBL EBT WBL WBT NBL NBT SBL SBT Assigned Phase Case Number Phase Duration, s Change Period, ( Y+R c ), s Max Allow Headway ( MAH ), s Queue Clearance Time ( g s ), s Green Extension Time ( g e ), s Phase Call Probability Max Out Probability Movement Group Results EB WB NB SB Approach Movement L T R L T R L T R L T R Assigned Movement Adjusted Flow Rate ( v ), veh/h Adjusted Saturation Flow Rate ( s ), veh/h/ln Queue Service Time ( g s ), s Cycle Queue Clearance Time ( g c ), s Green Ratio ( g/c ) Capacity ( c ), veh/h Volume-to-Capacity Ratio ( X ) Available Capacity ( c a ), veh/h Back of Queue ( Q ), veh/ln ( 95 th percentile) Queue Storage Ratio ( RQ ) ( 95 th percentile) Uniform Delay ( d 1 ), s/veh Incremental Delay ( d 2 ), s/veh Initial Queue Delay ( d 3 ), s/veh Control Delay ( d ), s/veh Level of Service (LOS) C C C E D D D C D E E Approach Delay, s/veh / LOS 24.1 C 45.0 D 42.4 D 56.0 E Intersection Delay, s/veh / LOS 36.9 D Multimodal Results EB WB NB SB Pedestrian LOS Score / LOS 2.8 C 2.4 B 2.7 B 2.6 B Bicycle LOS Score / LOS 1.4 A 1.8 A 2.0 A 0.6 A Copyright 2016 University of Florida, All Rights Reserved. HCS 2010 Streets Version 6.70 Generated: 5/6/2016 3:30:49 PM 19
79 APPENDIX C Public Transportation & Pedestrian Facility Information


80 MD 115 & Redland Rd/Muncaster Rd North Leg Crosswalk South Leg Crosswalk East Leg Crosswalk West Leg Crosswalk North Leg East Sidewalk North Leg West Sidewalk 1


81 South Leg East Sidewalk South Leg West Sidewalk East Leg North Sidewalk East Leg South Sidewalk West Leg North Sidewalk West Leg South Sidewalk 2


82 Bus Stop Bus MD 115, West of Redland Rd Bus MD 115, West of Redland Rd Bus MD 115 Bus MD 115 Bus MD 115 Bus MD 115 3


83 4
84 Dr Rd Shady Grove Metro Station - MD 115 & Bowie Mill Rd - Gold Mine Rd - Lindenwood Dr - Montgomery General Hospital - Prince Phillip Dr - ICC Park & Ride Lot - Georgia Ave - Norbeck Rd - Glenmont Metro Station 53 Marian Assisted Living See inset 8 9 Briars Rd Old Baltimore Rd 6 Rd Marian Assisted Living Heritage Lindenwood Olney 11 Queen Elizabeth AM PM Laytonsville Rd Olney Mill Gold Mine Rd Montgomery General Hospital Dr St John s Ave 5 Rd 10 7 Headwaters Dr Rd Wickham Rd Georgia Ave Hills Dr 97 Please arrive at your stop several minutes ahead of your bus scheduled arrival. Since safe service is a priority at Ride On, buses may be delayed due to traffic or weather. Lindenwoo Dr D Elizabeth Queen Elizabeth Dr Brooke Grove ES Bowie Mill St Peter s Old Baltimore Rd Lindenwood Dr Prince Phillip Dr Brooke Farm Dr Georgia St John s Olney Post Office 12 Prince Phillip Dr Cashell Rd Bready Fraley Farm Rd Muncaster Rd Olney ES Montgomery General Hospital AM PM PM AM 2 Gaithersburg Washington Grove Co 28 Fire Station 108 Ln Rd Baltimore Rd 13 Hines Fogg y Redland MS Brimstone Academy Dr Cherry Valley Dr 115 Derwood Post Office Muncaster Mill Rd Old Sequoyah ES 97 Bus route Limited Service Emory Church Rd 3 Schedule 4 Timepoint Olde MIll Ru n Redland Rd Shady Grove Rd Washington Grove Sandy Spring Co 40 Fire Station Magruder HS Metrorail station Emory Ln NON-STOP EXPRESS VIA ICC Needwood Rd Candlewood ES Swim Center PM AM Batchell ors Forest Rd Georgia Ave Hospital Point of interest School Library Interstate highway Federal highway Metrorail line 115 Rail line and station Needwood Rd AM PM Legend Shady Grove ICC Park & Ride lot served by trips going toward Glenmont Metro in AM and trips going toward Olney/Shady Grove in PM Hospital 14 Point of interest Crabbs ICC Park & Ride Lot Bus route Certain trips Certain trips Express service Frederick Rd Layhill School Branch Wy Randolph Rd Glenmont 15 Norbeck Rd Library 355 Georgia Ave Route 53 travels as a non-stop express along Georgia Ave. between Norbeck Rd. and Glenmont Station Interstate highway 495 Federal highway 29 Portion of route not shown due to map scale. State highway 191 Schedule timepoint Metrorail station Metrorail line Rail line and station Amtrak station MARC station 3 Subject to change WELCOME TO RIDE ON RIDE ON is a community bus service operated by the Montgomery County Department of Transportation. RIDE ON operates over 75 routes that serve all thirteen Montgomery County Metrorail stations. For detailed information, or to have timetables mailed, call 311. Outside Montgomery County...(240) TTY (for hearing impaired) Visit our web site at: Real Time information is available at: Regular Mailing Address: Montgomery County DOT Division of Transit Services 101 Monroe Street, 5th Floor Rockville, MD HOLIDAY SCHEDULE New Year s Day...Sunday Schedule Martin Luther King, Jr. Day... Special Schedule Presidents Day... Special Schedule Memorial Day...Sunday Schedule Independence Day... Saturday Schedule Labor Day...Sunday Schedule Columbus Day...Weekday Schedule Veterans Day... Special Schedule Thanksgiving Day...Sunday Schedule Christmas Day...Sunday Schedule For special schedules, consult our website or call 311. Thank You for Riding with Us! Printed on recycled paper with soy-based ink EFFECTIVE: JANUARY 13, 2013 REPRINT: JANUARY 13, Approximate travel time between stops 7-9 mins Muncaster Mill & Redland Rds 4-6 mins Muncaster Mill & Bowie Mill Rds Magruder High School CERTAIN TRIPS 4-5 mins 1-5 mins Olney Mill Rd & MD mins Marian Assisted Living CERTAIN TRIPS 4-5 mins 3-4 mins 3-4 mins 3-5 mins AM PM ICC Park & Ride Lot Shady Grove Metro Station AM PM 4-5 mins Bowie Mill/ Cashell & Wickham Rds SERVICE DAYS MONDAY - FRIDAY AM PM 13 mins NON-STOP VIA ICC MD 108 & Georgia Ave 4-7 mins Gold Mine Rd & Heritage Hills Dr Montgomery General Hospital Lindenwood Dr & Old Baltimore Rd Old Baltimore Rd & MD 108 Georgia Ave & Prince Phillip Dr mins Glenmont Metro Station Telephone 311 Online at Real Time Info at 5
85 Shady Grove Metro Station (East) Muncaster Mill & Redland Rds Magruder High School ICC Glenmont Metro Station Georgia Ave & Prince Phillip Dr Old Baltimore Rd & MD 108 Park & Ride Lot Muncaster Mill & Bowie Mill Rds Bowie Mill/Cashell & Wickham Rds 53 To Glenmont Metro Station MONDAY THROUGH FRIDAY SEE TIMEPOINT LOCATION ON ROUTE MAP 53 To Shady Grove Metro Station MONDAY THROUGH FRIDAY SEE TIMEPOINT LOCATION ON ROUTE MAP Lindenwood Dr & Old Baltimore Rd MD 108 MD 108 & Georgia Ave Marian Olney Mill Rd & Marian Montgomery General Hospital Assisted Living Assisted Living Montgomery General Hospital Lindenwood Dr & Old Baltimore Rd Gold Mine Rd & Heritage Hills Dr Georgia Ave & MD 108 Olney Mill Rd & MD 108 Gold Mine Rd & Heritage Hills Dr Old Baltimore Rd & MD 108 Georgia Ave & Prince Phillip Dr ICC Magruder High School Muncaster Mill & Bowie Mill Rds Bowie Mill/Cashell & Wickham Rds Park & Ride Lot :20 5:33 5:38 5:43 5:47 5:50 5:54 5:58 6:08 5:50 6:03 6:07 6:09 6:14 6:18 6:21 6:25 6:29 6:39 6:20 6:34 6:39 6:44 6:48 6:51 6:55 7:00 7:11 6:50 7:04 7:08 7:10 7:15 7:19 7:22 7:26 7:31 7:42 7:25 7:39 7:44 7:49 7:53 7:57 8:01 8:06 8:18 8:00 8:14 8:19 8:24 8:28 8:31 8:35 8:40 8:51 8:35 8:49 8:54 8:59 9:03 9:06 9:10 9:14 9:25 3:43 3:51 3:56 3:57 4:02 4:05 4:09 4:13 4:15 4:20 4:24 4:27 4:31 4:43 4:13 4:22 4:25 4:31 4:35 4:39 4:44 4:49 4:53 4:57 5:01 5:15 4:43 4:52 4:55 5:01 5:05 5:09 5:14 5:19 5:23 5:27 5:31 5:45 5:13 5:22 5:25 5:31 5:35 5:39 5:44 5:49 5:53 5:57 6:01 6:15 5:43 5:52 5:55 6:01 6:05 6:09 6:14 6:19 6:23 6:27 6:31 6:45 6:13 6:22 6:25 6:31 6:35 6:39 6:44 6:49 6:53 6:57 7:01 7:15 6:48 6:56 6:59 7:04 7:08 7:12 7:17 7:22 7:26 7:29 7:33 7:46 7:25 7:33 7:36 7:41 7:45 7:49 7:54 7:59 8:03 8:06 8:10 8:23 AM PM Muncaster Mill & Redland Rds Shady Grove Metro Station (East) :15 5:27 5:31 5:35 5:39 5:45 5:49 5:50 5:56 6:02 6:07 6:15 5:45 5:57 6:01 6:05 6:09 6:15 6:19 6:20 6:26 6:32 6:37 6:45 6:15 6:28 6:32 6:36 6:40 6:47 6:49 6:53 6:54 7:00 7:07 7:13 7:22 6:45 6:58 7:02 7:06 7:10 7:17 7:21 7:22 7:28 7:35 7:41 7:50 7:20 7:33 7:37 7:41 7:45 7:52 7:54 7:58 7:59 8:05 8:12 8:18 8:27 7:50 8:03 8:07 8:11 8:15 8:22 8:26 8:27 8:33 8:40 8:46 8:55 8:15 8:27 8:31 8:35 8:39 8:45 8:49 8:50 8:56 9:02 9:07 9:15 3:51 3:57 4:06 3:40 3:51 3:56 4:00 4:04 4:08 4:15 4:17 4:21 4:34 4:13 4:24 4:29 4:33 4:37 4:41 4:48 4:52 5:05 4:43 4:54 5:00 5:04 5:09 5:13 5:20 5:24 5:38 5:13 5:24 5:30 5:34 5:39 5:43 5:50 5:54 6:08 5:45 5:56 6:02 6:06 6:10 6:14 6:20 6:24 6:37 6:15 6:26 6:32 6:36 6:40 6:44 6:50 6:54 7:07 6:45 6:56 7:01 7:05 7:09 7:13 7:19 7:23 7:36 7:15 7:26 7:31 7:35 7:39 7:43 7:49 7:53 8:06 AM PM Glenmont Metro Station HOW TO RIDE A BUS Check schedule for timepoint nearest your location. Wait at the blue and white RIDE ON bus stop sign. Arrive several minutes before scheduled time. Have exact fare ready (drivers do not make change). Not all stops are listed on a public timetable. If you are unfamiliar with your stop, sit or stand behind the line near the front of the bus and ask the bus driver to notify you when your stop is approaching. Ask the bus driver if you are not sure if the bus goes to your stop. If you have internet access (at home or somewhere else, such as a public library), it may be easier for you to use an online trip planner rather than a paper timetable. Be mindful of changes in the schedule, for holidays or bad weather. Please observe the following rules for all patrons: No eating, drinking, or smoking. Electronic devices may be played with earphones set at low level. HOW TO READ A TIMETABLE Find the schedule for the day of the week and the direction you wish to ride. Find the timepoints closest to your origin and destination. The timepoints are shown on the route map and indicate the time the bus is scheduled to be at the particular location. Your nearest bus stop may be between timepoints. Read down the column to see the times when a trip will be at the given timepoint. Read the times across to the right to see when the trip reaches other timepoints. If no time is shown, that trip does not serve that timepoint. There is NO Saturday or Sunday service on this route FARES Regular Fare or Token $1.80 Fare Using SmarTrip $1.60 Seniors and persons with disability with valid ID (including attendant-eligible) except during free periods: Cash $0.90 Senior/Disabled SmarTrip $0.80 Senior/Disabled SmarTrip Transfer from Metrorail $0.30 Seniors age 65 years or older with a Senior SmarTrip card or valid Metro Senior ID Card or with valid Medicare Card and Photo ID from FREE 9:30AM - 3PM Mon - Fri Person with disability with Metro Disabled Identification Card from 9:30AM - 3PM Mon - Fri FREE Person with disability with Metro Disability ID Card - Attendant Eligible from 9:30AM - 3PM Mon-Fri Attendant rides half fare or free depending on time MetroAccess - Certified Customer with ID MetroAccess - Companion Children under age 5 Limit 2 children per paying passenger Local Bus Transfer with SmarTrip Children 5 to 18 with a student ID Monday - Friday, 2-7 pm GUARANTEED RIDE HOME FREE FREE FREE FREE FREE When you take Metrobus, Metrorail and Ride On to work, you are eligible to participate in the free Commuter Connections Guaranteed Ride Home Program. To register and to receive program details call: Commuter Services at POOL(7665). METROACCESS Alternative paratransit service to this Ride On route for people with certified disabilities is available. Call MetroAccess at
86 57 To Shady Grove Metro Station 57 To Lakeforest Transit Center MONDAY THROUGH FRIDAY MONDAY THROUGH FRIDAY SEE TIMEPOINT LOCATION ON ROUTE MAP SEE TIMEPOINT LOCATION ON ROUTE MAP Lakeforest Transit Center Summit & Diamond Aves MD 124 & Emory Grove Rd MD 115 & Redland Rd Shady Grove Metro Station (West) Shady Grove Metro Station (West) MD 115 & Redland Rd MD 124 & Emory Grove Rd Summit & Diamond Aves Lakeforest Transit Center :45 4:50 4:56 5:03 5:12 5:02 5:10 5:16 5:22 5:28 5:10 5:15 5:21 5:28 5:37 5:32 5:40 5:46 5:52 5:58 5:35 5:40 5:46 5:53 6:02 6:02 6:11 6:19 6:26 6:34 6:00 6:05 6:11 6:19 6:29 6:32 6:41 6:49 6:56 7:04 6:20 6:25 6:31 6:39 6:49 7:02 7:11 7:19 7:26 7:34 6:35 6:40 6:46 6:54 7:04 7:32 7:41 7:49 7:57 8:06 6:50 6:56 7:03 7:12 7:23 8:02 8:11 8:19 8:27 8:36 7:08 7:14 7:21 7:30 7:41 8:32 8:41 8:49 8:57 9:06 7:28 7:34 7:41 7:50 8:01 8:57 9:06 9:14 9:22 9:31 7:48 7:54 8:01 8:10 8:21 9:22 9:31 9:39 9:47 9:55 8:08 8:14 8:21 8:32 8:44 9:47 9:56 10:04 10:12 10:20 8:28 8:34 8:41 8:52 9:04 10:12 10:21 10:29 10:37 10:45 8:48 8:53 8:59 9:08 9:18 10:37 10:46 10:54 11:01 11:08 9:08 9:13 9:19 9:28 9:38 11:02 11:11 11:19 11:26 11:33 9:28 9:33 9:39 9:48 9:58 11:22 11:31 11:39 11:46 11:53 9:48 9:53 9:59 10:08 10:18 11:42 11:51 11:59 12:06 12:13 10:08 10:13 10:19 10:28 10:38 12:02 12:11 12:19 12:26 12:33 10:28 10:33 10:39 10:48 10:58 12:22 12:31 12:39 12:46 12:53 10:48 10:53 10:59 11:08 11:17 12:42 12:51 12:59 1:06 1:13 11:08 11:13 11:19 11:28 11:37 1:02 1:11 1:19 1:26 1:33 11:28 11:33 11:39 11:48 11:57 1:22 1:31 1:39 1:46 1:53 11:48 11:53 11:59 12:08 12:17 1:42 1:51 1:59 2:06 2:13 12:08 12:13 12:19 12:28 12:37 2:02 2:11 2:19 2:26 2:33 12:28 12:33 12:39 12:48 12:57 2:22 2:31 2:39 2:46 2:53 12:48 12:53 12:59 1:08 1:17 2:42 2:51 2:59 3:06 3:14 1:08 1:13 1:19 1:28 1:37 3:02 3:11 3:19 3:26 3:34 1:28 1:33 1:39 1:48 1:57 3:22 3:31 3:39 3:46 3:54 1:48 1:53 1:59 2:08 2:17 3:42 3:51 3:59 4:06 4:14 2:08 2:13 2:19 2:28 2:37 4:02 4:11 4:19 4:26 4:34 2:28 2:33 2:39 2:48 2:57 4:22 4:31 4:39 4:46 4:54 2:53 2:59 3:07 3:16 3:25 4:42 4:51 4:59 5:06 5:14 3:18 3:24 3:32 3:41 3:50 5:02 5:11 5:19 5:26 5:34 3:43 3:49 3:57 4:06 4:15 5:22 5:32 5:40 5:47 5:55 4:08 4:14 4:22 4:31 4:40 5:42 5:52 6:00 6:07 6:15 4:33 4:39 4:47 4:56 5:05 6:02 6:12 6:20 6:27 6:35 4:58 5:04 5:12 5:21 5:30 6:22 6:32 6:40 6:47 6:55 5:23 5:29 5:38 5:47 5:56 6:42 6:52 7:00 7:07 7:15 5:48 5:54 6:03 6:12 6:21 7:07 7:17 7:25 7:32 7:40 6:13 6:18 6:25 6:33 6:41 7:32 7:40 7:48 7:55 8:03 6:38 6:43 6:50 6:58 7:06 8:02 8:10 8:18 8:25 8:33 7:03 7:08 7:15 7:23 7:31 8:32 8:40 8:48 8:55 9:03 7:33 7:38 7:45 7:53 8:01 9:02 9:09 9:15 9:22 9:29 8:03 8:08 8:13 8:19 8:27 9:32 9:39 9:45 9:52 9:59 8:33 8:38 8:43 8:49 8:57 10:02 10:09 10:15 10:22 10:29 9:03 9:08 9:13 9:19 9:27 10:32 10:39 10:45 10:52 10:59 9:33 9:38 9:43 9:49 9:57 11:02 11:09 11:15 11:22 11:29 10:03 10:08 10:13 10:19 10:27 11:32 11:39 11:45 11:52 11:59 10:33 10:37 10:42 10:48 10:55 12:02 12:09 12:15 12:22 12:29 11:03 11:07 11:12 11:18 11:25 NOTES: AM PM 11:33 11:37 11:42 11:48 11:55 NOTES: AM PM 57 To Shady Grove Metro Station 57 To Lakeforest Transit Center SATURDAY SATURDAY SEE TIMEPOINT LOCATION ON ROUTE MAP SEE TIMEPOINT LOCATION ON ROUTE MAP Lakeforest Transit Center Summit & Diamond Aves MD 124 & Emory Grove Rd MD 115 & Redland Rd Shady Grove Metro Station (West) Shady Grove Metro Station (West) MD 115 & Redland Rd MD 124 & Emory Grove Rd Summit & Diamond Aves Lakeforest Transit Center :30 5:34 5:40 5:47 5:56 6:02 6:10 6:16 6:22 6:27 6:00 6:04 6:10 6:17 6:26 6:32 6:40 6:46 6:52 6:57 6:30 6:34 6:40 6:47 6:56 7:02 7:10 7:17 7:23 7:29 7:00 7:05 7:11 7:18 7:27 7:32 7:40 7:47 7:53 7:59 7:30 7:35 7:41 7:48 7:57 8:02 8:10 8:17 8:23 8:29 8:00 8:05 8:11 8:18 8:27 8:32 8:40 8:47 8:53 8:59 8:30 8:35 8:41 8:48 8:57 9:02 9:10 9:17 9:23 9:29 9:00 9:05 9:11 9:18 9:27 9:32 9:40 9:47 9:53 9:59 9:30 9:35 9:41 9:48 9:57 10:02 10:10 10:17 10:23 10:29 10:00 10:05 10:11 10:20 10:29 10:32 10:41 10:48 10:55 11:01 10:25 10:30 10:36 10:45 10:54 10:57 11:06 11:13 11:20 11:26 10:48 10:53 10:59 11:08 11:17 11:22 11:31 11:38 11:45 11:51 11:08 11:13 11:19 11:28 11:37 11:42 11:51 11:58 12:05 12:11 11:28 11:33 11:39 11:48 11:57 12:02 12:11 12:18 12:25 12:31 11:48 11:53 11:59 12:08 12:17 12:22 12:31 12:38 12:45 12:51 12:08 12:13 12:19 12:28 12:37 12:42 12:51 12:58 1:05 1:11 12:28 12:33 12:39 12:48 12:57 1:02 1:11 1:18 1:25 1:31 12:48 12:53 12:59 1:08 1:17 1:22 1:31 1:38 1:45 1:51 1:08 1:13 1:19 1:28 1:37 1:42 1:51 1:58 2:05 2:11 1:28 1:33 1:39 1:48 1:57 2:02 2:11 2:18 2:25 2:31 1:48 1:53 1:59 2:08 2:17 2:22 2:31 2:38 2:45 2:51 2:08 2:13 2:19 2:28 2:37 2:42 2:51 2:58 3:05 3:11 2:28 2:33 2:39 2:48 2:57 3:02 3:11 3:18 3:25 3:31 2:48 2:53 2:59 3:08 3:17 3:22 3:31 3:38 3:45 3:51 3:08 3:13 3:19 3:28 3:37 3:42 3:51 3:58 4:05 4:11 3:28 3:33 3:39 3:48 3:57 4:02 4:11 4:18 4:25 4:31 3:48 3:53 3:59 4:08 4:17 4:22 4:31 4:38 4:45 4:51 4:08 4:13 4:19 4:28 4:37 4:42 4:51 4:58 5:05 5:11 4:28 4:33 4:39 4:48 4:57 5:02 5:11 5:18 5:25 5:31 4:48 4:53 4:59 5:08 5:17 5:22 5:30 5:37 5:44 5:50 5:08 5:13 5:19 5:28 5:37 5:42 5:50 5:57 6:04 6:10 5:28 5:33 5:39 5:47 5:55 6:02 6:10 6:17 6:24 6:30 5:48 5:53 5:59 6:07 6:15 6:22 6:30 6:37 6:44 6:50 6:13 6:18 6:24 6:32 6:40 6:42 6:50 6:57 7:04 7:10 6:38 6:43 6:48 6:55 7:03 7:07 7:15 7:22 7:29 7:35 7:03 7:08 7:13 7:20 7:28 7:32 7:40 7:47 7:54 8:00 7:33 7:38 7:43 7:50 7:58 8:02 8:10 8:17 8:24 8:30 8:03 8:08 8:13 8:20 8:28 8:32 8:39 8:45 8:51 8:57 8:33 8:38 8:43 8:50 8:58 9:02 9:09 9:15 9:21 9:27 9:03 9:07 9:12 9:18 9:25 9:32 9:39 9:45 9:51 9:57 9:33 9:37 9:42 9:48 9:55 10:02 10:09 10:15 10:21 10:27 10:03 10:07 10:12 10:18 10:25 10:32 10:39 10:45 10:51 10:57 10:33 10:37 10:42 10:48 10:55 11:02 11:09 11:15 11:21 11:27 11:03 11:07 11:12 11:18 11:25 NOTES: AM PM NOTES: AM PM SEE REVERSE FOR SUNDAY SERVICE SEE REVERSE FOR SUNDAY SERVICE Please arrive at your stop several minutes ahead of your bus scheduled arrival. Since safe service is a priority at Ride On, buses may be delayed due to traffic or weather. HOW TO READ A TIMETABLE Find the schedule for the day of the week and the direction you wish to ride. Find the timepoints closest to your origin and destination. The timepoints are shown on the route map and indicate the time the bus is scheduled to be at the particular location. Your nearest bus stop may be between timepoints. Read down the column to see the times when a trip will be at the given timepoint. Read the times across to the right to see when the trip reaches other timepoints. If no time is shown, that trip does not serve that timepoint. METROACCESS Alternative paratransit service to this Ride On route for people with certified disabilities is available. Call MetroAccess at GUARANTEED RIDE HOME When you take Metrobus, Metrorail and Ride On to work, you are eligible to participate in the free Commuter Connections Guaranteed Ride Home Program. To register and to receive program details call: Commuter Services at POOL(7665). 7
87 Redland 57 Shady 355 Gaithersburg Library Muddy Branch Rd A ve Lakeforest Mall Montgomery Village Lakeforest Transit Center/ Park & Ride Gaithersburg Square Shopping center Legend 3 1 Russell Maryland Ave Lakeforest Transit Center Old Town Gaithersburg Washington Grove Emory Grove Redland Rd Grove Metro Station LAKEFOREST Lost Knife Ave Odenhal Ave Ave Walker Ave 124 Brookes Ave Summit Goshen Rd Ave Gaithersburg Gaithersburg Post Office Gaithersburg City Call Gaithersburg HS Bus route Certain trips Certain trips Express service Schedule timepoint Metrorail station Metrorail line Rail line and station Amtrak station MARC station Subject to change South Lake ES Montgomery Village Plaza The Summit Shopping Center GAITHERSBURG Girard Gaithersburg ES Gaithersburg MS 370 Hospital E Diamond St Frederick Ave Ave W Deer Park Point of interest School Library Interstate highway Federal highway 191 State highway 355 Emory Grove Flower Rd Midcounty Hwy Washington Hill Grove Ln Railroad St Oakmont Ave Sam Eig Hwy Center St Oak St Frederick Rd Wy Flower Hill ES Woodfield Longview 124 School Upper County Community Center/ Pool 3 Amity Dr Washington Grove Post Office Washington Grove WASHINGTON GROVE 370 Shady Grove Shady Grove 5 Rd Rd Mineral Springs Rd Spiceberry Ln Flower Hill Center Shady Grove MS Route 124 Plaza Laytonia Muncaster Redland Rd Crabbs Branch Wy Dr Mill Miller Briardale Rd Fall Gaithersburg Washinton Grove Co 28 Fire Station Mill Creek Towne ES Shady Grove Rd Rd Rd Founders Mill D r Needwood Airpark 4 Rd REDLAND Nedham Derwood Post Office Candlewood ES Rd Rd 57 To Shady Grove Metro Station SUNDAY SEE TIMEPOINT LOCATION ON ROUTE MAP Lakeforest Transit Center Summit & Diamond Aves MD 124 & Emory Grove Rd MD 115 & Redland Rd Shady Grove Metro Station (West) :00 7:04 7:09 7:16 7:25 7:30 7:34 7:39 7:46 7:55 8:00 8:04 8:09 8:16 8:25 8:30 8:35 8:40 8:47 8:56 9:00 9:05 9:10 9:17 9:26 9:30 9:35 9:40 9:47 9:56 9:57 10:02 10:07 10:14 10:23 10:22 10:27 10:32 10:39 10:48 10:47 10:52 10:57 11:04 11:13 11:12 11:17 11:23 11:31 11:40 11:37 11:42 11:48 11:56 12:05 12:02 12:07 12:13 12:21 12:30 12:27 12:32 12:38 12:46 12:55 12:52 12:57 1:03 1:11 1:20 1:17 1:22 1:28 1:36 1:45 1:42 1:47 1:53 2:01 2:10 2:07 2:12 2:18 2:26 2:35 2:32 2:37 2:43 2:51 3:00 2:57 3:02 3:08 3:16 3:25 3:22 3:27 3:33 3:41 3:50 3:47 3:52 3:58 4:06 4:15 4:12 4:17 4:23 4:31 4:40 4:37 4:42 4:48 4:56 5:05 5:02 5:07 5:13 5:21 5:30 5:27 5:32 5:37 5:44 5:52 5:52 5:57 6:02 6:09 6:17 6:17 6:22 6:27 6:34 6:42 6:42 6:46 6:51 6:57 7:04 7:07 7:11 7:16 7:22 7:29 7:33 7:37 7:42 7:48 7:55 8:03 8:07 8:12 8:18 8:25 8:33 8:37 8:42 8:48 8:55 9:03 9:07 9:12 9:18 9:25 NOTES: AM PM Please arrive at your stop several minutes ahead of your bus scheduled arrival. Since safe service is a priority at Ride On, buses may be delayed due to traffic or weather. Shady Grove Metro Station (West) 57 To Lakeforest Transit Center SUNDAY SEE TIMEPOINT LOCATION ON ROUTE MAP MD 115 & Redland Rd MD 124 & Emory Grove Rd Summit & Diamond Aves Lakeforest Transit Center :02 7:10 7:16 7:21 7:26 7:32 7:40 7:46 7:51 7:56 8:02 8:10 8:17 8:23 8:29 8:32 8:40 8:47 8:53 8:59 9:02 9:10 9:17 9:23 9:29 9:32 9:40 9:47 9:53 9:59 10:02 10:10 10:17 10:23 10:29 10:32 10:40 10:47 10:53 10:59 10:57 11:05 11:12 11:18 11:24 11:22 11:31 11:38 11:44 11:50 11:47 11:56 12:03 12:09 12:15 12:12 12:21 12:28 12:34 12:40 12:37 12:46 12:53 12:59 1:05 1:02 1:11 1:18 1:24 1:30 1:27 1:36 1:43 1:49 1:55 1:52 2:01 2:08 2:14 2:20 2:17 2:26 2:33 2:39 2:45 2:42 2:51 2:58 3:04 3:10 3:07 3:16 3:23 3:29 3:35 3:32 3:41 3:48 3:54 4:00 3:57 4:06 4:13 4:19 4:25 4:22 4:31 4:38 4:44 4:50 4:47 4:56 5:03 5:09 5:15 5:12 5:20 5:26 5:32 5:38 5:37 5:45 5:51 5:57 6:03 6:02 6:10 6:16 6:22 6:28 6:32 6:39 6:45 6:51 6:56 7:02 7:09 7:15 7:21 7:26 7:32 7:39 7:45 7:51 7:56 8:02 8:09 8:15 8:21 8:26 8:32 8:39 8:45 8:51 8:56 9:02 9:09 9:15 9:21 9:26 NOTES: AM PM FARES Regular Fare or Token $1.70 Fare Using SmarTrip $1.50 Seniors and persons with disability with valid ID (including attendant-eligible) except during free periods: Cash $0.85 Senior/Disabled SmarTrip $0.75 Senior/Disabled SmarTrip Transfer from Metrorail $0.25 Seniors age 65 years or older with a Senior SmarTrip card or valid Metro Senior ID Card or with valid Medicare Card and Photo ID from FREE 9:30AM - 3PM Mon - Fri Person with disability with Metro Disabled Identification Card from 9:30AM - 3PM Mon - Fri FREE Person with disability with Metro Disability ID Card - Attendant Eligible from 9:30AM - 3PM Mon-Fri Attendant rides half fare or free depending on time MetroAccess - Certified Customer with ID MetroAccess - Companion Children under age 5 Limit 2 children per paying passenger Local Bus Transfer with SmarTrip FREE FREE FREE FREE HOW TO RIDE A BUS Check schedule for timepoint nearest your location. Wait at the blue and white RIDE ON bus stop sign. Arrive several minutes before scheduled time. Have exact fare ready (drivers do not make change). Not all stops are listed on a public timetable. If you are unfamiliar with your stop, sit or stand behind the line near the front of the bus and ask the bus driver to notify you when your stop is approaching. Ask the bus driver if you are not sure if the bus goes to your stop. If you have internet access (at home or somewhere else, such as a public library), it may be easier for you to use an online trip planner rather than a paper timetable. Be mindful of changes in the schedule, for holidays or bad weather. Please observe the following rules for all patrons: No eating, drinking, or smoking. Electronic devices may be played with earphones set at low level. WELCOME TO RIDE ON RIDE ON is a community bus service operated by the Montgomery County Department of Transportation. RIDE ON operates over 75 routes that serve all thirteen Montgomery County Metrorail stations. For detailed information, or to have timetables mailed, call 311. Outside Montgomery County...(240) TTY (for hearing impaired)... (240) Visit our web site at: Real Time information is available at: Regular Mailing Address: Montgomery County DOT Division of Transit Services 101 Monroe Street, 5th Floor Rockville, MD HOLIDAY SCHEDULE New Year s Day...Sunday Schedule Martin Luther King, Jr. Day... Special Schedule Presidents Day... Special Schedule Memorial Day...Sunday Schedule Independence Day... Saturday Schedule Labor Day...Sunday Schedule Columbus Day...Weekday Schedule Veterans Day... Special Schedule Thanksgiving Day...Sunday Schedule Christmas Day...Sunday Schedule For special schedules, consult our website or call 311. Thank You for Riding with Us! Printed on recycled paper with soy-based ink EFFECTIVE: MAY 20, 2012 CORRECTED: JUNE 15, Approximate travel time between stops 4-8 mins 5-9 mins 5-10 mins 5-10 mins Lakeforest Transit Center Summit & Diamond Aves Shady Grove Metro Station SERVICE DAYS DAILY MD 124 & Emory Grove Rd MD 115 & Redland Rd Telephone 311 Online at 8 Real Time Info at


88 9
WEBER ROAD RESIDENTIAL DEVELOPMENT Single Family Residential Project
 WEBER ROAD RESIDENTIAL DEVELOPMENT Single Family Residential Project WEBER ROAD RESIDENTIAL DEVELOPMENT TRAFFIC IMPACT STUDY TABLE OF CONTENTS 1.0 Executive Summary Page 2.0 Introduction 2.1 DEVELOPMENT
JEP John E. Jack Pflum, P.E. Consulting Engineering 7541 Hosbrook Road, Cincinnati, OH Telephone:
 JEP John E. Jack Pflum, P.E. Consulting Engineering 7541 Hosbrook Road, Cincinnati, OH 45243 Email: jackpflum1@gmail.com Telephone: 513.919.7814 MEMORANDUM REPORT Traffic Impact Analysis Proposed Soccer
Traffic Impact Study
 Traffic Impact Study Statham DRI One University Parkway Prepared for: Barrow County Prepared by: October 2012 Table of Contents Executive Summary i Section 1. Introduction 1 Project Description 1 Methodology
Market Street PDP. Nassau County, Florida. Transportation Impact Analysis. VHB/Vanasse Hangen Brustlin, Inc. Nassau County Growth Management
 Transportation Impact Analysis Market Street PDP Nassau County, Florida Submitted to Nassau County Growth Management Prepared for TerraPointe Services, Inc. Prepared by VHB/Vanasse Hangen Brustlin, Inc.
April 10, Mr. Curt Van De Walle, City Manager City of Castle Hills 209 Lemonwood Drive Castle Hills, Texas 78213
 Mr. Curt Van De Walle, City Manager City of Castle Hills 209 Lemonwood Drive Castle Hills, Texas 78213 Subject: Revised Castle Hills BASIS Charter School Traffic Impact Analysis Review City of Castle Hills,
PLAZA MEXICO RESIDENCES
 PLAZA MEXICO RESIDENCES TRAFFIC STUDY PREPARED FOR: 3000 E. IMPERIAL, LLC. 6940 Beach Boulevard, D-501 Buena Park, California 90621 PREPARED BY: OCTOBER 5, 2017 translutions the transportatio n solutions
NATHAN HALE HIGH SCHOOL PARKING AND TRAFFIC ANALYSIS. Table of Contents
 Parking and Traffic Analysis Seattle, WA Prepared for: URS Corporation 1501 4th Avenue, Suite 1400 Seattle, WA 98101-1616 Prepared by: Mirai Transportation Planning & Engineering 11410 NE 122nd Way, Suite
MEMORANDUM. The study area of the analysis was discussed with City staff and includes the following intersections:
 MEMORANDUM DATE: JULY 6, 2012 TO: FROM: RE: CC: MELANIE KNIGHT BRAD BYVELDS/ JENNIFER LUONG 1050 SOMERSET STREET PRELIMINARY TRAFFIC ANALYSIS OUR FILE NO. 111152 NEIL MALHOTRA The purpose of this memo
TRAFFIC IMPACT STUDY. Platte Canyon Villas Arapahoe County, Colorado (Arapahoe County Case Number: Z16-001) For
 For") TRAFFIC IMPACT STUDY For Platte Canyon Villas Arapahoe County, Colorado (Arapahoe County Case Number: Z16-001) February 2015 Revised: August 2015 April 2016 July 2016 September 2016 Prepared for: KB Home
TRAFFIC IMPACT STUDY For Platte Canyon Villas Arapahoe County, Colorado (Arapahoe County Case Number: Z16-001) February 2015 Revised: August 2015 April 2016 July 2016 September 2016 Prepared for: KB Home
Focused Traffic Analysis for the One Lincoln Park Project
 September 15, 2015 Mr. Bill Johnson Coldwell Banker 511 Sir Francis Drake Boulevard Greenbrae, CA 94904 Focused Traffic Analysis for the One Lincoln Park Project Dear Mr. Johnson; As requested, W-Trans
HALFF 16196? TRAFFIC MANAGEMENT PLAN. Richardson ISD Aikin Elementary School Dallas, Texas North Bowser Road Richardson, Texas 75081
 30280 16196? TRAFFIC MANAGEMENT PLAN Exhibit 572B Aikin Elementary School Planned Development District No. 572 Approved City Plan Commission October20, 2016 July 12, 2016 Prepared for HALFF AVO 31586 PHO1
FINAL Traffic Report for the Proposed Golden Valley Road and Newhall Ranch Road Projects in the City of Santa Clarita, California May 5, 2005
 FINAL Traffic Report for the Proposed Golden Valley Road and Newhall Ranch Road Projects in the City of Santa Clarita, California May 5, 2005 Prepared For: EDAW, Inc. 1420 Kettner Boulevard, Suite 620
Appendix I: Traffic Study
 City of Fontana Sierra Lakes Commerce Center Draft EIR Appendix I: Traffic Study FirstCarbon Solutions H:\Client (PN JN)\0144\01440050\EIR\1 ADEIR\01440050 Sec99 99 Appendix Dividers.doc THIS PAGE INTENTIONALLY
MADISON, WI STONE HOUSE DEVELOPMENT 1000 E. WASHINGTON AVENUE REDEVELOPMENT TRANSPORTATION STUDY DECEMBER 14, 2015
 MADISON, WI STONE HOUSE DEVELOPMENT 1000 E. WASHINGTON AVENUE REDEVELOPMENT TRANSPORTATION STUDY DECEMBER 14, 2015 TABLE OF CONTENTS... 3 Proposed Development... 3 Methodology... 3 Phase 1 Development...
Trip Generation Study: A 7-Eleven Gas Station with a Convenience Store Land Use Code: 945
 Trip Generation Study: A 7-Eleven Gas Station with a Convenience Store Land Use Code: 945 Introduction The Brigham Young University Institute of Transportation Engineers student chapter (BYU ITE) completed
Appendix C Traffic Study
 Final Environmental Impact Statement Appendix C Traffic Study Schofield Generating Station Project, Hawaii October 2015 C-1 Final Environmental Impact Statement This page intentionally left blank. Schofield
6711 LEE HIGHWAY TRAFFIC IMPACT STUDY ARLINGTON, VIRGINIA
 6711 TRAFFIC IMPACT STUDY ARLINGTON, VIRGINIA Prepared for: NVR, Inc. Prepared by: Wells + Associates, Inc. Michael J. Workosky, PTP, TOPS, TSOS John J. Andrus William L. Zeid, PE 703.917.6620 May 4, 2017
California Urban Infill Trip Generation Study. Jim Daisa, P.E.
 California Urban Infill Trip Generation Study Jim Daisa, P.E. What We Did in the Study Develop trip generation rates for land uses in urban areas of California Establish a California urban land use trip
TRANSPORTATION AND TRAFFIC ANALYSIS REPORT
 Square One Drive Extension Municipal Class Environmental Assessment Environmental Study Report Appendix B Transportation and Traffic Analysis Report TRANSPORTATION AND TRAFFIC ANALYSIS REPORT FINAL DRAFT
Prepared for. 3D/International, Inc West Loop South, Suite 400 Houston, Texas November 2006
 DRAFT TRAFFIC IMPACT STUDY FOR PHASED DEVELOPMENT OF TAMU CC Prepared for 3D/International, Inc. 1900 West Loop South, Suite 400 Houston, Texas 77027 November 2006 Interim Review Only Document Incomplete:
The Highline Development Traffic Impact Study
 The Highline Development Traffic Impact Study Columbia Falls, Montana Prepared For: TD&H Engineering 450 Corporate Drive, Suite 101 Kalispell, MT 59901 June, 2018 130 South Howie Street Helena, Montana
KAISER SOUTH NORTHERN VIRGINIA HUB TRAFFIC IMPACT STUDY PRINCE WILLIAM COUNTY, VIRGINIA TABLE OF CONTENTS. Section 2 BACKGROUND INFORMATION 12
 KAISER SOUTH NORTHERN VIRGINIA HUB TRAFFIC IMPACT STUDY PRINCE WILLIAM COUNTY, VIRGINIA TABLE OF CONTENTS Page EXECUTIVE SUMMARY 1 Purpose of Report and Study Objectives... 1 Site Location and Study Area...
Metro Emergency Security Operations Center (ESOC) 410 Center Street City of Los Angeles
 410 Center Street City of Los Angeles") Metro Emergency Security Operations Center (ESOC) 410 Center Street City of Los Angeles Traffic Study August 31, 2015 AECOM 515 South Flower Street, 4 th Floor Los Angeles, CA 90071 Job Number: 60323255
Metro Emergency Security Operations Center (ESOC) 410 Center Street City of Los Angeles Traffic Study August 31, 2015 AECOM 515 South Flower Street, 4 th Floor Los Angeles, CA 90071 Job Number: 60323255
ALTA VISTA COMMERCIAL/ RESIDENTIAL PROJECT
 ALTA VISTA COMMERCIAL/ RESIDENTIAL PROJECT TRAFFIC IMPACT ANALYSIS Prepared For: Paul Conzelman SC Development 2151 Michelson Drive, Suite 140 Irvine, CA 92612 Prepared By: 2030 Main Street, Suite 1200
Table of Contents Introduction... 4 Study Area... 5
 Table of Contents Introduction... 4 Study Area... 5 Streets and s... 5 Traffic Volumes... 8 Recent and Anticipated Development... 10 Crash Analysis... 10 Projected Traffic Volumes... 11 Trip Generation...
FARM 1065 PORTION 1, ATLANTIS TRAFFIC IMPACT ASSESSMENT
 FARM 1065 PORTION 1, ATLANTIS TRAFFIC IMPACT ASSESSMENT February 2018 FIRST ISSUE Prepared by: JG AFRIKA (PTY) LTD Branch: Cape Town PO Box 38561 Postal code: 7430 Telephone: 021 530 1800 Email: wink@
TRAFFIC IMPACT STUDY MANUFACTURING COMPANY
 TRAFFIC IMPACT STUDY For MANUFACTURING COMPANY Prepared For: Airway Heights, WA Prepared By: SUNBURST ENGINEERING, P. S. 4310 S. Ball Dr. Veradale, WA 99037 April, 2013 TRAFFIC IMP ACT STUDY Manufacturing
Parking Regulations Dundas Street West, from Bathurst Street to Dovercourt Road
 STAFF REPORT ACTION REQUIRED Parking Regulations Dundas Street West, from Bathurst Street to Dovercourt Road Date: October 28, 2008 To: From: Toronto and East York Community Council Director, Transportation
Subject: Desert Palisades Specific Plan - Tram Way Access Sight Distance
 Endo Engineering Traffic Engineering Air Quality Studies Noise Assessments July 13, 2015 Mr. Ed Freeman Pinnacle View, LLC P.O. Box 1754 Lake Oswego, OR 97035-0579 Subject: Desert Palisades Specific Plan
CHAPTER 3. CAPACITY OF SIGNALIZED INTERSECTIONS
 CHAPTER 3. CAPACITY OF SIGNALIZED INTERSECTIONS 1. Overview In this chapter we explore the models on which the HCM capacity analysis method for signalized intersections are based. While the method has
Traffic Impact Analysis. for the STARBUCKS STORE. Located at 9900 BALBOA BOULEVARD. Submitted to CITY OF LOS ANGELES. January 2017.
 Traffic Impact Analysis for the STARBUCKS STORE Located at 9900 BALBOA BOULEVARD Submitted to CITY OF LOS ANGELES January 2017 Submitted By January 5, 2017 Ken A. Aitchison, P.E. Transportation Engineering
TRAFFIC IMPACT STUDY
 TRAFFIC IMPACT STUDY TERRE HAUTE CONVENTION CENTER WABASH AVENUE & 9 TH STREET TERRE HAUTE, INDIANA PREPARED FOR 8365 Keystone Crossing, Suite 201 Indianapolis, IN 46240 Phone: (317) 202-0864 Fax: (317)
Travel Demand Management Plan
 Travel Demand Management Plan Tryg s & Apartment Building 8 West Lake Street Minneapolis, MN AUTHORIZED PROPERTY REPRESENTATIVE: By Dated: Mr. Johnny Carlson Trammell Crow Chicago Development, Inc. 5 South
MnDOT Method for Calculating Measures of Effectiveness (MOE) From CORSIM Model Output
 From CORSIM Model Output") MnDOT Method for Calculating Measures of Effectiveness (MOE) From CORSIM Model Output Rev. April 29, 2005 MnDOT Method for Calculating Measures of Effectiveness (MOE) From CORSIM Model Output Table of
MnDOT Method for Calculating Measures of Effectiveness (MOE) From CORSIM Model Output Rev. April 29, 2005 MnDOT Method for Calculating Measures of Effectiveness (MOE) From CORSIM Model Output Table of
SUBJECT: SUMMARY OF FINDINGS. October 29, Mr. Carter Redish Carter Group Architects, Inc S. El Camino Real, Suite F San Clemente, CA 92672
 October 29, 2018 Mr. Carter Redish Carter Group Architects, Inc. 1810 S. El Camino Real, Suite F San Clemente, CA 92672 SUBJECT: CANYON STEEL FOCUSED TRAFFIC IMPACT ANALYSIS Dear Mr. Carter Redish: Urban
MEMORANDUM. Trip Generation Analysis
 MEMORANDUM To: RMC Architects From: Matthew Palmer, PE Subject: Trip Generation, Parking Analysis & Level of Service Project: Port of Everett, GTC #13-053 Date: August 25, 2014 The trip generation and
VHD Daily Totals. Population 14.5% change. VMT Daily Totals Suffolk 24-hour VMT. 49.3% change. 14.4% change VMT
 6.9 Suffolk 6-54 VMT Population and Travel Characteristics Population 14.5% change 2014 1,529,202 VHD Daily Totals 2014 251,060 49.3% change 2040 1,788,175 2040 374,850 VMT Daily Totals 2014 39,731,990
S.170 th Street Micro-Simulation Seattle-Tacoma International Airport Port of Seattle/Aviation Planning
 Seattle-acoma International Airport Port of Seattle/Aviation Planning Port of Seattle PO OF SEAE Aviation Planning Airport Operations January 24, 2013 Summary he Port is planning to relocate the cell phone
TRANSPORTATION IMPACT STUDY WHEELER STREET CLOSURE
 TRANSPORTATION IMPACT STUDY WHEELER STREET CLOSURE Village of Greene, Chenango County, New York Prepared for: VILLAGE OF GREENE 49 Genesee Street Greene, NY 13778 Prepared by: LARSON DESIGN GROUP 1000
930 Old Northern Rd & 4 Post Office Rd, Glenorie
 Proposed Mixed Use Development 930 Old Northern & 4, Glenorie TRAFFIC AND PARKING ASSESSMENT REPORT 13 December 2016 Ref 16264 Suite 6, 20 Young Street, Neutral Bay NSW 2089 - PO Box 1868, Neutral Bay
Ripley II Silver Spring, MD
 Traffic Impact Study Ripley II Silver Spring, MD Prepared for: Washington Property Company January 1, 016 Kimley-Horn & Associates, Inc. 016 TABLE OF CONTENTS LIST OF FIGURES... iii LIST OF TABLES...
COUNCIL POLICY MANUAL
 COUNCIL POLICY MANUAL SECTION: PUBLIC WORKS SUBJECT: SNOW & ICE CONTROL POLICY 2012/2013 GOAL: Pages: 1 of 10 Approval Date: Dec. 3, 2012 Res. # 1001/2012 To annually identify the winter maintenance costs
Trip Generation Characteristics of Super Convenience Market Gasoline Pump Stores
 Trip Generation Characteristics of Super Convenience Market Gasoline Pump Stores This article presents the findings of a study that investigated trip generation characteristics of a particular chain of
Appendix C Final Methods and Assumptions for Forecasting Traffic Volumes
 Fairview Ave. and Main St. Improvements and Local Streets Plan Appendices Ada County Highway District Appendix C Final Methods and Assumptions for Forecasting Traffic Volumes January 3, 207 Appendices
Signalized Intersections
 Signalized Intersections Kelly Pitera October 23, 2009 Topics to be Covered Introduction/Definitions D/D/1 Queueing Phasing and Timing Plan Level of Service (LOS) Signal Optimization Conflicting Operational
TRAFFIC STUDY FOR THE GAFFEY POOL PROJECT LOS ANGELES, CALIFORNIA CITY OF LOS ANGELES, BUREAU OF ENGINEERING OCTOBER 2013 PREPARED FOR PREPARED BY
 TRAFFIC STUDY FOR THE GAFFEY POOL PROJECT LOS ANGELES, CALIFORNIA OCTOBER 2013 PREPARED FOR CITY OF LOS ANGELES, BUREAU OF ENGINEERING PREPARED BY DRAFT TRAFFIC STUDY FOR THE GAFFEY POOL PROJECT October
City of Camrose Winter Road Maintenance Policy
 City of Camrose Winter Road Maintenance Policy The purpose of this policy is to outline the level of service that the City of Camrose delivers regarding the maintenance of roads in winter conditions. 1.
January 12, Mr. Ryan Granger TMGB Wilson, LLC 2221 Health Drive SW, Suite 2200 Wyoming, Michigan 49519
 January 12, 2018 Mr. Ryan Granger TMGB Wilson, LLC 2221 Health Drive SW, Suite 2200 Wyoming, Michigan 49519 Re: Proposed Reserve at Rivertown Mixed-Use Development Updated Trip Generation and Site Driveway
PW 001 SNOW REMOVAL AND SANDING FOR ROADWAYS AND SIDEWALKS October 6, 2014 (#223-14) Original October 19, 2015; October 15, 2018 Public Works
 Original October 19, 2015; October 15, 2018 Public Works") Policy Statement: The Village of Kitscoty will provide snow and ice control on municipal streets and sidewalks according to determined priorities. Purpose: To provide direction and information to employees
Policy Statement: The Village of Kitscoty will provide snow and ice control on municipal streets and sidewalks according to determined priorities. Purpose: To provide direction and information to employees
DOLLAR GENERAL PROJECT FOCUSED TRAFFIC ANALYSIS (REVISED) May 20, 2015
 May 20, 2015") DOLLAR GENERAL PROJECT FOCUSED TRAFFIC ANALYSIS (REVISED) May 20, 2015 May 20, 2015 Mr. Dan Biswas, VP of Development CJS DEVELOPMENT II, LLC 5111 North Scottsdale Road, Suite 200 Scottsdale, CA 85250
DOLLAR GENERAL PROJECT FOCUSED TRAFFIC ANALYSIS (REVISED) May 20, 2015 May 20, 2015 Mr. Dan Biswas, VP of Development CJS DEVELOPMENT II, LLC 5111 North Scottsdale Road, Suite 200 Scottsdale, CA 85250
6 th Line Municipal Class Environmental Assessment
 6 th Line Municipal Class Environmental Assessment County Road 27 to St John s Road Town of Innisfil, ON September 6, 2016 APPENDIX L: TRAVEL DEMAND FORECASTING MEMORANDUM Accessible formats are available
WOODRUFF ROAD CORRIDOR ORIGIN-DESTINATION ANALYSIS
 2018 WOODRUFF ROAD CORRIDOR ORIGIN-DESTINATION ANALYSIS Introduction Woodruff Road is the main road to and through the commercial area in Greenville, South Carolina. Businesses along the corridor have
Per your request and authorization, we have prepared this traffic evaluation for the above referenced project.
 Memorandum To: From: Re: Marc Stout, P.E. City Engineer, City of Roseville Chris Gregerson, P.E., T.E. Matt Weir, P.E., T.E., PTOE Douglas Boulevard Coffee Kiosk Traffic Evaluation Roseville, California
MEMORANDUM (DRAFT) DRAFT
 DRAFT") 117 Commercial St. NE, Suite 310 Salem, OR 97301 503.391.8773 www.dksassociates.com MEMORANDUM (DRAFT) DATE: February 15, 2017 TO: FROM: SUBJECT: Alex Dupey, MIG Scott Mansur, PE, PTOE; Garth Appanaitis,
117 Commercial St. NE, Suite 310 Salem, OR 97301 503.391.8773 www.dksassociates.com MEMORANDUM (DRAFT) DATE: February 15, 2017 TO: FROM: SUBJECT: Alex Dupey, MIG Scott Mansur, PE, PTOE; Garth Appanaitis,
Appendixx C Travel Demand Model Development and Forecasting Lubbock Outer Route Study June 2014
 Appendix C Travel Demand Model Development and Forecasting Lubbock Outer Route Study June 2014 CONTENTS List of Figures-... 3 List of Tables... 4 Introduction... 1 Application of the Lubbock Travel Demand
1.0 INTRODUCTION AND SUMMARY...
 TABLE OF CONTENTS 1.0 INTRODUCTION AND SUMMARY... 1 1.1 Purpose and Study Objective... 1 1.2 Executive Summary... 1 2.0 ROADWAY CONDITIONS... 5 2.1 Granville Parkway (South Intersection)... 8 2.2 Tuscany
The Sunland Park flyover ramp is set to close the week of March 19 until early summer
 March 2, 2018 The Sunland Park flyover ramp is set to close the week of March 19 until early summer GO 10 is targeting the week of March 19 to close the Sunland Park Drive flyover entrance ramp to I 10
City of Saginaw Right of Way Division Snow and Ice Removal Policy January 18, 2016
 Snow and Ice Removal Policy January 18, 2016 It is the policy of the to provide snowplowing and ice removal services in order to: Provide safe traveling conditions for motorists and pedestrians Assist
FY 2010 Continuing i Planning Program Product Report. Local Transportation and Traffic Data. Wood-Washington-Wirt Interstate Planning Commission
 FY 2010 Continuing i Planning Program Product Report Local Transportation and Traffic Data Travel Time and Delay Data for Belpre and Marietta, Ohio Wood-Washington-Wirt Interstate Planning Commission CONTINUING
Final City of Colusa STREETS & ROADWAYS MASTER PLAN. October J Street Suite 390 Sacramento, CA 95814
 Final City of Colusa STREETS & ROADWAYS MASTER PLAN October 2009 660 J Street Suite 390 Sacramento, CA 95814 TABLE OF CONTENTS I. INTRODUCTION... 1 Report Organization...1 II. ANALYSIS METHODOLOGY... 2
2129 NORTH MAIN STREET HOTE PROJECT ULI SHARED PARKING STUDY City of Santa Ana, California
 2129 NORTH MAIN STREET HOTE PROJECT ULI SHARED PARKING STUDY City of Santa Ana, California Prepared for: NET DEVELOPMENT COMPANY 3130 Airway Avenue Costa Mesa, CA 92626 Prepared by: RK ENGINEERING GROUP,
Expanding the GSATS Model Area into
 Appendix A Expanding the GSATS Model Area into North Carolina Jluy, 2011 Table of Contents LONG-RANGE TRANSPORTATION PLAN UPDATE 1. Introduction... 1 1.1 Background... 1 1.2 Existing Northern Extent of
APPENDIX IV MODELLING
 APPENDIX IV MODELLING Kingston Transportation Master Plan Final Report, July 2004 Appendix IV: Modelling i TABLE OF CONTENTS Page 1.0 INTRODUCTION... 1 2.0 OBJECTIVE... 1 3.0 URBAN TRANSPORTATION MODELLING
Date: April 3, 2018 Revised May 15, Project #: Re: Burlington Mall Retail Collection Transportation Evaluation
 To: Chuck Schneider Burlington S&S, LLC 225 West Washington Street Indianapolis, IN 46204 From: Patrick Dunford, P.E. Senior Project Manager Date: April 3, 2018 Revised May 15, 2018 Project #: 13482.01
Freeway Work Zone Lane Capacity
 Report Title Report Date: 2009 Freeway Work Zone Lane Capacity Principle Investigator Vendor Name and Address Name Drakopoulos, Alex «Vendor» Affiliation Marquette University Address 263 Haggerty Hall
PROPOSED PROJECT. Section PROJECT DESCRIPTION
 1 2 3 4 5 6 7 8 9 10 11 12 13 14 15 16 17 18 19 20 21 22 23 24 25 26 27 28 29 30 31 32 33 34 35 36 37 38 39 40 41 42 43 1.1 PROJECT DESCRIPTION This Environmental Assessment describes the proposed improvements
CONTINUING PLANNING PROGRAM LOCAL TRANSPORTATION AND TRAFFIC DATA PRODUCT REPORT [OH Corridors]
![CONTINUING PLANNING PROGRAM LOCAL TRANSPORTATION AND TRAFFIC DATA PRODUCT REPORT [OH Corridors]](/thumbs/94/120123757.jpg "CONTINUING PLANNING PROGRAM LOCAL TRANSPORTATION AND TRAFFIC DATA PRODUCT REPORT [OH Corridors]") CONTINUING PLANNING PROGRAM LOCAL TRANSPORTATION AND TRAFFIC DATA PRODUCT REPORT [OH Corridors] Travel Time and Delay Analysis for Belpre (OH) and Marietta (OH) Fiscal Year 2009 Report WOOD WASHINGTON
CONTINUING PLANNING PROGRAM LOCAL TRANSPORTATION AND TRAFFIC DATA PRODUCT REPORT [OH Corridors] Travel Time and Delay Analysis for Belpre (OH) and Marietta (OH) Fiscal Year 2009 Report WOOD WASHINGTON
III. FORECASTED GROWTH
 III. FORECASTED GROWTH In order to properly identify potential improvement projects that will be required for the transportation system in Milliken, it is important to first understand the nature and volume
Freeway Work Zone Lane Capacity
 Freeway Work Zone Lane Capacity Thomas Notbohm, P.E. Wisconsin Department of Transportation Thomas.Notbohm@dot.state.wi.us Alex Drakopoulos Department of Civil & Environmental Engineering Marquette University,
US 169/I-70 North Loop Planning & Environmental Linkages Study
 US 169/I-70 North Loop Planning & Environmental Linkages Study VISSIM Calibration Document Draft April 13, 2018 Page i Table of Contents 1. Overview... 1 2. Data Types... 2 3. Model Parameter Adjustments...
City of Hermosa Beach Beach Access and Parking Study. Submitted by. 600 Wilshire Blvd., Suite 1050 Los Angeles, CA
 City of Hermosa Beach Beach Access and Parking Study Submitted by 600 Wilshire Blvd., Suite 1050 Los Angeles, CA 90017 213.261.3050 January 2015 TABLE OF CONTENTS Introduction to the Beach Access and Parking
CITY OF ORILLIA POLICY MANUAL. Winter Operations. Table of Contents. WINTER CONTROL Objectives 2. WINTER CONTROL Season 3
 Page 1 of 12 Winter Operations Table of Contents WINTER CONTROL Objectives 2 WINTER CONTROL Season 3 SNOW ACCUMULATION Road Plowing 4,5 ICY ROADWAYS Application of Deicers/Abrasives 6 SNOW ACCUMULATION
North Carolina s First Quadrant Left: History and Lessons Learned
 North Carolina s First Quadrant Left: History and Lessons Learned Michael P. Reese, P.E. (Corresponding Author) Congestion Management Section Project Engineer North Carolina Department of Transportation
Committee Meeting November 6, 2018
 Committee Meeting November 6, 2018 Agenda Where we are in the process Land Use Plan Transportation Element Housing & Neighborhoods Elements Next Steps Schedule November 6: Plan Elements December: Plan
APPLICATION TO AMEND THE FUTURE LAND USE MAP (FLUM) SMALL SCALE
 SMALL SCALE") DEPARTMENT OF DEVELOPMENT & PLANNING 825 Ohio Avenue - Lynn Haven, FL 32444 (850) 265-2961 - (850) 265-3478 APPLICATION TO AMEND THE FUTURE LAND USE MAP (FLUM) SMALL SCALE Deadline to submit is 30 days
DEPARTMENT OF DEVELOPMENT & PLANNING 825 Ohio Avenue - Lynn Haven, FL 32444 (850) 265-2961 - (850) 265-3478 APPLICATION TO AMEND THE FUTURE LAND USE MAP (FLUM) SMALL SCALE Deadline to submit is 30 days
Appendix B. Durham Region Travel Demand Model Calibration
 Appendix B Durham Region Travel Demand Model Calibration AECOM 300 Water Street 905 668 9363 tel Whitby, ON, Canada L1N 9J2 905 668 0221 fax www.aecom.com To Ron Albright, Municipality of Clarington Page
North Carolina s First Quadrant Left: History and Lessons Learned
 0 0 0 North Carolina s First Quadrant Left: History and Lessons Learned Michael P. Reese, P.E. (Corresponding Author) Congestion Management Section Project Engineer North Carolina Department of Transportation
I. M. Schoeman North West University, South Africa. Abstract
 Urban Transport XX 607 Land use and transportation integration within the greater area of the North West University (Potchefstroom Campus), South Africa: problems, prospects and solutions I. M. Schoeman
CE351 Transportation Systems: Planning and Design
 CE351 Transportation Systems: Planning and Design TOPIC: Level of Service (LOS) at Traffic Signals 1 Course Outline Introduction to Transportation Highway Users and their Performance Geometric Design Pavement
APPENDIX I: Traffic Forecasting Model and Assumptions
 APPENDIX I: Traffic Forecasting Model and Assumptions Appendix I reports on the assumptions and traffic model specifications that were developed to support the Reaffirmation of the 2040 Long Range Plan.
Appendix B.1 EMME Model Calibration Memo
 Appendix B.1 EMME Model Calibration Memo itrans 144 Front Street West, Suite 655 Toronto, ON M5J 2L7 Tel: (416) 847-0005 Fax: (905) 882-1557 www.hdrinc.com www.itransconsulting.com File: 2.0 Memorandum
The Urbana Free Library Parking and Transportation Study
 CHAMPAIGN COUNTY REGIONAL PLANNING COMMISSION The Urbana Free Library Parking and Transportation Study Final Report 7/18/2013 Champaign Urbana Urbanized Area Transportation Study (CUUATS) TABLE OF CONTENTS
Impact of Day-to-Day Variability of Peak Hour Volumes on Signalized Intersection Performance
 Impact of Day-to-Day Variability of Peak Hour Volumes on Signalized Intersection Performance Bruce Hellinga, PhD, PEng Associate Professor (Corresponding Author) Department of Civil and Environmental Engineering,
TRAFFIC ALERT FOR WEEK OF February 4 8, 2008
 TRAFFIC ALERT FOR WEEK OF February 4 8, 2008 Highway work zones in the Staunton District The following is a list of highway work that might affect traffic in the Staunton transportation district during
Appendix B. Land Use and Traffic Modeling Documentation
 Appendix B Land Use and Traffic Modeling Documentation Technical Memorandum Planning Level Traffic for Northridge Sub-Area Study Office of Statewide Planning and Research Modeling & Forecasting Section
Appendix B. Traffic Analysis Report
 Appendix B Traffic Analysis Report Report No. 14369/TR/WN02 August 2007 SALLINS BYPASS BYPASS OPTIONEERING ANALYSIS - TRAFFIC REPORT Kildare County Council Áras Chill Dara, Devoy Park, Naas, Co Kildare
TREASURE COAST REGIONAL PLANNING COUNCIL M E M O R A N D U M. To: Council Members AGENDA ITEM 4B10
 TREASURE COAST REGIONAL PLANNING COUNCIL M E M O R A N D U M To: Council Members AGENDA ITEM 4B10 From: Date: Subject: Staff December 14, 2018 Council Meeting Local Government Comprehensive Plan Review
106 PURDUE ENGINEERING EXTENSION DEPARTMENT
 106 PURDUE ENGINEERING EXTENSION DEPARTMENT distribution by stations can best be studied by examining Figs. 3 and 4. Figure 4 shows the frequency distribution between stations, and Fig. 3 shows the actual
A Study of Red Light Cameras in Kansas City, MO
 A Study of Red Light s in Kansas City, MO Prepared by the Special Operations Division Executive Summary This paper will analyze the crash data for the 29 red light cameras located in 17 intersections in
570 Hazeldean Road, Ottawa, ON Transportation Brief Mattamy Homes. Prepared By: Stantec Consulting Ltd. Project Number:
 570 Hazeldean Road, Ottawa, ON Transportation Brief Mattamy Homes Prepared By: Stantec Consulting Ltd. Project Number: 163600871 March 2013 570 HAZELDEAN ROAD, OTTAWA, ON TRANSPORTATION BRIEF MARCH 2013
CHAPTER 3 TRANSPORTATION
 CHAPTER 3 TRANSPORTATION This chapter presents information on transportation impacts of Section 2 of the Project that have changed from those identified in the published Westside Subway Extension Final
St. Tammany: Transportation Systems Management Study (Covington) RPC Project No. (LA21-COV) State Project No F.A.P. No.
 RPC Project No. (LA21-COV) State Project No F.A.P. No.") St. Tammany: Transportation Systems Management Study (Covington) RPC Project o. (LA21-COV) State Project o. 700-52-0197 F.A.P. o. P-5208(514) LA 21 (Boston Street) Lee Lane to ew Hampshire Street Prepared
St. Tammany: Transportation Systems Management Study (Covington) RPC Project o. (LA21-COV) State Project o. 700-52-0197 F.A.P. o. P-5208(514) LA 21 (Boston Street) Lee Lane to ew Hampshire Street Prepared
3.0 ANALYSIS OF FUTURE TRANSPORTATION NEEDS
 3.0 ANALYSIS OF FUTURE TRANSPORTATION NEEDS In order to better determine future roadway expansion and connectivity needs, future population growth and land development patterns were analyzed as part of
1. Major streets, Central Business District (CBD) and school bus routes. 2. Local streets 3. Downtown parking lots
 and school bus routes. 2. Local streets 3. Downtown parking lots") City of Mt. Pleasant Administrative Memo #1-85 Issued: January 1, 1985 SUBJECT: Snow and Ice Control Policy SUMMARY: The intent of this policy is to construct a basic guideline to effectively and efficiently
City of Mt. Pleasant Administrative Memo #1-85 Issued: January 1, 1985 SUBJECT: Snow and Ice Control Policy SUMMARY: The intent of this policy is to construct a basic guideline to effectively and efficiently
Figure 8.2a Variation of suburban character, transit access and pedestrian accessibility by TAZ label in the study area
 Figure 8.2a Variation of suburban character, transit access and pedestrian accessibility by TAZ label in the study area Figure 8.2b Variation of suburban character, commercial residential balance and mix
Brandywine Road Speed Study FINAL REPORT
 Brandywine Road Speed Study FINAL REPORT City of Albuquerque Brandywine Road Speed Study Final Report Albuquerque, New Mexico City of Albuquerque May, 2016 Brandywine Road Speed Study Final Report City
CITY OF BEAVER DAM SNOW & ICE REMOVAL POLICY
 CITY OF BEAVER DAM SNOW & ICE REMOVAL POLICY Revised January, 2016 Approved by Operations Committee: February 1, 2016 This snow and ice removal policy guides Public Works personnel with deicing, plowing,
5.1 Introduction. 5.2 Data Collection
 Chapter 5 Traffic Analysis 5.1 Introduction This chapter of the EIS assesses the traffic impacts of the proposed N5 Westport to Turlough Road Project (the proposed scheme). The proposed scheme will provide
CITY OF NEW LONDON WINTER ROAD & SIDEWALK MAINTENANCE POLICY
 CITY OF NEW LONDON WINTER ROAD & SIDEWALK MAINTENANCE POLICY GENERAL The purpose of this policy is to set up acceptable procedures and policies for the winter maintenance of public areas in the City of
Appendix BAL Baltimore, Maryland 2003 Annual Report on Freeway Mobility and Reliability
 (http://mobility.tamu.edu/mmp) Office of Operations, Federal Highway Administration Appendix BAL Baltimore, Maryland 2003 Annual Report on Freeway Mobility and Reliability This report is a supplement to: