Transferability of Household Travel Data Across Geographic Areas Using NHTS 2001
|
|
|
- Annabel Farmer
- 6 years ago
- Views:
Transcription

1 Transferability of Household Travel Data Across Geographic Areas Using NHTS 2001 Jane Lin PhD Assistant Professor Department of Civil and Materials Engineering Institute for Environmental Science and Policy University of Illinois at Chicago Northwestern University Transportation Seminar May
2 Background Household travel surveys are expensive instruments Data become outdated Small MPOs lack resources General approach of data transferability study involves data clustering and updating e.g. Greaves and Stopher (2000) Wilmot and Stopher (2001) Reuscher et al. (2002) Debates over model transferability have never stopped Spatial and temporal transferability Level of aggregation (e.g. Wilmot 1995) Model specification (e.g. Koppelman and Wilmot 1986) 2
3 Objective Focuses on data transferability To examine transferability of household travel survey data across geographic areas Impact of neighborhood type on household travel is of particular interest Urban versus suburban and rural Land use (e.g. density roads intersections) City low income versus suburban wealthy Hispanic versus White or Black etc. 3
4 Definition of transferability We define travel data transferability as the possibility of transferring household travel attributes across geographic areas as well as the trip generation models built on the transferred data which has the following form where y s m i β sm 0 Ks k 1 β smk smik y smi = ith dependent variable for household (i = 1 N sm ) in homogeneous group s (s = 1 S) and geographic area m (m = 1 M) smk = kth model coefficient of intercept (k=0) or household attribute (k = 1 2 K s ) x smik = kth continuous independent variable (household attribute) for household i in homogeneous group s and geographic area m smi = random error term for household i in homogeneous group s and geographic area m x ε smi (1) 4
5 Research questions Suppose we have already clustered households into homogeneous groups across geographic areas including the area of interest. The aggregated information at the group level is available for all of the areas let us call that background attributes associated with each group of the area. Can we associate the dependent variable y smi with the background attributes? Can we estimate coefficients smk s based on the area s background attributes given that individual household attributes are not available? If the predictions are accurate we say the travel data (and model coefficients smk s) are transferable. 5
6 In mathematical language β smk γ sk 0 Q q 1 γ skq w smkq υ smk (2) where w smkq = qth background attribute associated with coefficient smk (k = 1 2 K s ) of group s and geographic area m skq = qth weight for intercept (q = 0) or background attribute (q = 12 Q) smk = random error term associated with coefficient smk of group s and geographic area m 6
7 7 Final model Or in matrix form Y m = X m m + Z m m + m m = W m + m Y m = X m W m + Z m m + (X m m + m ) i m k k i m k m m j j i m j m k k i m q q k m q k k q q m q i m x z x w w y m i j j m i j m K k k m i m k m i m ε z α x β β y s 1 0 k m Q q q k m q k k k m υ w γ γ β 1 0
8 This is a two-level hierarchical modeling problem. For any group s Level 2 Area 1 Area 2 Area M Level 1 Household 1 2 N N N M 8
9 Properties of random errors εm ~ N( 0 R) where R σ 2 I (7) υ m ~ N( 0 G) where G τ τ 00 K s τ 0 τ 0 k kk τ K s τ k 0K τ s K s K s (8) cov ( ε m υ m ) 0 (9) 9
10 Hypotheses Fixed effects ( kq and mj ) H 0 : kq = 0 and mj = 0 for mkq. That is there are no fixed effects of the covariates on the dependent variable if the null hypothesis is accepted. Random effects ( mk ) H 0 : mk = 0 for mk. If the null hypothesis is accepted there are no deviations from the fixed effects across all areas. We then say the household travel data (and the model coefficients) are transferable. Covariance components (R and G) H 0 : kl = 0 tests the goodness-of-fit of the hierarchical model. 10
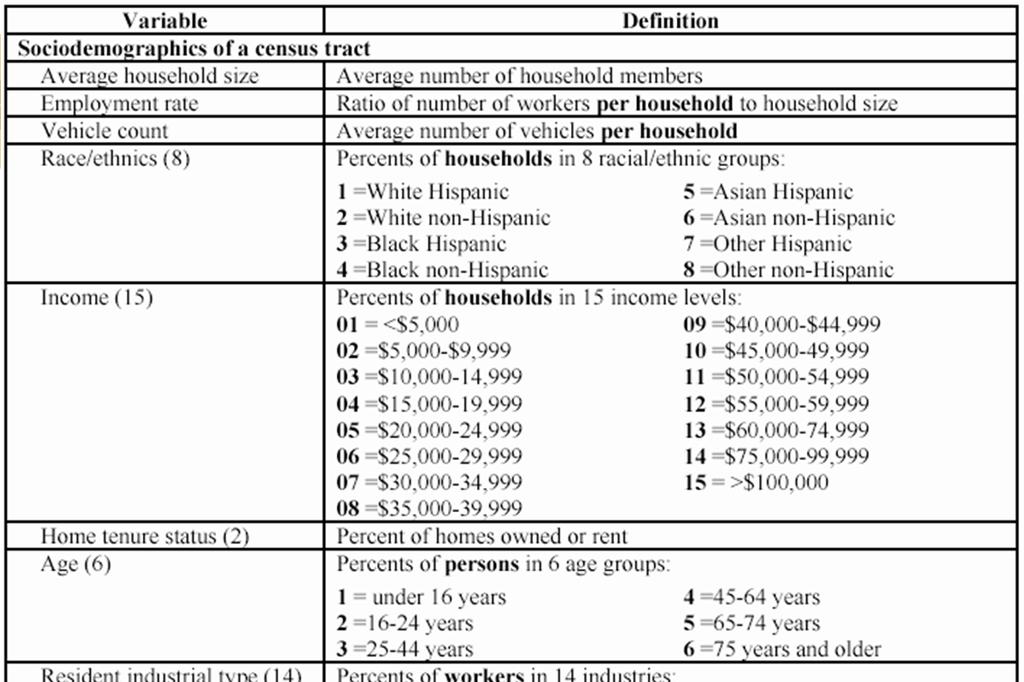
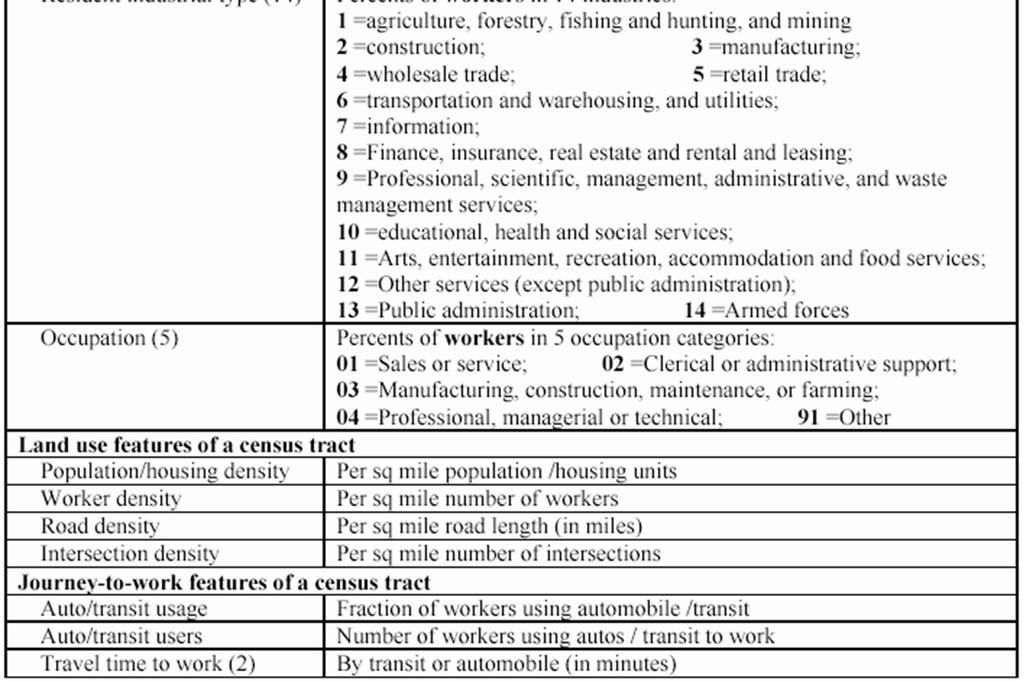
11 Data National Household Travel Survey 2001 (NHTS 2001) household observations Five datasets of households persons travel day trips vehicles and long-distance trips Census Transportation Planning Package 2000 (CTPP 2000) Geographic levels: state county census tract block group MSA/CMSA and TAZ Three parts: place of residence place of work and journey to work census tracts 11
12 Define neighborhood types Clustering at the census tract level to define neighborhood types Data: CTPP 2000 Part I Sixty-four variables extracted Method: Two-step clustering method GIS spatial analysis (Lin and Long 2006 TRB CD-ROM) 12
13 13
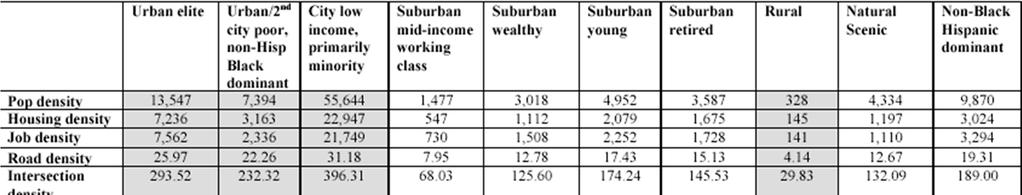
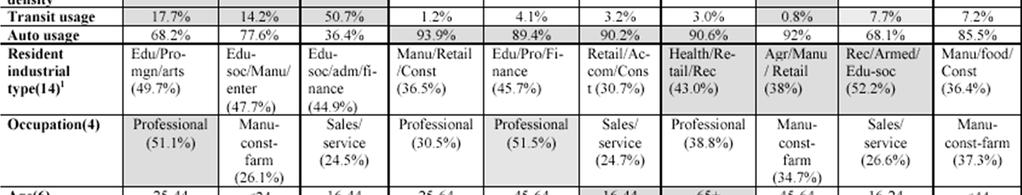
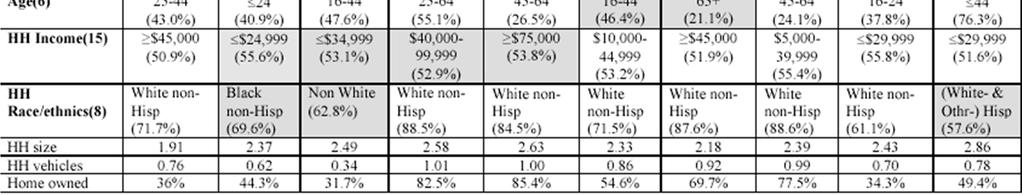
14 Final ten neighborhood types 14
15 Distribution of neighborhood type Neighborhood type Number of Census Tracts % of Total Number of households % of Total Urban elite Urban/2 nd city poor non-hispanic Black dominant City low income primarily minority Suburban mid-income working class Suburban mid-age wealthy Suburban young Suburban retired Rural Natural Scenic Non-Black Hispanic dominant Valid Cases Excluded Cases Total

16 Visualization of ten neighborhood types 16
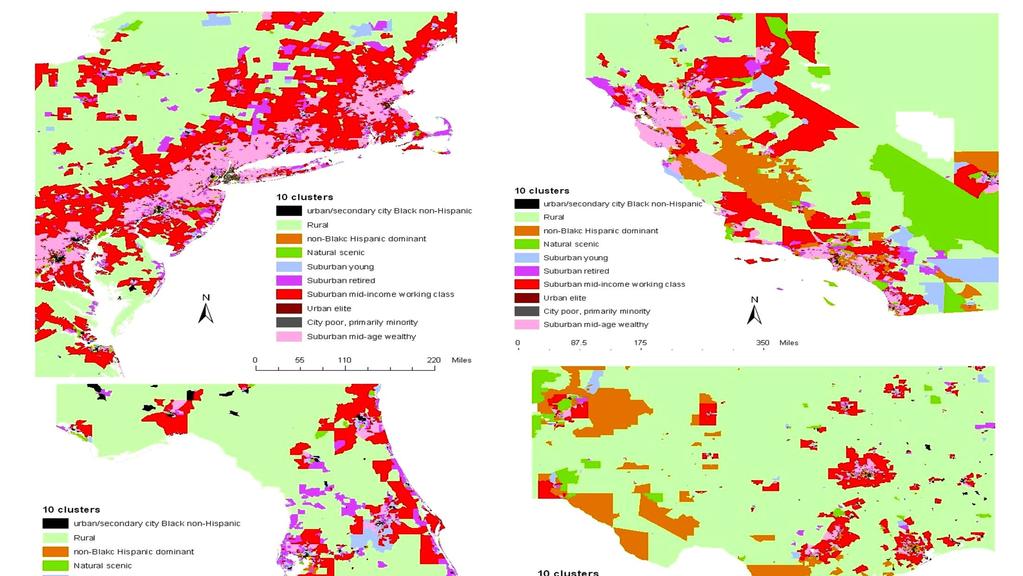
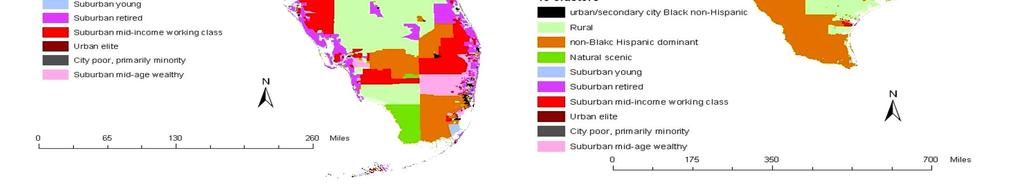
17 17
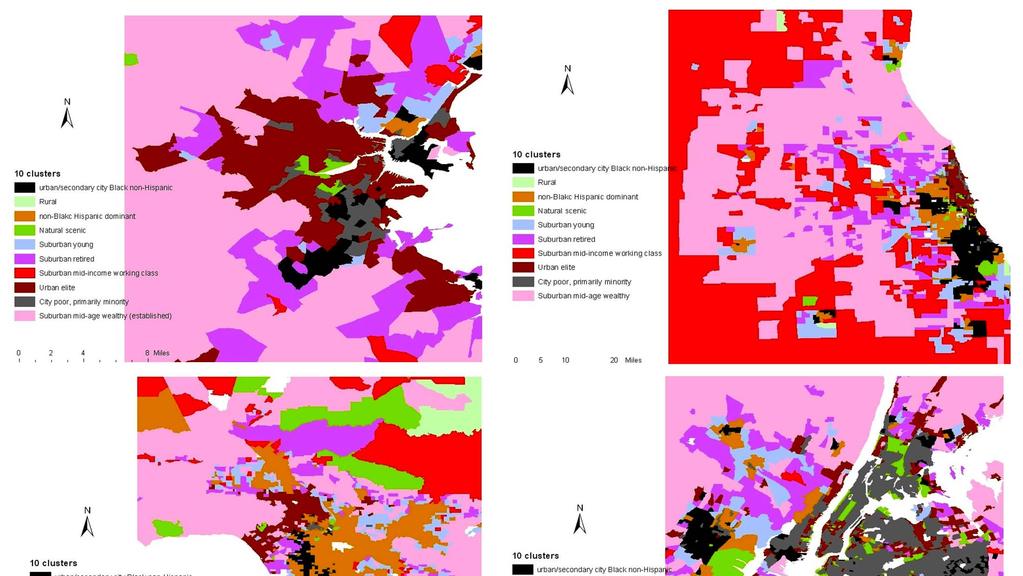
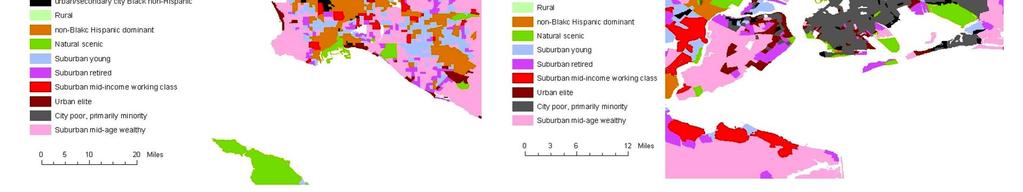
18 18

 BG level")
19 Clustering of 11 states at (a) CT and (b) BG level 19
20 Assign NHTS households to neighborhood types Neighborhood type Number of Households % of valid cases % of Total Urban elite Urban/2 nd city poor non-hispanic Black dominant City low income primarily minority Suburban mid-income working class Suburban mid-age wealthy Suburban young Suburban retired Rural Natural Scenic Non-Black Hispanic dominant Valid Cases Excluded Cases Total
21 Number of trips per household adults no children 2+ adults retired no children One adult youngest child 0-5 One adult youngest child 6-15 One adult youngest child adult youngest child adults youngest child adults youngest child urban elite Urban/2nd city poor non-hispanic Black dominant City low income primarily minority Suburban mid-income working class Suburban mid-age wealthy Suburban young Suburban retired Rural non-black Hispanic dominant Natural Scenic household trip rate One adult no children One adult retired no children
22 Household mode share #vehicles/ person Auto (%) Walk (%) Local transit (%) Bicycle (%) Urban elite Urban/2 nd city poor non Hispanic Black dominant City low income primarily minority Suburban mid-income working class Suburban mid-age wealthy Suburban young Suburban retired Rural Other (%) Non-Black Hispanic dominant Natural scenic
23 Travel time and distance Travel time (minutes) To work To School Shopping Trip distance (miles) Travel time (minutes) Trip distance (miles) Travel time (minutes) Trip distance (miles) Urban elite Urban/2nd city poor non-hispanic Black City low income primarily minority Suburban midincome working class Suburban mid-age wealthy Suburban young Suburban retired Rural non-black Hispanic dominant Natural scenic
24 Hierarchical modeling using NHTS (1) 14 MSAs/CMSAs with population greater than 3 million NHTS MSA/CMSA code MSA/CMSA name 0520 Atlanta GA 1122 Boston-Worcester-Lawrence MA-NH-ME-CT 1602 Chicago-Gary-Kenosha IL-IN-WI 1922 Dallas-Fort Worth TX 2162 Detroit-Ann Arbor-Flint MI 3362 Houston-Galveston-Brazoria TX 4472 Los Angeles-Riverside-Orange County CA 4992 Miami-Fort Lauderdale FL 5602 New York- Northern New Jersey-Long Island NY-NJ-CT-PA 6162 Philadelphia-Wilmington-Atlantic City PA-NJ-DE-MD 6200 Phoenix-Mesa AZ 7362 San Francisco-Oakland-San Jose CA 7602 Seattle-Tacoma-Bremerton WA 8872 Washington-Baltimore DC-MD-VA-WV 24
25 Hierarchical modeling using NHTS (2) Dependent variable: root square household auto work trips Neighborhood background attributes Sixty-four variables Household variables Name of the variable HHSIZE HHVEHCNT DRVRCNT NUMKID NUMADLT LOWINC Household size Household number of vehicles Household number of drivers Household number of kids Household number of adults Description Household is a low income household (LOWINC=1 i.e. household income less than $45000 a year) otherwise 0 WHITE Household head is White (WHITE=1) otherwise 0 COLLEGE Household head has college degree (COLLEGE=1) otherwise 0 N_HOWN Household owns a house (N_HOWN=1) otherwise 0 25
26 Hierarchical modeling results Models were fitted across the 14 MSAs/CMSAs by neighborhood type Only three are presented here Suburban retired Urban elite Suburban wealthy 26
27 Fixed effects (1) yˆ m i ˆ 00 ˆ 0 q wm0 q ˆ k0 ˆ k q wm k q xm i k ˆ q k q j m j z m i j a. Suburban retired (obs = 759) -2 Res Log Likelihood = Effect Estimate Standard Error t value Pr > t Intercept < Housing density (w 1 ) Percent population with age 75 years and older (w 2 ) Number of kids (x 1 ) Housing density * number of kids (w 1 *x 1 ) 1.018E Percent population with age 75 years and older*number of kids (w 2 *x 1 ) Low income (z 1 ) Owned house (z 2 )
28 Fixed effects (2) b. Urban elite (obs = 552) -2 Res Log Likelihood = Effect Estimate Standard Error t value Pr > t Intercept < Worker density (w 1 ) E Intersection density (w 2 ) Average auto work trip travel time (w 3 ) Household size (x 1 ) Household number of vehicles (x 2 ) Worker density*household size (w 1 *x 1 ) 6.297E E Intersection density*household size (w 2 *x 1 ) Average auto work trip travel time*household size (w 3 *x 1 ) Worker density*household number of vehicles E (w 1 *x 2 ) Intersection density*household number of vehicles (w 2 *x 2 ) Average auto work trip travel time*household number of vehicles (w 3 *x 2 ) <
29 Fixed effects (3) c. Suburban mid-age wealthy (obs = 2669) -2 Res Log Likelihood = Effect Estimate Standard Error t value Pr > t Intercept < Average auto work trip travel time (w 1 ) Number of kids (x 1 ) Number of household vehicles (x 2 ) < Average auto work trip travel time*number of kids (w 1 * x 1 ) Average auto work trip travel time*number of household vehicles (w 1 * x 2 ) Low income (z 1 )


30 Random effects: suburban retired 30


31 Random effects: urban elite 31

32 Random effects: suburban wealthy 32
33 Conclusions We have showed that transferability can be formulated into a two-level random coefficient model and thus transferability can be statistically tested. Transferability is affected not only by the internal household characteristics but also the surrounding environment. Neighborhood approach allows us to test that The case study of transferability across the fourteen MSAs/CMSAs showed that in general the coefficient variability across geographic areas can be ignored. But there are exceptions. The model results also confirm the influence of neighborhood specific features on travel behavior of the households living within 33
34 Limitations We assembled a set of household and neighborhood variables available to us for the modeling Do they meet the minimum model specification? It is important to keep in mind when interpreting the model results that the model does not explain the causal relationships between the dependent variable and covariates. Only household auto work trip rates were examined. Different conclusions may be drawn for other measures such as mode share and number of shopping trips. 34
35 Acknowledgement This study is part of the transferability study funded by the Federal Highway Administration (FHWA). 35
36 Thank you! 36
37 Cluster Selection Criteria Number of Schwarz's Bayesian Clusters Criterion (BIC) BIC Change a Ratio of BIC Changes b Ratio of Distance Measures c
38 Travel time and distance Travel time (minutes) To work To School Shopping Trip distance (miles) Travel time (minutes) Trip distance (miles) Travel time (minutes) Trip distance (miles) Mean Std dev Mean Std dev Mean Std dev Mean Std dev Mean Std dev Mean Std dev Urban elite Urban/2nd city poor non- Hispanic Black City low income primarily minority Suburban midincome working class Suburban midage wealthy Suburban young Suburban retired Rural non-black Hispanic dominant Natural scenic
2/25/2019. Taking the northern and southern hemispheres together, on average the world s population lives 24 degrees from the equator.
 Where is the world s population? Roughly 88 percent of the world s population lives in the Northern Hemisphere, with about half north of 27 degrees north Taking the northern and southern hemispheres together,
Speed. June Victor Couture (U. Toronto) Gilles Duranton (U. Toronto) Matt Turner (U. Toronto)
 Gilles Duranton (U. Toronto) Matt Turner (U. Toronto)") Speed June 2012 Victor Couture (U. Toronto) Gilles Duranton (U. Toronto) Matt Turner (U. Toronto) Objectives: Assess differences in driving speed across us metropolitan areas Explore their determinants
Speed June 2012 Victor Couture (U. Toronto) Gilles Duranton (U. Toronto) Matt Turner (U. Toronto) Objectives: Assess differences in driving speed across us metropolitan areas Explore their determinants
Using Census Public Use Microdata Areas (PUMAs) as Primary Sampling Units in Area Probability Household Surveys
 as Primary Sampling Units in Area Probability Household Surveys") Using Census Public Use Microdata Areas (PUMAs) as Primary Sampling Units in Area Probability Household Surveys Joe McMichael, Patrick Chen RTI International, 1 3040 Cornwallis Road, Research Triangle
Using Census Public Use Microdata Areas (PUMAs) as Primary Sampling Units in Area Probability Household Surveys Joe McMichael, Patrick Chen RTI International, 1 3040 Cornwallis Road, Research Triangle
Vibrancy and Property Performance of Major U.S. Employment Centers. Appendix A
 Appendix A DOWNTOWN VIBRANCY SCORES Atlanta 103.3 Minneapolis 152.8 Austin 112.3 Nashville 83.5 Baltimore 151.3 New Orleans 124.3 Birmingham 59.3 New York Midtown 448.6 Charlotte 94.1 Oakland 157.7 Chicago
Can Public Transport Infrastructure Relieve Spatial Mismatch?
 Can Public Transport Infrastructure Relieve Spatial Mismatch? Evidence from Recent Light Rail Extensions Kilian Heilmann University of California San Diego April 20, 2015 Motivation Paradox: Even though
Urban Revival in America
 Urban Revival in America Victor Couture 1 Jessie Handbury 2 1 University of California, Berkeley 2 University of Pennsylvania and NBER May 2016 1 / 23 Objectives 1. Document the recent revival of America
Spatiotemporal Analysis of Commuting Patterns in Southern California Using ACS PUMS, CTPP and LODES
 Spatiotemporal Analysis of Commuting Patterns in Southern California Using ACS PUMS, CTPP and LODES 2017 ACS Data Users Conference May 11-12, 2017 Alexandria, VA Jung Seo, Tom Vo, Frank Wen and Simon Choi
Impact of Metropolitan-level Built Environment on Travel Behavior
 Impact of Metropolitan-level Built Environment on Travel Behavior Arefeh Nasri 1 and Lei Zhang 2,* 1. Graduate Research Assistant; 2. Assistant Professor (*Corresponding Author) Department of Civil and
FHWA Planning Data Resources: Census Data Planning Products (CTPP) HEPGIS Interactive Mapping Portal
 HEPGIS Interactive Mapping Portal") FHWA Planning Data Resources: Census Data Planning Products (CTPP) HEPGIS Interactive Mapping Portal Jeremy Raw, P.E. FHWA, Office of Planning, Systems Planning and Analysis August 2017 Outline Census
FHWA Planning Data Resources: Census Data Planning Products (CTPP) HEPGIS Interactive Mapping Portal Jeremy Raw, P.E. FHWA, Office of Planning, Systems Planning and Analysis August 2017 Outline Census
The impact of residential density on vehicle usage and fuel consumption*
 The impact of residential density on vehicle usage and fuel consumption* Jinwon Kim and David Brownstone Dept. of Economics 3151 SSPA University of California Irvine, CA 92697-5100 Email: dbrownst@uci.edu
Non-Parametric Two-Sample Analysis: The Mann-Whitney U Test
 Non-Parametric Two-Sample Analysis: The Mann-Whitney U Test When samples do not meet the assumption of normality parametric tests should not be used. To overcome this problem, non-parametric tests can
North American Geography. Lesson 5: Barnstorm Like a Tennis Player!
 North American Geography Lesson 5: Barnstorm Like a Tennis Player! Unit Overview: As students work through the activities in this unit they will be introduced to the United States in general, different
Medical GIS: New Uses of Mapping Technology in Public Health. Peter Hayward, PhD Department of Geography SUNY College at Oneonta
 Medical GIS: New Uses of Mapping Technology in Public Health Peter Hayward, PhD Department of Geography SUNY College at Oneonta Invited research seminar presentation at Bassett Healthcare. Cooperstown,
Spatial and Socioeconomic Analysis of Commuting Patterns in Southern California Using LODES, CTPP, and ACS PUMS
 Spatial and Socioeconomic Analysis of Commuting Patterns in Southern California Using LODES, CTPP, and ACS PUMS Census for Transportation Planning Subcommittee meeting TRB 95th Annual Meeting January 11,
Using the ACS to track the economic performance of U.S. inner cities
 Using the ACS to track the economic performance of U.S. inner cities 2017 ACS Data Users Conference May 11, 2017 Austin Nijhuis, Senior Research Analyst Initiative for a Competitive Inner (ICIC) ICIC ICIC
Effective Use of Geographic Maps
 Effective Use of Geographic Maps Purpose This tool provides guidelines and tips on how to effectively use geographic maps to communicate research findings. Format This tool provides guidance on geographic
Transferability of Household Travel Data Across Neighborhood Types and Geographic Areas Using NHTS
 Transferability of Household Travel Data Across Neighborhood Types and Geographic Areas Using NHTS Jie Lin a* Liang Long b a Departent of Civil and Materials Engineering, & Institute of Environental Science
AGEC 603. Stylized Cited Assumptions. Urban Density. Urban Density and Structures. q = a constant density the same throughout
 AGEC 603 Urban Density and Structures Stylized Cited Assumptions q = a constant density the same throughout c = constant structures the same throughout Reality housing is very heterogeneous Lot size varies
The Impact of Residential Density on Vehicle Usage and Fuel Consumption: Evidence from National Samples
 The Impact of Residential Density on Vehicle Usage and Fuel Consumption: Evidence from National Samples Jinwon Kim Department of Transport, Technical University of Denmark and David Brownstone 1 Department
Research Update: Race and Male Joblessness in Milwaukee: 2008
 Research Update: Race and Male Joblessness in Milwaukee: 2008 by: Marc V. Levine University of Wisconsin Milwaukee Center for Economic Development Briefing Paper September 2009 Overview Over the past decade,
Figure 8.2a Variation of suburban character, transit access and pedestrian accessibility by TAZ label in the study area
 Figure 8.2a Variation of suburban character, transit access and pedestrian accessibility by TAZ label in the study area Figure 8.2b Variation of suburban character, commercial residential balance and mix
Spatiotemporal Analysis of Commuting Patterns: Using ArcGIS and Big Data
 Spatiotemporal Analysis of Commuting Patterns: Using ArcGIS and Big Data 2017 ESRI User Conference July 13, 2017 San Diego, VA Jung Seo, Tom Vo, Frank Wen and Simon Choi Research & Analysis Southern California
Hotel Industry Overview. UPDATE: Trends and outlook for Northern California. Vail R. Brown
 Hotel Industry Overview UPDATE: Trends and outlook for Northern California Vail R. Brown Senior Vice President, Global Business Development & Marketing vbrown@str.com @vail_str 2016 STR, Inc. All Rights
A Joint Tour-Based Model of Vehicle Type Choice and Tour Length
 A Joint Tour-Based Model of Vehicle Type Choice and Tour Length Ram M. Pendyala School of Sustainable Engineering & the Built Environment Arizona State University Tempe, AZ Northwestern University, Evanston,
Lesson 1 - Pre-Visit Safe at Home: Location, Place, and Baseball
 Lesson 1 - Pre-Visit Safe at Home: Location, Place, and Baseball Objective: Students will be able to: Define location and place, two of the five themes of geography. Give reasons for the use of latitude
Speakers: Jeff Price, Federal Transit Administration Linda Young, Center for Neighborhood Technology Sofia Becker, Center for Neighborhood Technology
 Speakers: Jeff Price, Federal Transit Administration Linda Young, Center for Neighborhood Technology Sofia Becker, Center for Neighborhood Technology Peter Haas, Center for Neighborhood Technology Craig
Evolution Strategies for Optimizing Rectangular Cartograms
 Evolution Strategies for Optimizing Rectangular Cartograms Kevin Buchin 1, Bettina Speckmann 1, and Sander Verdonschot 2 1 TU Eindhoven, 2 Carleton University September 20, 2012 Sander Verdonschot (Carleton
Geospatial Analysis of Job-Housing Mismatch Using ArcGIS and Python
 Geospatial Analysis of Job-Housing Mismatch Using ArcGIS and Python 2016 ESRI User Conference June 29, 2016 San Diego, CA Jung Seo, Frank Wen, Simon Choi and Tom Vo, Research & Analysis Southern California
DEVELOPING DECISION SUPPORT TOOLS FOR THE IMPLEMENTATION OF BICYCLE AND PEDESTRIAN SAFETY STRATEGIES
 DEVELOPING DECISION SUPPORT TOOLS FOR THE IMPLEMENTATION OF BICYCLE AND PEDESTRIAN SAFETY STRATEGIES Deo Chimba, PhD., P.E., PTOE Associate Professor Civil Engineering Department Tennessee State University
The Elusive Connection between Density and Transit Use
 The Elusive Connection between Density and Transit Use Abstract: The connection between density and transportation is heralded by planners, yet results are often elusive. This paper analyzes two regions,
Employment Decentralization and Commuting in U.S. Metropolitan Areas. Symposium on the Work of Leon Moses
 Employment Decentralization and Commuting in U.S. Metropolitan Areas Alex Anas Professor of Economics University at Buffalo Symposium on the Work of Leon Moses February 7, 2014 9:30-11:15am, and 2:30-4:30pm
Travel behavior of low-income residents: Studying two contrasting locations in the city of Chennai, India
 Travel behavior of low-income residents: Studying two contrasting locations in the city of Chennai, India Sumeeta Srinivasan Peter Rogers TRB Annual Meet, Washington D.C. January 2003 Environmental Systems,
Jobs-Housing Fit: Linking Housing Affordability and Local Wages
 Jobs-Housing Fit: Linking Housing Affordability and Local Wages Alex Karner, PhD Assistant Professor School of City and Regional Planning Georgia Institute of Technology Chris Benner, PhD Dorothy E. Everett
1Department of Demography and Organization Studies, University of Texas at San Antonio, One UTSA Circle, San Antonio, TX
 Well, it depends on where you're born: A practical application of geographically weighted regression to the study of infant mortality in the U.S. P. Johnelle Sparks and Corey S. Sparks 1 Introduction Infant
Access Across America: Transit 2016
 Access Across America: Transit 2016 Final Report Prepared by: Andrew Owen Brendan Murphy Accessibility Observatory Center for Transportation Studies University of Minnesota David Levinson School of Civil
Authors: Antonella Zanobetti and Joel Schwartz
 Title: Mortality Displacement in the Association of Ozone with Mortality: An Analysis of 48 US Cities Authors: Antonella Zanobetti and Joel Schwartz ONLINE DATA SUPPLEMENT Additional Information on Materials
Density and Walkable Communities
 Density and Walkable Communities Reid Ewing Professor & Chair City and Metropolitan Planning University of Utah ewing@arch.utah.edu Department of City & Metropolitan Planning, University of Utah MRC Research
Developing the Transit Demand Index (TDI) Gregory Newmark, Regional Transportation Authority Transport Chicago Presentation July 25, 2012
 Gregory Newmark, Regional Transportation Authority Transport Chicago Presentation July 25, 2012") Developing the Transit Demand Index (TDI) Gregory Newmark, Regional Transportation Authority Transport Chicago Presentation July 25, 2012 Outline Present RTA methodology Transit Demand Index (TDI) Demonstrate
Developing the Transit Demand Index (TDI) Gregory Newmark, Regional Transportation Authority Transport Chicago Presentation July 25, 2012 Outline Present RTA methodology Transit Demand Index (TDI) Demonstrate
Census Transportation Planning Products (CTPP)
") Census Transportation Planning Products (CTPP) Penelope Weinberger CTPP Program Manager - AASHTO September 15, 2010 1 What is the CTPP Program Today? The CTPP is an umbrella program of data products, custom
Census Transportation Planning Products (CTPP) Penelope Weinberger CTPP Program Manager - AASHTO September 15, 2010 1 What is the CTPP Program Today? The CTPP is an umbrella program of data products, custom
Equity, Accessibility and Transit Use in large American cities
 Equity, Accessibility and Transit Use in large American cities Submitted: 1 August 2004 Word Count: 4600 + 1500 = 6100 Murtaza Haider, Ph.D. McGill University, School of Urban Planning 815 Sherbrooke St.
Environmental Analysis, Chapter 4 Consequences, and Mitigation
 Environmental Analysis, Chapter 4 4.17 Environmental Justice This section summarizes the potential impacts described in Chapter 3, Transportation Impacts and Mitigation, and other sections of Chapter 4,
Economic and Social Urban Indicators: A Spatial Decision Support System for Chicago Area Transportation Planning
 Economic and Social Urban Indicators: A Spatial Decision Support System for Chicago Area Transportation Planning Piyushimita Thakuriah (Vonu), P.S. Sriraj, Paul Metaxatos, Inshu Minocha & Tanushri Swarup
StanCOG Transportation Model Program. General Summary
 StanCOG Transportation Model Program Adopted By the StanCOG Policy Board March 17, 2010 What are Transportation Models? General Summary Transportation Models are technical planning and decision support
BROOKINGS May
 Appendix 1. Technical Methodology This study combines detailed data on transit systems, demographics, and employment to determine the accessibility of jobs via transit within and across the country s 100
NAWIC. National Association of Women in Construction. Membership Report. August 2009
 NAWIC National Association of Women in Construction Membership Report August 2009 Core Purpose: To enhance the success of women in the construction industry Region 1 67 Gr Washington, DC 9 16 2 3 1 0 0
Access Across America: Transit 2017
 Access Across America: Transit 2017 Final Report Prepared by: Andrew Owen Brendan Murphy Accessibility Observatory Center for Transportation Studies University of Minnesota CTS 18-12 1. Report No. CTS
Multiway Analysis of Bridge Structural Types in the National Bridge Inventory (NBI) A Tensor Decomposition Approach
 A Tensor Decomposition Approach") Multiway Analysis of Bridge Structural Types in the National Bridge Inventory (NBI) A Tensor Decomposition Approach By Offei A. Adarkwa Nii Attoh-Okine (Ph.D) (IEEE Big Data Conference -10/27/2014) 1 Presentation
Multiway Analysis of Bridge Structural Types in the National Bridge Inventory (NBI) A Tensor Decomposition Approach By Offei A. Adarkwa Nii Attoh-Okine (Ph.D) (IEEE Big Data Conference -10/27/2014) 1 Presentation
Visualization of Commuter Flow Using CTPP Data and GIS
 Visualization of Commuter Flow Using CTPP Data and GIS Research & Analysis Department Southern California Association of Governments 2015 ESRI User Conference l July 23, 2015 l San Diego, CA Jung Seo,
Spatial Disparities in the Distribution of Parks and Green Spaces in the United States
 March 11 th, 2012 Active Living Research Conference Spatial Disparities in the Distribution of Parks and Green Spaces in the United States Ming Wen, Ph.D., University of Utah Xingyou Zhang, Ph.D., CDC
Understanding Land Use and Walk Behavior in Utah
 Understanding Land Use and Walk Behavior in Utah 15 th TRB National Transportation Planning Applications Conference Callie New GIS Analyst + Planner STUDY AREA STUDY AREA 11 statistical areas (2010 census)
ADDRESSING TITLE VI AND ENVIRONMENTAL JUSTICE IN LONG-RANGE TRANSPORTATION PLANS
 ADDRESSING TITLE VI AND ENVIRONMENTAL JUSTICE IN LONG-RANGE TRANSPORTATION PLANS Activities from the National Capital Region Transportation Planning Board Sergio Ritacco Transportation Planner 2017 Association
Inter and Intra Buffer Variability: A Case Study Using Scale
 Georgia State University ScholarWorks @ Georgia State University Art and Design Faculty Publications Ernest G. Welch School of Art and Design 2015 Inter and Intra Buffer Variability: A Case Study Using
Modeling Land Use Change Using an Eigenvector Spatial Filtering Model Specification for Discrete Response
 Modeling Land Use Change Using an Eigenvector Spatial Filtering Model Specification for Discrete Response Parmanand Sinha The University of Tennessee, Knoxville 304 Burchfiel Geography Building 1000 Phillip
The effects of impact fees on urban form and congestion in Florida
 The effects of impact fees on urban form and congestion in Florida Principal Investigators: Andres G. Blanco Ruth Steiner Presenters: Hyungchul Chung Jeongseob Kim Urban and Regional Planning Contents
Geography and Usability of the American Community Survey. Seth Spielman Assistant Professor of Geography University of Colorado
 Geography and Usability of the American Community Survey Seth Spielman Assistant Professor of Geography University of Colorado Goals 1. To convince you that the margins of error from the American Community
Missed Opportunity: Transit and Jobs in Metropolitan America
 METROPOLITAN INFRASTRUCTURE INITIATIVE SERIES AND METROPOLITAN OPPORTUNITY SERIES Missed Opportunity: Transit and Jobs in Metropolitan America Adie Tomer, Elizabeth Kneebone, Robert Puentes, and Alan Berube
Encapsulating Urban Traffic Rhythms into Road Networks
 Encapsulating Urban Traffic Rhythms into Road Networks Junjie Wang +, Dong Wei +, Kun He, Hang Gong, Pu Wang * School of Traffic and Transportation Engineering, Central South University, Changsha, Hunan,
What Lies Beneath: A Sub- National Look at Okun s Law for the United States.
 What Lies Beneath: A Sub- National Look at Okun s Law for the United States. Nathalie Gonzalez Prieto International Monetary Fund Global Labor Markets Workshop Paris, September 1-2, 2016 What the paper
Where Transit Use Is Growing: Surprising Results
 Where Transit Use Is Growing: Surprising Results Gregory L. Thompson, Jeffrey R. Brown, Rupa Sharma, and Samuel Scheib Florida State University Abstract This article investigates whether transit s fate
Trends in Metropolitan Network Circuity
 Trends in Metropolitan Network Circuity David J. Giacomin Luke S. James David M. Levinson Abstract Because people seek to minimize their time and travel distance (or cost) when commuting, the circuity
APPENDIX C-3 Equitable Target Areas (ETA) Technical Analysis Methodology
 Technical Analysis Methodology") APPENDIX C-3 Equitable Target Areas (ETA) Technical Analysis Methodology Contents Introduction... 1 ETA Index Methodology... 1 ETA Index Development... 1 Other EJ Measures... 4 The Limited English Proficiency
APPENDIX C-3 Equitable Target Areas (ETA) Technical Analysis Methodology Contents Introduction... 1 ETA Index Methodology... 1 ETA Index Development... 1 Other EJ Measures... 4 The Limited English Proficiency
GIS Analysis of Crenshaw/LAX Line
 PDD 631 Geographic Information Systems for Public Policy, Planning & Development GIS Analysis of Crenshaw/LAX Line Biying Zhao 6679361256 Professor Barry Waite and Bonnie Shrewsbury May 12 th, 2015 Introduction
SAMPLE AUDIT FORMAT. Pre Audit Notification Letter Draft. Dear Registrant:
 Pre Audit Notification Letter Draft Dear Registrant: The Pennsylvania Department of Transportation (PennDOT) is a member of the Federally Mandated International Registration Plan (IRP). As part of this
Developing and Validating Regional Travel Forecasting Models with CTPP Data: MAG Experience
 CTPP Webinar and Discussion Thursday, July 17, 1-3pm EDT Developing and Validating Regional Travel Forecasting Models with CTPP Data: MAG Experience Kyunghwi Jeon, MAG Petya Maneva, MAG Vladimir Livshits,
Parametric Test. Multiple Linear Regression Spatial Application I: State Homicide Rates Equations taken from Zar, 1984.
 Multiple Linear Regression Spatial Application I: State Homicide Rates Equations taken from Zar, 984. y ˆ = a + b x + b 2 x 2K + b n x n where n is the number of variables Example: In an earlier bivariate
Service Area Analysis of Portland's METRO Bus System. Andy Smith-Petersen, University of Southern Maine -
 Andy Smith-Petersen, University of Southern Maine - andysp@usm.maine.edu METRO Background 8 routes serving Portland, South Portland, Falmouth and Westbrook 100,000+ passengers/month, +11% 1997-2005 (GPCOG/METRO,
REFINEMENT OF FSUTMS TRIP DISTRIBUTION METHODOLOGY
 REFINEMENT OF FSUTMS TRIP DISTRIBUTION METHODOLOGY Percentage of Trips (%) 10.00 9.00 8.00 7.00 6.00 5.00 4.00 3.00 2.00 1.00 Survey Destination Choice Model with Spatial Variables Destination Choice Model
California Urban Infill Trip Generation Study. Jim Daisa, P.E.
 California Urban Infill Trip Generation Study Jim Daisa, P.E. What We Did in the Study Develop trip generation rates for land uses in urban areas of California Establish a California urban land use trip
Scaling in Biology. How do properties of living systems change as their size is varied?
 Scaling in Biology How do properties of living systems change as their size is varied? Example: How does basal metabolic rate (heat radiation) vary as a function of an animal s body mass? Mouse Hamster
C Further Concepts in Statistics
 Appendix C.1 Representing Data and Linear Modeling C1 C Further Concepts in Statistics C.1 Representing Data and Linear Modeling Use stem-and-leaf plots to organize and compare sets of data. Use histograms
Use of US Census Data for Transportation Modeling and Planning
 Use of US Census Data for Transportation Modeling and Planning Yongqiang Wu, P.E. CTS Engineering, Inc. Southeast Florida FSUTMS User Group Meeting September 14, 2018 Outline Overview of Census Products
Cambridge Systematics, Inc., New York, NY, Associate, Cambridge Systematics, Inc., New York, NY, Senior Professional,
 Xia Jin, Ph.D., AICP Assistant Professor, Transportation Engineering Department of Civil and Environmental Engineering, EC 3603, Florida International University 10555 W Flagler St., Miami, FL 33174. Phone:
SBCAG Travel Model Upgrade Project 3rd Model TAC Meeting. Jim Lam, Stewart Berry, Srini Sundaram, Caliper Corporation December.
 SBCAG Travel Model Upgrade Project 3rd Model TAC Meeting Jim Lam, Stewart Berry, Srini Sundaram, Caliper Corporation December. 7, 2011 1 Outline Model TAZs Highway and Transit Networks Land Use Database
SHSU ECONOMICS WORKING PAPER
 Sam Houston State University Department of Economics and International Business Working Paper Series Unbiased Estimation of the Half-Life to Price Index Convergence among US Cities Hiranya K Nath and Jayanta
Typical information required from the data collection can be grouped into four categories, enumerated as below.
 Chapter 6 Data Collection 6.1 Overview The four-stage modeling, an important tool for forecasting future demand and performance of a transportation system, was developed for evaluating large-scale infrastructure
Colm O Muircheartaigh
 THERE AND BACK AGAIN: DEMOGRAPHIC SURVEY SAMPLING IN THE 21 ST CENTURY Colm O Muircheartaigh, University of Chicago Page 1 OVERVIEW History of Demographic Survey Sampling 20 th Century Sample Design New
Data Collection. Lecture Notes in Transportation Systems Engineering. Prof. Tom V. Mathew. 1 Overview 1
 Data Collection Lecture Notes in Transportation Systems Engineering Prof. Tom V. Mathew Contents 1 Overview 1 2 Survey design 2 2.1 Information needed................................. 2 2.2 Study area.....................................
Modeling Mode in a Statewide Context
 Modeling Mode in a Statewide Context CDM Smith ADOT Transportation Planning Applications Conference May 6, 2013 Presentation Overview Development Team AZTDM3 Overview AZTDM3 Modes of Travel Transit Abstraction
Adapting an Existing Activity Based Modeling Structure for the New York Region
 Adapting an Existing Activity Based Modeling Structure for the New York Region presented to 2018 TRB Innovations in Travel Modeling Conference Attendees presented by Rachel Copperman Jason Lemp with Thomas
H. R heading to fund the award and oversight by the Administrator of grants made under this heading. FEDERAL HIGHWAY ADMINISTRATION
 H. R. 1 92 heading to fund the award and oversight by the Administrator of grants made under this heading. FEDERAL HIGHWAY ADMINISTRATION HIGHWAY INFRASTRUCTURE INVESTMENT For an additional amount for
Identifying transit deserts in major Texas cities where the supplies missed the demands
 THE JOURNAL OF TRANSPORT AND LAND USE http://jtlu.org VOL. 10 NO. 1 [2017] pp. 529 540 Identifying transit deserts in major Texas cities where the supplies missed the demands Junfeng Jiao The University
Nursing Facilities' Life Safety Standard Survey Results Quarterly Reference Tables
 Nursing Facilities' Life Safety Standard Survey Results Quarterly Reference Tables Table of Contents Table 1: Summary of Life Safety Survey Results by State Table 2: Ten Most Frequently Cited Life Safety
COMMUTING ANALYSIS IN A SMALL METROPOLITAN AREA: BOWLING GREEN KENTUCKY
 Papers of the Applied Geography Conferences (2007) 30: 86-95 COMMUTING ANALYSIS IN A SMALL METROPOLITAN AREA: BOWLING GREEN KENTUCKY Caitlin Hager Jun Yan Department of Geography and Geology Western Kentucky
National Household Travel Survey Conference: Understanding Our Nation s Travel
 Transportation Research Board National Household Travel Survey Conference: Understanding Our Nation s Travel Resource Paper Household Travel Survey Data Fusion Issues Mohan Venigalla George Mason University
Internal Capture in Mixed-Use Developments (MXDs) and Vehicle Trip and Parking Reductions in Transit-Oriented Developments (TODs)
 and Vehicle Trip and Parking Reductions in Transit-Oriented Developments (TODs)") Internal Capture in Mixed-Use Developments (MXDs) and Vehicle Trip and Parking Reductions in Transit-Oriented Developments (TODs) Reid Ewing City and Metropolitan Planning University of Utah ewing@arch.utah.edu
Internal Capture in Mixed-Use Developments (MXDs) and Vehicle Trip and Parking Reductions in Transit-Oriented Developments (TODs) Reid Ewing City and Metropolitan Planning University of Utah ewing@arch.utah.edu
Geodatabase for Sustainable Urban Development. Presented By Rhonda Maronn Maurice Johns Daniel Ashney Jack Anliker
 Geodatabase for Sustainable Urban Development Presented By Rhonda Maronn Maurice Johns Daniel Ashney Jack Anliker Objective Build a Geodatabase that will enable urban planners to create and assess the
Local Economic Activity Around Rapid Transit Stations
 Local Economic Activity Around Rapid Transit Stations The Case of Chicago s Orange Line Julie Cooper, MPP 2014 Harris School of Public Policy Transport Chicago June 6, 2014 Motivation Impacts of transit
ARIC Manuscript Proposal # PC Reviewed: _9/_25_/06 Status: A Priority: _2 SC Reviewed: _9/_25_/06 Status: A Priority: _2
 ARIC Manuscript Proposal # 1186 PC Reviewed: _9/_25_/06 Status: A Priority: _2 SC Reviewed: _9/_25_/06 Status: A Priority: _2 1.a. Full Title: Comparing Methods of Incorporating Spatial Correlation in
Updating the Urban Boundary and Functional Classification of New Jersey Roadways using 2010 Census data
 Updating the Urban Boundary and Functional Classification of New Jersey Roadways using 2010 Census data By: Glenn Locke, GISP, PMP 1 GIS-T May, 2013 Presentation Overview Purpose of Project Methodology
Activity-Based Models and ACS Data: What are the implications for use? D.A. Niemeier
 Activity-Based Models and ACS Data: What are the implications for use? D.A. Niemeier Introduction The Census is transitioning to the American Community Survey (ACS) for replacement of the decennial census
Smart Growth: Threat to the Quality of Life. Experience
 Smart Growth: Threat to the Quality of Life Presentation by Wendell Cox Wendell Cox Consultancy Visiting Professor Conservatoire National des Arts et Metiers Paris Frontier Centre for Public Policy Winnipeg
A Simplified Travel Demand Modeling Framework: in the Context of a Developing Country City
 A Simplified Travel Demand Modeling Framework: in the Context of a Developing Country City Samiul Hasan Ph.D. student, Department of Civil and Environmental Engineering, Massachusetts Institute of Technology,
2040 MTP and CTP Socioeconomic Data
 SE Data 6-1 24 MTP and CTP Socioeconomic Data Purpose of Socioeconomic Data The socioeconomic data (SE Data) shows the location of the population and employment, median household income and other demographic
MEASURING RACIAL RESIDENTIAL SEGREGATION
 MEASURING RACIAL RESIDENTIAL SEGREGATION Race Relations Institute Fisk University 1000 Seventeenth Ave. North Nashville, Tennessee 37208 615/329-8575 WHERE WE LIVE: THE COLOR LINE The color line is carved
Module 10 Summative Assessment
 Module 10 Summative Assessment Activity In this activity you will use the three dimensions of vulnerability that you learned about in this module exposure, sensitivity, and adaptive capacity to assess
GIS-Based Analysis of the Commuting Behavior and the Relationship between Commuting and Urban Form
 GIS-Based Analysis of the Commuting Behavior and the Relationship between Commuting and Urban Form 1. Abstract A prevailing view in the commuting is that commuting would reconstruct the urban form. By
Transit Service Gap Technical Documentation
 Transit Service Gap Technical Documentation Introduction This document is an accompaniment to the AllTransit TM transit gap methods document. It is a detailed explanation of the process used to develop
34 ab ArchitectureBoston
 Postmodern theorists writing in the late 20th-century once surmised that, during an era of airplanes, cell phones, and the Internet, the importance of geographical space was quickly diminishing. The French
Assessing spatial distribution and variability of destinations in inner-city Sydney from travel diary and smartphone location data
 Assessing spatial distribution and variability of destinations in inner-city Sydney from travel diary and smartphone location data Richard B. Ellison 1, Adrian B. Ellison 1 and Stephen P. Greaves 1 1 Institute
SPATIAL ANALYSIS OF URBAN BUILT ENVIRONMENTS AND VEHICLE TRANSIT BEHAVIOR. Daniel Currie Eisman
 SPATIAL ANALYSIS OF URBAN BUILT ENVIRONMENTS AND VEHICLE TRANSIT BEHAVIOR by Daniel Currie Eisman A Thesis Presented to the FACULTY OF THE USC GRADUATE SCHOOL UNIVERSITY OF SOUTHERN CALIFORNIA In Partial