Multiway Analysis of Bridge Structural Types in the National Bridge Inventory (NBI) A Tensor Decomposition Approach
|
|
|
- Merry Smith
- 5 years ago
- Views:
Transcription
1 Multiway Analysis of Bridge Structural Types in the National Bridge Inventory (NBI) A Tensor Decomposition Approach By Offei A. Adarkwa Nii Attoh-Okine (Ph.D) (IEEE Big Data Conference -10/27/2014) 1
2 Presentation Outline Introduction Basic Tensor Concepts Analysis & Results Conclusion & Recommendations 2
3 INTRODUCTION 3
4 National Bridge Inventory (NBI) Largest database of bridge data in the world 1 Information on >600,000 bridges Owned and operated by the Federal Highway Administration (FHWA) Status of a bridge: not deficient; structurally deficient; and functionally obsolete Basis for determining eligibility for Federal Bridge Funding 4

5 Structurally Deficient Bridges Structurally deficient bridges have load carrying members in poor condition or significantly below design standards Repair, rehabilitation or replacement required In the US, 1 in 9 bridges is structurally deficient Laid end to end, structurally deficient bridges will span from DC to Denver 2 * Sherman-Minton Bridge * 5
6 Effective use of bridge rehabilitation and replacement funding Need to understand deterioration patterns of bridges under varying loading and environmental conditions NBI can serve as a major resource 6
7 Focus of Research Analysis of deterioration trends of specific bridge deck structural types in the US Tensor Decomposition 7
8 BASIC TENSOR CONCEPTS 8
9 What are Tensors? Generalizations of scalars, vectors and matrices Samples variables Samples Time Time variables variables Samples Weather 9
10 Multiway data is everywhere Why Multiway Data Analysis? Capture variation in dataset while preserving multidimensional nature of data Reveal hidden patterns in data 10

11 Typical 3D dataset Subarrays Mode-3 Mode-1 Mode-2 X x 231 Mode-1 Fiber x :21 Mode-2 Fiber x 1:2 Mode-3 Fiber X 11: Horizontal slice X 1:: Lateral slice X :2: Frontal slice X ::3 11


12 Matricization (Unfolding) Summation: A + B = C, where C iii = a iii + b iii k i χ R i jj i j j j j Outer Product: X = a ο b ο c s.t. x iii = a i b j c k j k Khatri-Rao Product: P I J Q K J = R II J k i χ R j ii j i i i i Kronecker Product: P I J Q K L = R II JJ k i j χ R k ii k k i i i i Hadamard Product: P I J Q I J = R I J j j 12
13 Tensor Decomposition Reducing data to lower-order forms for analysis (classification, prediction, clustering) 2 main approaches Canonical decomposition/parallel Factors (CANDECOMP/PARAFAC; CP) Tucker decomposition 13
14 The CP Decomposition Canonical Decomposition/ Parallel Factors a i, b i and c i - factor loadings R- number of components Rank of a tensor=min (R) required to approximate X 14
15 Choosing the appropriate CP model Alternating Least Squares Approach (ALS) Where is the PARAFAC model % Variance Explained Core Consistency Diagnostic (CORCONDIAG) High CORCONDIAG stable model Low CORCONDIAG invalid and/or problematic model 15
16 ANALYSIS & RESULTS 16
17 Where: Structural Deterioration Rate SS i,j,k = n i,j,k N i,j,k j SS i,j,k =structural deterioration rate in state i of structure type j in year k n i,j,k =number of structurally deficient bridges in state i of structure type j in year k N i,j,k =number of bridges in state i of structure type j in year k 17

18 NBI database ( ) Dataset Structurally deficient bridge design types by state Year State Deck Type Multidimensional Dataset for analysis 18


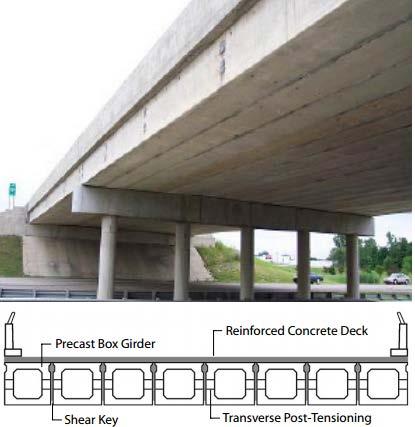
19 Selected Bridge Design Types Girder and Floorbeam 4 Slab 5 Stringer/Multibeam 6 Arch Deck 7 Tee Beam 8 Box Beam 9 19
")
20 3D visualization 0,9 0,8 0,7 0,6 0,5 0,4 0,3 0,2 0,1 0 PR WY WI WV WA VA VT UT TX TN SD SC RI PA OR OK OH ND NC NY NM NJ NH NV NE MT MO MS MN MI MD ME MA LA KY KS IA IN IL ID HI GA FL AK AL AR AZ CO CA DE CT DC Girder & Floorbeam system Slab Stringer/Multibeam or Girder Arch Deck Tee Beam Box Beam or Girders(Multiple) 20
21 Exploration of NBI structure type data slab stringer/multibm or girder girder & flbm Tee Bm Box Beam Arch Deck 0.8 0, , , , , , ,1 0,05 0 Slab Stringer/ Multibeam or girder Girder & Floorbeam Tee Beam Box Beam or girders Box plot of mean SD rates over 22 years Arch-Deck SD rate trends for structural types 21
22 Decomposition plots 2 component PARAFAC model was fitted to the data Variance explained= 90.15% Component box bm slab multibm or girder tee bm arch deck gird & floorbm Component ND OK SD AL KY TN LA HI AK CA AZ GAIA AR KS ORNV WAMT UT DC FL MD ID NE MIIL MO PA OH WV VT WI CO MN WY TX NH CT VA PR MA NM RI IN NJ NC ME SC DE NY Component 1 MS Component Loading plot for Structure types Loading plot for States Loading plot for years 22
23 Conclusion & Recommendations Demonstrates tensor decomposition as a knowledge discovery tool that has applications in bridge industry Detailed analysis which incorporates other deterioration factors such as age, ADT, and geographical location. Prediction 23
24 References (1) Wu N., Chase S. An Exploratory Data Analysis of National Bridge Inventory. Mid-Atlantic Universities Transportation Center (MAUTC). UVA May 2010 (2) Davis S.L., Goldberg D. The Fix We re in For: The State of Our Nation s Bridges Transportation for America. June 2013 (3) Steel Girder & Floorbeam. Accessed:10/21/2014 (4) Slab bridges. Accessed:10/21/2014 (5) Steel stringer or multibeam. Accessed:10/21/2014 (6) Arch Deck. Accessed:10/21/2014 (7) Tee Beam. Accessed:10/21/2014 (8) Box Beam bridge. Accessed:10/21/
Lecture 26 Section 8.4. Mon, Oct 13, 2008
 Lecture 26 Section 8.4 Hampden-Sydney College Mon, Oct 13, 2008 Outline 1 2 3 4 Exercise 8.12, page 528. Suppose that 60% of all students at a large university access course information using the Internet.
Nursing Facilities' Life Safety Standard Survey Results Quarterly Reference Tables
 Nursing Facilities' Life Safety Standard Survey Results Quarterly Reference Tables Table of Contents Table 1: Summary of Life Safety Survey Results by State Table 2: Ten Most Frequently Cited Life Safety
Your Galactic Address
 How Big is the Universe? Usually you think of your address as only three or four lines long: your name, street, city, and state. But to address a letter to a friend in a distant galaxy, you have to specify
Analyzing Severe Weather Data
 Chapter Weather Patterns and Severe Storms Investigation A Analyzing Severe Weather Data Introduction Tornadoes are violent windstorms associated with severe thunderstorms. Meteorologists carefully monitor
Use your text to define the following term. Use the terms to label the figure below. Define the following term.
 Mapping Our World Section. and Longitude Skim Section of your text. Write three questions that come to mind from reading the headings and the illustration captions.. Responses may include questions about
Sample Statistics 5021 First Midterm Examination with solutions
 THE UNIVERSITY OF MINNESOTA Statistics 5021 February 12, 2003 Sample First Midterm Examination (with solutions) 1. Baseball pitcher Nolan Ryan played in 20 games or more in the 24 seasons from 1968 through
Evolution Strategies for Optimizing Rectangular Cartograms
 Evolution Strategies for Optimizing Rectangular Cartograms Kevin Buchin 1, Bettina Speckmann 1, and Sander Verdonschot 2 1 TU Eindhoven, 2 Carleton University September 20, 2012 Sander Verdonschot (Carleton
Smart Magnets for Smart Product Design: Advanced Topics
 Smart Magnets for Smart Product Design: Advanced Topics Today s Presenter Jason Morgan Vice President Engineering Correlated Magnetics Research 6 Agenda Brief overview of Correlated Magnetics Research
Parametric Test. Multiple Linear Regression Spatial Application I: State Homicide Rates Equations taken from Zar, 1984.
 Multiple Linear Regression Spatial Application I: State Homicide Rates Equations taken from Zar, 984. y ˆ = a + b x + b 2 x 2K + b n x n where n is the number of variables Example: In an earlier bivariate
Drought Monitoring Capability of the Oklahoma Mesonet. Gary McManus Oklahoma Climatological Survey Oklahoma Mesonet
 Drought Monitoring Capability of the Oklahoma Mesonet Gary McManus Oklahoma Climatological Survey Oklahoma Mesonet Mesonet History Commissioned in 1994 Atmospheric measurements with 5-minute resolution,
Appendix 5 Summary of State Trademark Registration Provisions (as of July 2016)
") Appendix 5 Summary of State Trademark Registration Provisions (as of July 2016) App. 5-1 Registration Renewal Assignments Dates Term # of of 1st # of Use # of Form Serv. Key & State (Years) Fee Spec. Use
Appendix 5 Summary of State Trademark Registration Provisions (as of July 2016) App. 5-1 Registration Renewal Assignments Dates Term # of of 1st # of Use # of Form Serv. Key & State (Years) Fee Spec. Use
2006 Supplemental Tax Information for JennisonDryden and Strategic Partners Funds
 2006 Supplemental Information for JennisonDryden and Strategic Partners s We have compiled the following information to help you prepare your 2006 federal and state tax returns: Percentage of income from
What Lies Beneath: A Sub- National Look at Okun s Law for the United States.
 What Lies Beneath: A Sub- National Look at Okun s Law for the United States. Nathalie Gonzalez Prieto International Monetary Fund Global Labor Markets Workshop Paris, September 1-2, 2016 What the paper
Statistical Mechanics of Money, Income, and Wealth
 Statistical Mechanics of Money, Income, and Wealth Victor M. Yakovenko Adrian A. Dragulescu and A. Christian Silva Department of Physics, University of Maryland, College Park, USA http://www2.physics.umd.edu/~yakovenk/econophysics.html
EXST 7015 Fall 2014 Lab 08: Polynomial Regression
 EXST 7015 Fall 2014 Lab 08: Polynomial Regression OBJECTIVES Polynomial regression is a statistical modeling technique to fit the curvilinear data that either shows a maximum or a minimum in the curve,
Annual Performance Report: State Assessment Data
 Annual Performance Report: 2005-2006 State Assessment Data Summary Prepared by: Martha Thurlow, Jason Altman, Damien Cormier, and Ross Moen National Center on Educational Outcomes (NCEO) April, 2008 The
SAMPLE AUDIT FORMAT. Pre Audit Notification Letter Draft. Dear Registrant:
 Pre Audit Notification Letter Draft Dear Registrant: The Pennsylvania Department of Transportation (PennDOT) is a member of the Federally Mandated International Registration Plan (IRP). As part of this
Swine Enteric Coronavirus Disease (SECD) Situation Report June 30, 2016
 Situation Report June 30, 2016") Animal and Plant Health Inspection Service Veterinary Services Swine Enteric Coronavirus Disease (SECD) Situation Report June 30, 2016 Information current as of 12:00 pm MDT, 06/29/2016 This report provides
Animal and Plant Health Inspection Service Veterinary Services Swine Enteric Coronavirus Disease (SECD) Situation Report June 30, 2016 Information current as of 12:00 pm MDT, 06/29/2016 This report provides
Data Visualization (DSC 530/CIS )
") Data Visualization (DSC 530/CIS 602-01) Tables Dr. David Koop Visualization of Tables Items and attributes For now, attributes are not known to be positions Keys and values - key is an independent attribute
Data Visualization (DSC 530/CIS 602-01) Tables Dr. David Koop Visualization of Tables Items and attributes For now, attributes are not known to be positions Keys and values - key is an independent attribute
Summary of Natural Hazard Statistics for 2008 in the United States
 Summary of Natural Hazard Statistics for 2008 in the United States This National Weather Service (NWS) report summarizes fatalities, injuries and damages caused by severe weather in 2008. The NWS Office
Final Exam. 1. Definitions: Briefly Define each of the following terms as they relate to the material covered in class.
 Name Answer Key Economics 170 Spring 2003 Honor pledge: I have neither given nor received aid on this exam including the preparation of my one page formula list and the preparation of the Stata assignment
Forecasting the 2012 Presidential Election from History and the Polls
 Forecasting the 2012 Presidential Election from History and the Polls Drew Linzer Assistant Professor Emory University Department of Political Science Visiting Assistant Professor, 2012-13 Stanford University
Class business PS is due Wed. Lecture 20 (QPM 2016) Multivariate Regression November 14, / 44
 Multivariate Regression November 14, / 44") Multivariate Regression Prof. Jacob M. Montgomery Quantitative Political Methodology (L32 363) November 14, 2016 Lecture 20 (QPM 2016) Multivariate Regression November 14, 2016 1 / 44 Class business PS
Multivariate Regression Prof. Jacob M. Montgomery Quantitative Political Methodology (L32 363) November 14, 2016 Lecture 20 (QPM 2016) Multivariate Regression November 14, 2016 1 / 44 Class business PS
Module 19: Simple Linear Regression
 Module 19: Simple Linear Regression This module focuses on simple linear regression and thus begins the process of exploring one of the more used and powerful statistical tools. Reviewed 11 May 05 /MODULE
Cluster Analysis. Part of the Michigan Prosperity Initiative
 Cluster Analysis Part of the Michigan Prosperity Initiative 6/17/2010 Land Policy Institute Contributors Dr. Soji Adelaja, Director Jason Ball, Visiting Academic Specialist Jonathon Baird, Research Assistant
Data Visualization (CIS 468)
") Data Visualization (CIS 468) Tables & Maps Dr. David Koop Discriminability What is problematic here? File vtkdatasetreader PythonSource vtkimageclip vtkimagedatageometryfilter vtkimageresample vtkimagereslice
Data Visualization (CIS 468) Tables & Maps Dr. David Koop Discriminability What is problematic here? File vtkdatasetreader PythonSource vtkimageclip vtkimagedatageometryfilter vtkimageresample vtkimagereslice
AIR FORCE RESCUE COORDINATION CENTER
 AIR FORCE RESCUE COORDINATION CENTER 2006 ANNUAL REPORT 1 TABLE OF CONTENTS AFRCC CHARTER & MISSION STATEMENT 3 AFRCC ORGANIZATION 4 TABLE 1 10 YEAR LOOKBACK 5 TABLE 2 ACTIVITY BY MISSION TYPE 6 TABLE
C Further Concepts in Statistics
 Appendix C.1 Representing Data and Linear Modeling C1 C Further Concepts in Statistics C.1 Representing Data and Linear Modeling Use stem-and-leaf plots to organize and compare sets of data. Use histograms
Regression Diagnostics
 Diag 1 / 78 Regression Diagnostics Paul E. Johnson 1 2 1 Department of Political Science 2 Center for Research Methods and Data Analysis, University of Kansas 2015 Diag 2 / 78 Outline 1 Introduction 2
Swine Enteric Coronavirus Disease (SECD) Situation Report Sept 17, 2015
 Situation Report Sept 17, 2015") Animal and Plant Health Inspection Service Veterinary Services Swine Enteric Coronavirus Disease (SECD) Situation Report Sept 17, 2015 Information current as of 12:00 pm MDT, 09/16/2015 This report provides
Animal and Plant Health Inspection Service Veterinary Services Swine Enteric Coronavirus Disease (SECD) Situation Report Sept 17, 2015 Information current as of 12:00 pm MDT, 09/16/2015 This report provides
Meteorology 110. Lab 1. Geography and Map Skills
 Meteorology 110 Name Lab 1 Geography and Map Skills 1. Geography Weather involves maps. There s no getting around it. You must know where places are so when they are mentioned in the course it won t be
Discontinuation of Support for Field Chemistry Measurements in the National Atmospheric Deposition Program National Trends Network (NADP/NTN)
") Discontinuation of Support for Field Chemistry Measurements in the National Atmospheric Deposition Program National Trends Network (NADP/NTN) Christopher Lehmann, NADP Program Office, Illinois State Water
Discontinuation of Support for Field Chemistry Measurements in the National Atmospheric Deposition Program National Trends Network (NADP/NTN) Christopher Lehmann, NADP Program Office, Illinois State Water
Kari Lock. Department of Statistics, Harvard University Joint Work with Andrew Gelman (Columbia University)
") Bayesian Combinaion of Sae Polls and Elecion Forecass Kari Lock Deparmen of Saisics, Harvard Universiy Join Work wih Andrew Gelman (Columbia Universiy Harvard Insiue for Quaniaive Social Science Feb 4
Bayesian Combinaion of Sae Polls and Elecion Forecass Kari Lock Deparmen of Saisics, Harvard Universiy Join Work wih Andrew Gelman (Columbia Universiy Harvard Insiue for Quaniaive Social Science Feb 4
Introduction to Mathematical Statistics and Its Applications Richard J. Larsen Morris L. Marx Fifth Edition
 Introduction to Mathematical Statistics and Its Applications Richard J. Larsen Morris L. Marx Fifth Edition Pearson Education Limited Edinburgh Gate Harlow Essex CM20 2JE England and Associated Companies
The veto as electoral stunt
 The veto as eectora stunt EITM and a test with comparative data Eric ITAM, Mexico City Apr. 2, 203 eitm@mpsa Motivation A Form: see EITM in action forma mode 2 comparative statics 3 fasifiabe impications
AFRCC AIR FORCE RESCUE COORDINATION CENTER
 AFRCC AIR FORCE RESCUE COORDINATION CENTER 2003 ANNUAL REPORT AFRCC ANNUAL REPORT TABLE OF CONTENTS AFRCC Mission Statement and Charter... 3 Organizational Chart... 4 Commander's Comments... 5 2003 AFRCC
Swine Enteric Coronavirus Disease (SECD) Situation Report Mar 5, 2015
 Situation Report Mar 5, 2015") Animal and Plant Health Inspection Service Veterinary Services Swine Enteric Coronavirus Disease (SECD) Situation Report Mar 5, 2015 Information current as of 12:00 pm MDT, 03/04/2015 This report provides
Animal and Plant Health Inspection Service Veterinary Services Swine Enteric Coronavirus Disease (SECD) Situation Report Mar 5, 2015 Information current as of 12:00 pm MDT, 03/04/2015 This report provides
Draft Report. Prepared for: Regional Air Quality Council 1445 Market Street, Suite 260 Denver, Colorado Prepared by:
 Draft Report Evaluation of Preliminary MM5 Meteorological Model Simulation for the June-July 2006 Denver Ozone SIP Modeling Period Focused on Colorado Prepared for: Regional Air Quality Council 1445 Market
Empirical Application of Panel Data Regression
 Empirical Application of Panel Data Regression 1. We use Fatality data, and we are interested in whether rising beer tax rate can help lower traffic death. So the dependent variable is traffic death, while
Effects of Various Uncertainty Sources on Automatic Generation Control Systems
 Effects of Various Uncertainty Sources on Automatic Generation Control Systems D. Apostolopoulou, Y. C. Chen, J. Zhang, A. D. Domínguez-García, and P. W. Sauer University of Illinois at Urbana-Champaign
Resources. Amusement Park Physics With a NASA Twist EG GRC
 Resources 141 EG-2003-03-010-GRC 142 EG-2003-03-01o-GRC Vocabulary acceleration-the rate of change of velocity displacement-change in position of an object force-a push or a pull exerted on some object
Analysis of the USDA Annual Report (2015) of Animal Usage by Research Facility. July 4th, 2017
 of Animal Usage by Research Facility. July 4th, 2017") Analysis of the USDA Annual Report (2015) of Animal Usage by Research Facility July 4th, 2017 Author's information: Jorge Sigler, Catherine Perry, Amanda Gray, James Videle For inquiries contact James
Analysis of the USDA Annual Report (2015) of Animal Usage by Research Facility July 4th, 2017 Author's information: Jorge Sigler, Catherine Perry, Amanda Gray, James Videle For inquiries contact James
APRIL 1999 THE WALL STREET JOURNAL CLASSROOM EDITION Hurricanes, typhoons, coastal storms Earthquake (San Francisco area) Flooding
 Flooding") 12 THE WALL STREET JOURNAL CLASSROOM EDITION APRIL 1999 THE COST OF DISASTERS APRIL 1999 THE WALL STREET JOURNAL CLASSROOM EDITION 13 THE COST OF DISASTERS FORCES OF NATURE The U.S. government spends billions
12 THE WALL STREET JOURNAL CLASSROOM EDITION APRIL 1999 THE COST OF DISASTERS APRIL 1999 THE WALL STREET JOURNAL CLASSROOM EDITION 13 THE COST OF DISASTERS FORCES OF NATURE The U.S. government spends billions
Introduction to Tensors. 8 May 2014
 Introduction to Tensors 8 May 2014 Introduction to Tensors What is a tensor? Basic Operations CP Decompositions and Tensor Rank Matricization and Computing the CP Dear Tullio,! I admire the elegance of
AC/RC Regional Councils of Colonels & Partnerships
 AC/RC Regional Councils of Colonels & Partnerships WESTERN REGION AC: SJA, I Corps RC: Cdr, 6 th LOD GREAT LAKES REGION AC: SJA, 101 st ABN Div (AA)) RC: Cdr, 9 th LOD NORTHEAST REGION AC: SJA, 10 th Mtn
REGRESSION ANALYSIS BY EXAMPLE
 REGRESSION ANALYSIS BY EXAMPLE Fifth Edition Samprit Chatterjee Ali S. Hadi A JOHN WILEY & SONS, INC., PUBLICATION CHAPTER 5 QUALITATIVE VARIABLES AS PREDICTORS 5.1 INTRODUCTION Qualitative or categorical
Test of Convergence in Agricultural Factor Productivity: A Semiparametric Approach
 Test of Convergence in Agricultural Factor Productivity: A Semiparametric Approach Krishna P. Paudel, Louisiana State University and LSU Agricultural Center Mahesh Pandit, Louisiana State University and
Outline. Introduction. Introduction Accident Damage. Introduction Act of God Damage NATIONAL HIGH PERFORMANCE CONCRETE FOLLOW UP SURVEY RESULTS BY:
 BY: NATIONAL FOLLOW UP SURVEY RESULTS Louis N. Triandafilou, P.E. FHWA Resource Center Baltimore Senior Structural Engineer CLAUDE S. NAPIER, Jr., P.E. FHWA Virginia Division Bridge Engineer Outline HPC
Puerto Rico Transportation Asset Management Plan
 Puerto Rico Transportation Asset Management Plan PR-TAMP April 12, 2018 April 12, 2018 The Project Team Gordon Proctor Shobna Varma Jose Carro, P.E. Zaida Rico, P.E., Ph.D. gordon@proctorassociates.com
Tensor Decompositions and Applications
 Tamara G. Kolda and Brett W. Bader Part I September 22, 2015 What is tensor? A N-th order tensor is an element of the tensor product of N vector spaces, each of which has its own coordinate system. a =
$3.6 Billion GNMA Servicing Offering
 $3.6 Billion GNMA Servicing Offering Offering R2-0818 Bid Date: 8/14/2018 Bids are due by 5:00 PM EST Mortgage Industry Advisory Corporation 521 Fifth Avenue 9th Floor New York, NY 10175 TEL: (212) 233-1250
Some concepts are so simple
 Density: How Concentrated is Our Population? Morton J. Marcus Director Emeritus, Indiana Business Research Center, Kelley School of Business, Indiana University Some concepts are so simple to understand.
Combinatorics. Problem: How to count without counting.
 Combinatorics Problem: How to count without counting. I How do you figure out how many things there are with a certain property without actually enumerating all of them. Sometimes this requires a lot of
Estimating Dynamic Games of Electoral Competition to Evaluate Term Limits in U.S. Gubernatorial Elections: Online Appendix
 Estimating Dynamic Games of Electoral Competition to Evaluate Term Limits in U.S. Gubernatorial Elections: Online ppendix Holger Sieg University of Pennsylvania and NBER Chamna Yoon Baruch College I. States
Blueline Tilefish Assessment Approach: Stock structure, data structure, and modeling approach
 Blueline Tilefish Assessment Approach: Stock structure, data structure, and modeling approach Nikolai Klibansky National Oceanic and Atmospheric Administration August 28, 2017 Nikolai Klibansky (NOAA)
Daily Operations Briefing June 9, 2012 As of 8:30 a.m. EDT
 Daily Operations Briefing June 9, 2012 As of 8:30 a.m. EDT 1 Significant Activity: June 8 9 Significant Events: Little Bear Fire & Whitewater-Baldy Complex Fire - NM Lost Lake Fire & Box Creek Fire UT
Time-Series Trends of Mercury Deposition Network Data
 Time-Series Trends of Mercury Deposition Network Data Peter Weiss 1, David Gay 2, Mark Brigham 3, Matthew Parsons 4, Arnout Ter Schure 5 1 University of California, Santa Cruz, 2 National Atmospheric Deposition
Teachers Curriculum Institute Map Skills Toolkit 411
 Map kills Toolkit To the Teacher tudents encounter maps every day inside and outside their classes in books and on handheld devices, computers, or television screens. Whether they re navigating cities
Clear Roads Overview. AASHTO Committee on Maintenance July 23, 2018 Charlotte, North Carolina
 Clear Roads Overview AASHTO Committee on Maintenance July 23, 2018 Charlotte, North Carolina Kyle Lester Director of Highway Maintenance Colorado Department of Transportation Overview Clear Roads Winter
Further Concepts in Statistics
 Appendix D Further Concepts in Statistics D1 Appendix D Further Concepts in Statistics Stem-and-Leaf Plots Histograms and Frequency Distributions Line Graphs Choosing an Appropriate Graph Scatter Plots
PAVEMENT CRACK CLASSIFICATION BASED ON TENSOR FACTORIZATION. Offei Amanor Adarkwa
 PAVEMENT CRACK CLASSIFICATION BASED ON TENSOR FACTORIZATION by Offei Amanor Adarkwa A thesis submitted to the Faculty of the University of Delaware in partial fulfillment of the requirements for the degree
Daily Operations Briefing Tuesday, May 14, 2013 As of 8:30 a.m. EDT
 Daily Operations Briefing Tuesday, May 14, 2013 As of 8:30 a.m. EDT 1 Significant Activity: May 13-14 Significant Events: None Significant Weather: Rain & thunderstorms: Northern Plains to Mid-Atlantic;
The Observational Climate Record
 The Observational Climate Record Deke Arndt NOAA s Asheville, NC, USA February 2018 National Oceanic and Atmospheric Administration NOAA Satellite and Information Service National Centers for Environmental
Week 3 Linear Regression I
 Week 3 Linear Regression I POL 200B, Spring 2014 Linear regression is the most commonly used statistical technique. A linear regression captures the relationship between two or more phenomena with a straight
Topographic Recreational Map Of New Mexico: Detailed Travel Map By GTR Mapping
 Topographic Recreational Map Of New Mexico: Detailed Travel Map By GTR Mapping Biological Assessment for Proposed Reconstruction of New Mexico Forest Highway 12. Cuba and Jemez Recreation Opportunity Spectrum
Section 619. Profile. TA Center. early childhood. national. IDEAs partnerships results. The National Early Childhood Technical Assistance Center
 national early childhood TA Center IDEAs partnerships results Section 619 Profile 13th Edition Joan Danaher Robert Kraus Caroline Armijo Cherie Hipps The National Early Childhood Technical Assistance Center
Daily Operations Briefing May 30, 2012 As of 8:30 a.m. EDT
 Daily Operations Briefing May 30, 2012 As of 8:30 a.m. EDT 1 Significant Activity: May 29-30 Significant Events: Severe Weather: NY & OK Wildfire Activity: NM & CO Tropical Activity: Atlantic: Tropical
Daily Operations Briefing April 15, 2012 As of 8:30 a.m. EDT
 Daily Operations Briefing April 15, 2012 As of 8:30 a.m. EDT 1 Significant Activity: April 14-15 Significant Events: Severe Weather/Tornado Outbreak Central U.S. Significant Weather: Widespread severe
Towards a Bankable Solar Resource
 Towards a Bankable Solar Resource Adam Kankiewicz WindLogics Inc. SOLAR 2010 Phoenix, Arizona May 20, 2010 Outline NextEra/WindLogics Solar Development Lessons learned TMY - Caveat Emptor Discussion 2
Daily Operations Briefing. August 2, 2012 As of 8:30 a.m. EDT
 Daily Operations Briefing August 2, 2012 As of 8:30 a.m. EDT 1 Significant Activity: August 1-2 Significant Events: None Tropical Activity: Atlantic - Tropical Depression Five Eastern Pacific No tropical
Further Concepts in Statistics
 Appendix C Further Concepts in Statistics C1 Appendix C Further Concepts in Statistics Stem-and-Leaf Plots Histograms and Frequency Distributions Line Graphs Choosing an Appropriate Graph Scatter Plots
From Matrix to Tensor. Charles F. Van Loan
 From Matrix to Tensor Charles F. Van Loan Department of Computer Science January 28, 2016 From Matrix to Tensor From Tensor To Matrix 1 / 68 What is a Tensor? Instead of just A(i, j) it s A(i, j, k) or
Fundamentals of Multilinear Subspace Learning
 Chapter 3 Fundamentals of Multilinear Subspace Learning The previous chapter covered background materials on linear subspace learning. From this chapter on, we shall proceed to multiple dimensions with
Estimations of Copper Roof Runoff Rates in the United States
 Integrated Environmental Assessment and Management Volume 1, Number 4 pp. e15 e32 Ó 2005 SETAC e15 Estimations of Copper Roof Runoff Rates in the United States Ray Arnold* Copper Development Association
Appendix C. Questionnaire Summary of Responses Geographic Information Systems
 Appendix C Questionnaire Summary of Responses Geographic Information Systems 1. Is your agency using or planning use of GIS for: a. general mapping (e.g. highway routes, political boundaries, etc.) b.
A Second Opinion Correlation Coefficient. Rudy A. Gideon and Carol A. Ulsafer. University of Montana, Missoula MT 59812
 A Second Opinion Correlation Coefficient Rudy A. Gideon and Carol A. Ulsafer University of Montana, Missoula MT 59812 An important decision in most fields of research is whether two variables are related.
Daily Operations Briefing February 22, 2013 As of 8:30 a.m. EST
 Daily Operations Briefing February 22, 2013 As of 8:30 a.m. EST 1 Significant Activity: February 21 22 Significant Events: Winter Storm Central/Southern U.S. Significant Weather: Moderate to heavy precipitation
CS-11 Tornado/Hail: To Model or Not To Model
 CS-11 Tornado/Hail: To Model or Not To Model CAS Seminar on Reinsurance- June 5, 2012 George Davis 2012 AIR WORLDWIDE CAS Seminar on Reinsurance 1 Antitrust Notice The Casualty Actuarial Society is committed
Faloutsos, Tong ICDE, 2009
 Large Graph Mining: Patterns, Tools and Case Studies Christos Faloutsos Hanghang Tong CMU Copyright: Faloutsos, Tong (29) 2-1 Outline Part 1: Patterns Part 2: Matrix and Tensor Tools Part 3: Proximity
SUPPLEMENTAL NUTRITION ASSISTANCE PROGRAM QUALITY CONTROL ANNUAL REPORT FISCAL YEAR 2008
 SUPPLEMENTAL NUTRITION ASSISTANCE PROGRAM QUALITY CONTROL ANNUAL REPORT FISCAL YEAR 2008 U.S. DEPARTMENT OF AGRICULTURE FOOD AND NUTRITION SERVICE PROGRAM ACCOUNTABILITY AND ADMINISTRATION DIVISION QUALITY
2/25/2019. Taking the northern and southern hemispheres together, on average the world s population lives 24 degrees from the equator.
 Where is the world s population? Roughly 88 percent of the world s population lives in the Northern Hemisphere, with about half north of 27 degrees north Taking the northern and southern hemispheres together,
Computational Linear Algebra
 Computational Linear Algebra PD Dr. rer. nat. habil. Ralf-Peter Mundani Computation in Engineering / BGU Scientific Computing in Computer Science / INF Winter Term 2018/19 Part 6: Some Other Stuff PD Dr.
Tensor Decompositions for Machine Learning. G. Roeder 1. UBC Machine Learning Reading Group, June University of British Columbia
 Network Feature s Decompositions for Machine Learning 1 1 Department of Computer Science University of British Columbia UBC Machine Learning Group, June 15 2016 1/30 Contact information Network Feature
Transferability of Household Travel Data Across Geographic Areas Using NHTS 2001
 Transferability of Household Travel Data Across Geographic Areas Using NHTS 2001 Jane Lin PhD Assistant Professor Department of Civil and Materials Engineering Institute for Environmental Science and Policy
DATA UNCERTAINTY IN BRIDGE MANAGEMENT
 DATA UNCERTAINTY IN BRIDGE MANAGEMENT A Thesis presented to the Faculty of the Graduate School University of Missouri-Columbia In Partial Fulfillment of the Requirements for the Degree Master of Science
Daily Disaster Update Sunday, September 04, 2016
 Daily Disaster Update Information distributed to Disaster Notifications should be shared outside of the American Red Cross for business and mission critical purposes only please be wise when sharing information
Daily Operations Briefing Friday, November 29, :30 a.m. EST
 Daily Operations Briefing Friday, November 29, 2013 8:30 a.m. EST 1 Significant Activity: Nov 27 29 Significant Events: Winter Storm Eastern US (Final) Tropical Activity: Atlantic Area 1 (Low chance/10%)
Outline. Administrivia and Introduction Course Structure Syllabus Introduction to Data Mining
 Outline Administrivia and Introduction Course Structure Syllabus Introduction to Data Mining Dimensionality Reduction Introduction Principal Components Analysis Singular Value Decomposition Multidimensional
Online Appendix for Innovation and Top Income Inequality
 Online Appendix for Innovation and Top Income Inequality Not for publication unless requested Philippe Aghion Ufuk Akcigit Antonin Bergeaud Richard Blundell David Hémous February 23, 208 A Theoretical
2012 USACE Drought Actions
 2012 USACE Drought Actions for Inland Waterway Users Board 68 Jim Walker Navigation Branch Chief 19 December 2012 US US Army Corps of of Engineers US Drought Monitor 1 2 3 4 6 5 Impacts: 1. The area in
STATIONARITY OF THE TEMPORAL DISTRIBUTION OF RAINFALL Joseph P. Wilson, Wilson Hydro, LLC, Rolla, Missouri
 STATIONARITY OF THE TEMPORAL DISTRIBUTION OF RAINFALL Joseph P. Wilson, Wilson Hydro, LLC, Rolla, Missouri Abstract The time distribution of rainfall is a critical element of hydrologic analysis. The location
Daily Operations Briefing Tuesday, November 5, :30 a.m. EST
 Daily Operations Briefing Tuesday, November 5, 2013 8:30 a.m. EST 1 Significant Activity: Nov 4 5 Significant Events: None Tropical Activity: Atlantic No tropical cyclone activity expected next 48 hours
Daily Operations Briefing Friday, January 22, :30 a.m. EST
 Daily Operations Briefing Friday, January 22, 2016 8:30 a.m. EST Significant Activity: Jan 21-22 Significant Events: Winter Storm Eastern U.S. Significant Weather: Heavy snow possible Cascades and Sierras;
Drake Petroleum Company, Inc. Accutest Job Number: JB Total number of pages in report:
 e-hardcopy 2.0 Automated Report New Jersey 05/06/15 05/06/15 Technical Report for Drake Petroleum Company, Inc. 146282.003 PO#007805 Accutest Job Number: Sampling Date: 03/25/15 Report to: Brown & Caldwell
Risk Assessment of Highway Bridges: A Reliability-based Approach
 Risk Assessment of Highway Bridges: A Reliability-based Approach by Reynaldo M. Jr., PhD Indiana University-Purdue University Fort Wayne pablor@ipfw.edu Abstract: Many countries are currently experiencing
Simulating the State-by-State Effects of Terrorist Attacks on Three Major U.S. Ports: Applying NIEMO (National Interstate Economic Model)
") CREATE Research Archive Non-published Research Reports 8-19-2005 Simulating the State-by-State Effects of Terrorist Attacks on Three Major U.S. Ports: Applying NIEMO (National Interstate Economic Model)
CREATE Research Archive Non-published Research Reports 8-19-2005 Simulating the State-by-State Effects of Terrorist Attacks on Three Major U.S. Ports: Applying NIEMO (National Interstate Economic Model)
Locations of Monitoring Stations in the Mercury Trends Network
 Locations of Monitoring Stations in the Mercury Trends Network Three sets of geographic criteria were used to determine the locations for the regionally representative MTN monitoring stations: ecoregion,
Daily Operations Briefing. Sunday, March 4, :30 a.m. EST
 Daily Operations Briefing Sunday, March 4, 2018 8:30 a.m. EST Significant Activity Mar 3-4 Significant Events: Northeast coastal storm Tropical Activity: Western Pacific No activity affecting U.S. interests
CP DECOMPOSITION AND ITS APPLICATION IN NOISE REDUCTION AND MULTIPLE SOURCES IDENTIFICATION
 International Conference on Computer Science and Intelligent Communication (CSIC ) CP DECOMPOSITION AND ITS APPLICATION IN NOISE REDUCTION AND MULTIPLE SOURCES IDENTIFICATION Xuefeng LIU, Yuping FENG,
Daily Operations Briefing Wednesday, November 6, :30 a.m. EST
 Daily Operations Briefing Wednesday, November 6, 2013 8:30 a.m. EST 1 Significant Activity: Nov 5 6 Significant Events: None Tropical Activity: Atlantic/Eastern Pacific No tropical cyclone activity expected