34 ab ArchitectureBoston
|
|
|
- Elfrieda Henry
- 6 years ago
- Views:
Transcription

1 Postmodern theorists writing in the late 20th-century once surmised that, during an era of airplanes, cell phones, and the Internet, the importance of geographical space was quickly diminishing. The French anthropologist Marc Augé, for example, famously claimed that modern technological developments such as these had led to a homogenization of culture that was reflected in the proliferation of non-places (non-lieux) that were devoid of any particular cultural identity. For him, a perfect example was the airport: surrounded by impersonal signs and identified by government-issued documents that cloaked individuality, travelers waiting for a plane epitomized the late 20th-century transitory experience and its lack of concern for place, cultural particularity, and personal identity. The following images demonstrate that, whether or not the importance of geographical space has diminished, the representation of topographical space certainly has not. The fusillade of modern technological advances over the last several decades has only precipitated an explosion in cartographic curiosity and related explorations into data visualization. The very existence of multiple websites and conferences devoted to exploring innovative ways of depicting infrastructure cartographically begs two key questions: What lies behind this surge in the production of maps of all kinds, from simple delineations of proposed high-speed rail projects in the United States to more creative ventures in experimental geography? What does the practice of cartography allow us to see that we would not otherwise have seen? FLIGHT PATTERNS One of a series of visualizations depicting airline traffic across the United States created by Aaron Koblin, this image is based on data from the US Federal Aviation Administration for August 12, Free of traditional territorial lines and city icons, the geography of North America can be seen in terms of connections, providing a fresh understanding of land-use and economic activity. For more information: 34 ab ArchitectureBoston

2 Most fundamentally, mapping illustrates where elements of what we choose to include under the umbrella term infrastructure are currently located or planned. In turn, this information can be used to illuminate a whole range of other trends. For example, some major newspapers have recently shown how Obama s planned infrastructure projects tend to overlap areas that supported him on the campaign trail. Yet, going further, the abstraction involved in this process also serves a more philosophical function: It moves us to reflect upon the spaces in which we live and work. Removed from the chaos of everyday life at the street-level, the geometrical forms of transportation networks, roadways, and even healthcare policies become visible, and therefore more comprehensible. Like a child staring into an Etch-a-Sketch, we are tempted to imagine alternative transit systems and links between disparate places, not to mention the political and economic structures that produced them. The widespread practice of visualizing infrastructure, therefore, is not solely about concrete projects. It is a medium for self-reflection. In the words of the anthropologist Clifford Geertz, one might say that infrastructure is good to think with. Jeanne Haffner PhD is an urban historian and a fellow at Harvard University. Her forthcoming book (MIT Press) examines the role of visual techniques in the evolution of the new urbanism in postwar France. Things Visible and Invisible The graphic presentation of infrastructural data yields more than a map. by Jeanne Haffner phd Winter 2009 ab 35
3 36 ab ArchitectureBoston

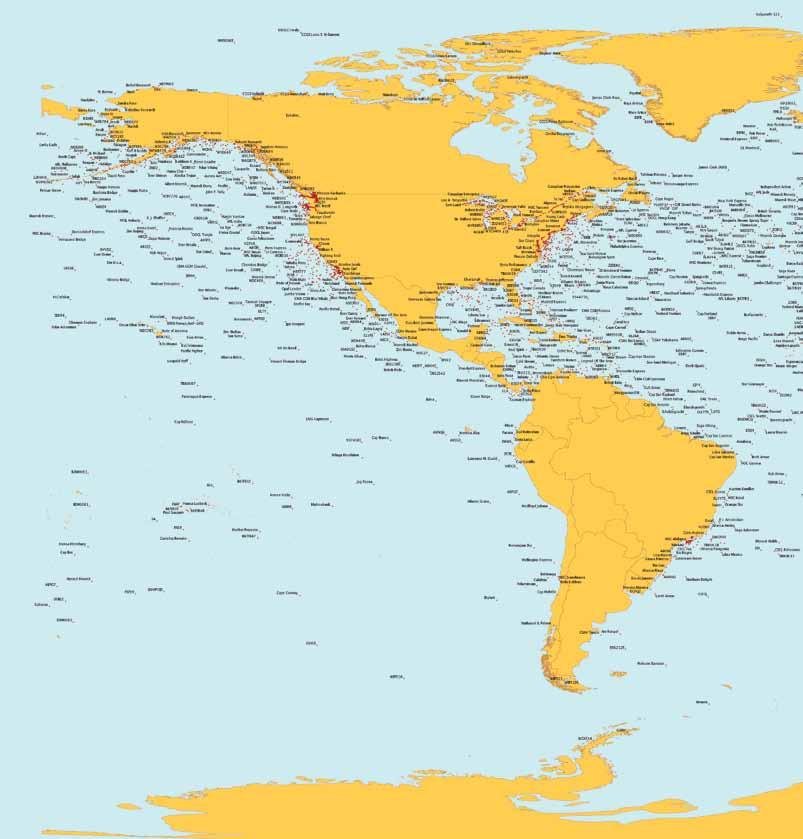
4 SHIP LOCATIONS This map shows positions and names (or identification codes) for commercial vessels around the world at 2 pm EDT on August 26, Commercial ship activity provides a largely unseen but vital transportation infrastructure. Created by Hal Mueller from a real-time tracker, the map is based on weather observations sent from ships every six hours and collated by the World Meteorological Organization; some additional positions were derived from automated position reporting (AIS). Ships represented include supertankers, freighters, cruise ships, research vessels, and workboats. For more information: Winter 2009 ab 37

5 38 ab ArchitectureBoston ring roads of the world A depiction of ring roads from 27 cities, all layered at the same scale. The largest, shown in black, is from Houston, Texas, home of Rice University School of Architecture, which commissioned the image in 2009 from Thumb ( as a poster. The second largest, shown in red, is Beijing.
6 Vancouver Portland Seattle Tacoma Edmonton Calgary NORTH AMERICAN MASS TRANSIT In this image, the mass-transit systems of North America are all drawn to the same scale, and placed in relative locations. Current as of 2005, it includes regional or commuter systems that connect two downtown areas of comparable size. Revealing differences in both density and growth patterns, the map was created by Bill Rankin, now a PhD candidate in both architecture and the history of science at Harvard. For more information: Minneapolis Detroit Toronto Vancouver Portland Seattle Tacoma and the Bay Area San Francisco Calgary Sacramento Salt Lake City Minneapolis Denver Detroit Ottawa Chicago Buffalo Toronto Montréal Cleveland Boston New York and New Jersey Pittsburgh San Francisco and the Bay Area Sacramento Salt Lake City Denver Chicago Cleveland Pittsburgh St. Louis Philadelphia and New Jersey St. Louis Las Vegas Baltimore Las Vegas Los Angeles Washington, DC W Los Angeles Atlanta Dallas to Fort Worth Atlanta Dallas to Fort Worth New Orleans Jacksonville New Orleans San Diego Houston Miami Houston KEY routes current as of 2005 Heavy and Light Rail KEY Trolleys, People-Movers, or Dedicated Busways Airport routes Connection current as of miles (all systems at same scale) Heavy and Light Rail Trolleys, People-Movers, or Dedicated Busways Airport Connection San Diego Guadalajara Monterrey Guadalajara Ciudad de México Monterrey San Juan miles (all systems at same scale) Ciudad de México Winter 2009 ab 39

7 :00 CELL PHONE USAGE These two images are part of a series representing text messages sent in the city of Amsterdam on New Year s Eve, This page: activity at 9 am. Page opposite: activity at midnight. SMS visualization tool developed by Aaron Koblin, with MIT SENSEable City Lab and CurrentCity, based on data from KPN Telcom. For more information: and 40 ab ArchitectureBoston

8 :00 Winter 2009 ab 41
Research Update: Race and Male Joblessness in Milwaukee: 2008
 Research Update: Race and Male Joblessness in Milwaukee: 2008 by: Marc V. Levine University of Wisconsin Milwaukee Center for Economic Development Briefing Paper September 2009 Overview Over the past decade,
HI SUMMER WORK
 HI-201 2018-2019 SUMMER WORK This packet belongs to: Dear Dual Enrollment Student, May 7 th, 2018 Dual Enrollment United States History is a challenging adventure. Though the year holds countless hours
Lesson 1 - Pre-Visit Safe at Home: Location, Place, and Baseball
 Lesson 1 - Pre-Visit Safe at Home: Location, Place, and Baseball Objective: Students will be able to: Define location and place, two of the five themes of geography. Give reasons for the use of latitude
Lab Activity: Weather Variables
 Name: Date: Period: Weather The Physical Setting: Earth Science Lab Activity: Weather Variables INTRODUCTION: A meteorologist is an individual with specialized education who uses scientific principles
The Elusive Connection between Density and Transit Use
 The Elusive Connection between Density and Transit Use Abstract: The connection between density and transportation is heralded by planners, yet results are often elusive. This paper analyzes two regions,
2/25/2019. Taking the northern and southern hemispheres together, on average the world s population lives 24 degrees from the equator.
 Where is the world s population? Roughly 88 percent of the world s population lives in the Northern Hemisphere, with about half north of 27 degrees north Taking the northern and southern hemispheres together,
Compact city policies: a comparative assessment
 Compact city policies: a comparative TADASHI MATSUMOTO Organisation for Economic Co-operation and Development (OECD) Presentation at the UNECE-OECD seminar September 26, 2012, Geneva Outline of the study
RNR 516A. Computer Cartography. Spring GIS Portfolio
 RNR 516A Computer Cartography Spring 2016 GIS Portfolio 1 Contents 1 Political and Locator Maps 3 2 Base Maps and Digitizing 4 3 Data Entry Report 5 4 Projections and Symbolization 6 5 Choropleth Mapping
Investigation 11.3 Weather Maps
 Name: Date: Investigation 11.3 Weather Maps What can you identify weather patterns based on information read on a weather map? There have been some amazing technological advancements in the gathering and
Kathryn Robinson. Grades 3-5. From the Just Turn & Share Centers Series VOLUME 12
 1 2 From the Just Turn & Share Centers Series VOLUME 12 Temperature TM From the Just Turn & Share Centers Series Kathryn Robinson 3 4 M Enterprises WriteMath Enterprises 2303 Marseille Ct. Suite 104 Valrico,
Solving Quadratic Equations by Graphing 6.1. ft /sec. The height of the arrow h(t) in terms
 in terms") Quadratic Function f ( x) ax bx c Solving Quadratic Equations by Graphing 6.1 Write each in quadratic form. Example 1 f ( x) 3( x + ) Example Graph f ( x) x + 6 x + 8 Example 3 An arrow is shot upward
Quadratic Function f ( x) ax bx c Solving Quadratic Equations by Graphing 6.1 Write each in quadratic form. Example 1 f ( x) 3( x + ) Example Graph f ( x) x + 6 x + 8 Example 3 An arrow is shot upward
Scaling in Biology. How do properties of living systems change as their size is varied?
 Scaling in Biology How do properties of living systems change as their size is varied? Example: How does basal metabolic rate (heat radiation) vary as a function of an animal s body mass? Mouse Hamster
The Americas Political Map Ng Country Region Maps
 We have made it easy for you to find a PDF Ebooks without any digging. And by having access to our ebooks online or by storing it on your computer, you have convenient answers with the americas political
Vibrancy and Property Performance of Major U.S. Employment Centers. Appendix A
 Appendix A DOWNTOWN VIBRANCY SCORES Atlanta 103.3 Minneapolis 152.8 Austin 112.3 Nashville 83.5 Baltimore 151.3 New Orleans 124.3 Birmingham 59.3 New York Midtown 448.6 Charlotte 94.1 Oakland 157.7 Chicago
North American Geography. Lesson 5: Barnstorm Like a Tennis Player!
 North American Geography Lesson 5: Barnstorm Like a Tennis Player! Unit Overview: As students work through the activities in this unit they will be introduced to the United States in general, different
Trends in Metropolitan Network Circuity
 Trends in Metropolitan Network Circuity David J. Giacomin Luke S. James David M. Levinson Abstract Because people seek to minimize their time and travel distance (or cost) when commuting, the circuity
American Tour: Climate Objective To introduce contour maps as data displays.
 American Tour: Climate Objective To introduce contour maps as data displays. www.everydaymathonline.com epresentations etoolkit Algorithms Practice EM Facts Workshop Game Family Letters Assessment Management
MAPS AND THEIR CLASSIFICATION
 MAPPING MAPS AND THEIR CLASSIFICATION WHAT IS A MAP? A map is representation of the Earth's surface, showing how things are related to each other by distance, direction, and size. Maps are a way of showing
Borchert s Epochs of American Urbanization
 Borchert s Epochs of American Urbanization Geographers define cities as intersecting points of communication and transportation. Cities serve multiple social, political, economic and cultural purposes.
CHAPTER 6: AIR MASSES & WEATHER PATTERNS
 CHAPTER 6: AIR MASSES & WEATHER PATTERNS METEOROLOGY NAME: PERIOD: Chapter 6 - Air Masses & Weather Patterns 1 Mr. Mihalik, Room 442 YOUR SHOT AT FORECASTING The project we ve all been waiting for... you
A Shift to the Sunbelt
 Adam Giladi 4/1/13 A Shift to the Sunbelt The changing global economy has lead to an increased interconnection between nations and the mass movement of individuals from one area to another. This movement
Chapter 4: Displaying and Summarizing Quantitative Data
 Chapter 4: Displaying and Summarizing Quantitative Data This chapter discusses methods of displaying quantitative data. The objective is describe the distribution of the data. The figure below shows three
TYPES OF GOVERNMENTS
 While the terms country, state, and nation are often used interchangeably, there is a difference. A State (note the capital "S") is a self-governing political entity. The term State can be used interchangeably
Inter and Intra Buffer Variability: A Case Study Using Scale
 Georgia State University ScholarWorks @ Georgia State University Art and Design Faculty Publications Ernest G. Welch School of Art and Design 2015 Inter and Intra Buffer Variability: A Case Study Using
What is Human Geography? HUMAN GEOGRAPHY. Human Geography. Human Geography 5/18/2015. Example of Differences: Hurricane Katrina
 What is Human Geography? Geography is the science of place and space. Geographers ask: Where are things located? Why things are located where they are? How places differ from one another? How people interact
Density and Walkable Communities
 Density and Walkable Communities Reid Ewing Professor & Chair City and Metropolitan Planning University of Utah ewing@arch.utah.edu Department of City & Metropolitan Planning, University of Utah MRC Research
Physical Features of Canada and the United States
 Physical Features of Canada and the United tates 170 ARCTIC OCA Aleutian s 1 1 Bering ea ALAKA Yukon R. Mt. McKinley (20,320 ft. 6,194 m) Gulf of Alaska BROOK RAG RAG Queen Charlotte s R Vancouver O C
Your web browser (Safari 7) is out of date. For more security, comfort and the best experience on this site: Update your browser Ignore
 is out of date. For more security, comfort and the best experience on this site: Update your browser Ignore") Your web browser (Safari 7) is out of date. For more security, comfort and the best experience on this site: Update your browser Ignore Educator Version TRACKING GRO W TH IN THE U.S. Late 19th century
Your web browser (Safari 7) is out of date. For more security, comfort and the best experience on this site: Update your browser Ignore Educator Version TRACKING GRO W TH IN THE U.S. Late 19th century
15.0 Operations and Maintenance Cost Calculations
 15.0 Operations and Maintenance Cost Calculations 15.1 Introduction Operations and Maintenance (O&M) costs were calculated for each of the four alternatives being considered in the analysis. No Build Alternative
Physical Features of Canada and the United States
 I VIUAL Physical Features of Canada and the United tates 170 ARCTIC OCA Aleutian s 1 Bering ea ALAKA Yukon R. Mt. McKinley (20,320 ft. 6,194 m) Gulf of Alaska BROOK RAG RAG Queen Charlotte s R Vancouver
ASSESSING ACCURACY: HOTEL HORIZONS FORECASTS
 ASSESSING ACCURACY: HOTEL HORIZONS FORECASTS April 13, 2016 EXECUTIVE SUMMARY The US hotel industry had another strong year in 2015 with RevPAR up 6.3 percent over the prior year. In this report, we examine
Lecture: Sampling and Standard Error LECTURE 8 1
 Lecture: Sampling and Standard Error 6.0002 LECTURE 8 1 Announcements Relevant reading: Chapter 17 No lecture Wednesday of next week! 6.0002 LECTURE 8 2 Recall Inferential Statistics Inferential statistics:
Heat and Health: Reducing the Impact of the Leading Weather-Related Killer
 Heat and Health: Reducing the Impact of the Leading Weather-Related Killer Laurence S. Kalkstein, Ph.D. Department of Public Health Sciences Miller School of Medicine University of Miami June, 2017 Quick
How Geographers View the World: Human Geography. ESSENTIAL QUESTION: How does geography influence the way people live?
 How Geographers View the World: Human Geography ESSENTIAL QUESTION: How does geography influence the way people live? Geographers Think Spatially Gefffffdgfhfjgjp Guiding Question: What does it mean to
World Geography. BY MARK STANGE and REBECCA LARATTA
 BY MARK STANGE and REBECCA LARATTA COPYRIGHT 2002 Mark Twain Media, Inc. ISBN 1-58037-205-8 Printing No. CD-1551 Mark Twain Media, Inc., Publishers Distributed by Carson-Dellosa Publishing Company, Inc.
GTECH 201 Geographic Methods
 GTECH 201 Geographic Methods Map Quiz What is Geography? Administravia Course web site Accounts, printing, email (Hunter only) Send me an email with: name, geo courses taken, major/minor, Fr/So/Jr/Sr Types
6/25/2018. Upcoming Classes After Today. Our Only Presentation Day: Monday, July 2
 Upcoming Classes After Today Tuesday (June 26): Pacific Northwest and the Northlands Wednesday (June 27): Geographic Literacy in America; Take-Home Midterm Exam #2 distributed and discussed Thursday (June
Signs in the Sky. by Michelle August
 Read the science passages. Then answer the questions that follow. Signs in the Sky by Michelle August 1 Today, every news channel has a weather person. They can predict the weather for days, even weeks
NAVIGATION AND VESSEL INSPECTION CIRCULAR NO
 COMDTPUB P16700.4 NVIC 13-92 15 Dec 1992 NAVIGATION AND VESSEL INSPECTION CIRCULAR NO. 13-92 Electronic Version for Distribution Via the World Wide Web Subj: Captain of the Port Zone Boundaries 1. PURPOSE.
Growth of Urban Areas. Urban Hierarchies
 Growth of Urban Areas Urban Hierarchies Directions: In your notebook, complete the following on the right: Create a chart to explain and analyze the gravity model, central place theory, bid-rent theory,
Australia CANADA. Yosemite National Park. Seattle. Boston. Minneapolis. Buffalo New York City. Detroit. Cleveland. Chicago. Philadelphia.
 Table of ontents A Variety of Maps... 4 Maps how Landforms... 6 Maps an how Natural Resources... 8 A Precipitation Map... 10 limate Maps... 12 National Park Maps... 14 A ounty Map... 16 An Elevation Map...
Climate Uncovered: Media Fail to Connect Hurricane Florence to Climate Change
 September 18, 2018 Climate Uncovered: Media Fail to Connect Hurricane Florence to Climate Change One of the clearest and most devastating impacts of climate change has been the intensification of the harm
C) Discuss two factors that are contributing to the rapid geographical shifts in urbanization on a global scale.
 Discuss two factors that are contributing to the rapid geographical shifts in urbanization on a global scale.") AP Human Geography Unit VII. Cities and Urban Land Use Free Response Questions FRQ 1 Rapid urbanization in Least Developed Countries (LDCs) has many profound impacts for the world. Answer the following
AP Human Geography Unit VII. Cities and Urban Land Use Free Response Questions FRQ 1 Rapid urbanization in Least Developed Countries (LDCs) has many profound impacts for the world. Answer the following
Hotel Industry Overview. UPDATE: Trends and outlook for Northern California. Vail R. Brown
 Hotel Industry Overview UPDATE: Trends and outlook for Northern California Vail R. Brown Senior Vice President, Global Business Development & Marketing vbrown@str.com @vail_str 2016 STR, Inc. All Rights
11/14/2017. Key City Focus: Phoenix
 Semester Project Reminder Semester Project presentations begin on Monday, November 20 (and continue on Monday, November 27 and Wednesday, November 27). See the presentation schedule posted online for your
a division of Teacher Created Materials
 Sample Pages from a division of Teacher Created Materials Thanks for checking us out. Please call us at 877-777-3450 with questions or feedback, or to order this product. You can also order this product
Saskatchewan s Early Trade Routes: The Impact of Geography on Trade
 Saskatchewan s Early Trade Routes: The Impact of Geography on Trade Lesson Overview In this lesson, students will compare and contrast prehistoric First Nations trade routes and trade goods with the routes
 What Is a Time Zone? Nature doesn t have a clock; a clock is a human invention. Instead animals, plants and humans respond to the length of the day from sunrise until sunset. This is known as a natural
Get involved in the City Nature Challenge 2018!
 Get involved in the City Nature Challenge 2018! ANDREA LOREK STRAUSS 1 WHAT IS CITY NATURE CHALLENGE? Cities compete to observe and record biodiversity Quest to: Document species Get people involved with
Authors: Antonella Zanobetti and Joel Schwartz
 Title: Mortality Displacement in the Association of Ozone with Mortality: An Analysis of 48 US Cities Authors: Antonella Zanobetti and Joel Schwartz ONLINE DATA SUPPLEMENT Additional Information on Materials
22 cities with at least 10 million people See map for cities with red dots
 22 cities with at least 10 million people See map for cities with red dots Seven of these are in LDC s, more in future Fastest growing, high natural increase rates, loss of farming jobs and resulting migration
WEATHER FORECASTING Acquisition of Weather Information WFO Regions Weather Forecasting Tools Weather Forecasting Tools Weather Forecasting Methods
 1 2 3 4 5 6 7 8 WEATHER FORECASTING Chapter 13 Acquisition of Weather Information 10,000 land-based stations, hundreds of ships and buoys; four times a day, airports hourly Upper level: radiosonde, aircraft,
Transferability of Household Travel Data Across Geographic Areas Using NHTS 2001
 Transferability of Household Travel Data Across Geographic Areas Using NHTS 2001 Jane Lin PhD Assistant Professor Department of Civil and Materials Engineering Institute for Environmental Science and Policy
1. Evaluation of maximum daily temperature
 1. Evaluation of maximum daily temperature The cumulative distribution of maximum daily temperature is shown in Figure S1. Overall, among all of the 23 states, the cumulative distributions of daily maximum
Crossing the Atlantic: Then and Now
 Your web browser (Safari 7) is out of date. For more security, comfort and Activitydevelop the best experience on this site: Update your browser Ignore Crossing the Atlantic: Then and Now How has the amount
Cities, Countries, and Population
 Cities, Countries, and Population After the world industrialized, better food, improved sanitation, and new medicines caused the world population to soar. To understand how heavily populated an area is,
City Number Pct. 1.2 STEMS AND LEAVES
 1.2 STEMS AND LEAVES Think back on the preceding example. We dealt with a list of cities giving their populations and areas. Usually the science of statistics does not concern itself with identifying the
Non-Parametric Two-Sample Analysis: The Mann-Whitney U Test
 Non-Parametric Two-Sample Analysis: The Mann-Whitney U Test When samples do not meet the assumption of normality parametric tests should not be used. To overcome this problem, non-parametric tests can
The Spatial Structure of Cities in the United States
 The Spatial Structure of Cities in the United States Gerrit-Jan Knaap, Rebecca Lewis and Jamie Schindewolf In recent years, the spatial structure of cities has become the subject of considerable interest,
Exercises 36 CHAPTER 2/ORGANIZATION AND DESCRIPTION OF DATA
 36 CHAPTER 2/ORGANIZATION AND DESCRIPTION OF DATA In the stem-and-leaf display, the column of first digits to the left of the vertical line is viewed as the stem, and the second digits as the leaves. Viewed
Cambridge IGCSE Geography past paper questions
 Cambridge IGCSE Geography Past paper questions are reproduced by permission of University of Cambridge International Examinations. QUESTION 1: Cambridge IGCSE Geography 04/01 Q2 June 2005 (a) Study Fig.
Rank University AMJ AMR ASQ JAP OBHDP OS PPSYCH SMJ SUM 1 University of Pennsylvania (T) Michigan State University
 Michigan State University") Rank University AMJ AMR ASQ JAP OBHDP OS PPSYCH SMJ SUM 1 University of Pennsylvania 4 1 2 0 2 4 0 9 22 2(T) Michigan State University 2 0 0 9 1 0 0 4 16 University of Michigan 3 0 2 5 2 0 0 4 16 4 Harvard
Rank University AMJ AMR ASQ JAP OBHDP OS PPSYCH SMJ SUM 1 University of Pennsylvania 4 1 2 0 2 4 0 9 22 2(T) Michigan State University 2 0 0 9 1 0 0 4 16 University of Michigan 3 0 2 5 2 0 0 4 16 4 Harvard
Your web browser (Safari 7) is out of date. For more security, comfort and the best experience on this site: Update your browser Ignore
 is out of date. For more security, comfort and the best experience on this site: Update your browser Ignore") Your web browser (Safari 7) is out of date. For more security, comfort and the best experience on this site: Update your browser Ignore urban area For the complete encyclopedic entry with media resources,
Your web browser (Safari 7) is out of date. For more security, comfort and the best experience on this site: Update your browser Ignore urban area For the complete encyclopedic entry with media resources,
Using Census Public Use Microdata Areas (PUMAs) as Primary Sampling Units in Area Probability Household Surveys
 as Primary Sampling Units in Area Probability Household Surveys") Using Census Public Use Microdata Areas (PUMAs) as Primary Sampling Units in Area Probability Household Surveys Joe McMichael, Patrick Chen RTI International, 1 3040 Cornwallis Road, Research Triangle
Using Census Public Use Microdata Areas (PUMAs) as Primary Sampling Units in Area Probability Household Surveys Joe McMichael, Patrick Chen RTI International, 1 3040 Cornwallis Road, Research Triangle
Employment Decentralization and Commuting in U.S. Metropolitan Areas. Symposium on the Work of Leon Moses
 Employment Decentralization and Commuting in U.S. Metropolitan Areas Alex Anas Professor of Economics University at Buffalo Symposium on the Work of Leon Moses February 7, 2014 9:30-11:15am, and 2:30-4:30pm
Five Themes of Geography Project Ms. Kiesel, Per 5. The United States of America
 Five Themes of Geography Project Ms. Kiesel, Per 5 The United States of America Location Absolute Location : The USA is located in the continent of North America in the northern and western hemispheres.
Elementary School. Assessment Focus: Strand 2 Developing a Geographic Perspective. Geography Content Standard Location, Movement, and Connection
 Michigan Geographic Alliance(1996) Geography Sample Item Elementary School Assessment Focus: Strand 2 Developing a Geographic Perspective Geography Content Standard Location, Movement, and Connection Industrial
Population Density. Population density: A measure of how crowded a place is.
 Population Density Population density: A measure of how crowded a place is. Formula: Population Density = Population Total Area km 2 Overall Canada has a low population density of about 3 people per km
JONATHAN P. SCHROEDER
 JONATHAN P. SCHROEDER Minnesota Population Center Office: (612) 624-5818 University of Minnesota Fax: (612) 626-8375 50 Willey Hall jps@umn.edu 225 19 th Avenue South Minneapolis, MN 55455 EDUCATION Ph.D.
Unit 6: Industrialization and Development Part 3-4
 Unit 6: Industrialization and Development Part 3-4 ORIGINAL AUTHOR UNKNOWN, but appreciated greatly! Additional information added by A. Parkhurst, M.Ed. 2015 1 Part Three: The Evolution of Economic Cores
Oklahoma Academic Standards Science Grade: 6 - Adopted: 2014
 Main Criteria: Oklahoma Academic Standards Secondary Criteria: Subjects: Science, Social Studies Grade: 6 Correlation Options: Show Correlated OK.6-LS. Oklahoma Academic Standards Science Grade: 6 - Adopted:
Many Ways to Name a Place
 Your web browser (Safari 7) is out of date. For more security, comfort and Activityapply the best experience on this site: Update your browser Ignore Many Ways to Name a Place What are the names for the
CityBES: A Data and Computing Platform for City Buildings
 CityBES: A Data and Computing Platform for City Buildings Yixing Chen, Tianzhen Hong, Mary Ann Piette, Xuan Luo Building Technology and Urban Systems Division Urban Infrastructures NSF Workshop New York
Multi-Dimensional Geometric Complexity in Urban Transportation Systems
 Multi-Dimensional Geometric Complexity in Urban Transportation Systems Farideddin Peiravian a,1 and Sybil Derrible a a University of Illinois at Chicago, Complex and Sustainable Urban Networks (CSUN) Lab,
Objective: Use station models to forecast conditions for weather stations in a region of the continental United States.
 The Atmosphere in Motion: How do meteorologists predict the weather? Weather refers to the present state of the atmosphere air pressure, wind, temperature, and humidity. Meteorologists study weather by
10/23/2017. Week 6. Retail and the Settlement Pattern. Whataburger Locations. A family-owned quick service restaurant chain
 Schedule Updates and Reminders Here are some important dates and items from our class schedule over the next few weeks: Mon, Oct 23: Commerce and the Settlement Pattern Wed, Oct 25: Talk by Amanda Regan
Smart Growth: Threat to the Quality of Life. Experience
 Smart Growth: Threat to the Quality of Life Presentation by Wendell Cox Wendell Cox Consultancy Visiting Professor Conservatoire National des Arts et Metiers Paris Frontier Centre for Public Policy Winnipeg
Name Date Period Barron s (6 th edition) Chapter 7 Urban Geography
 Chapter 7 Urban Geography") Name Date Period Barron s (6 th edition) Chapter 7 Urban Geography Historical Geography of Urban Environments 1. In what way did the development of different types of occupations (carpenters, merchants,
Name Date Period Barron s (6 th edition) Chapter 7 Urban Geography Historical Geography of Urban Environments 1. In what way did the development of different types of occupations (carpenters, merchants,
FUTURE COURSES AND CAREERS
 FUTURE COURSES AND CAREERS IN GEOGRAPHY CGC1D Ms. Hyndman PHYSICAL GEOGRAPHY: PATTERNS, PROCESSES AND INTERACTIONS CGF3M Grade 11 course This course examines the major patterns of physical geography and
Curriculum Vita. Timothy J. Niblett
 Curriculum Vita Timothy J. Niblett CONTACT DETAILS 3416 Bellevue Drive Modesto, CA 95350 tniblett@ucsb.edu (209) 480-0467 EDUCATION Ph.D M.A. M.A. B.A. 2016, University of California at Santa Barbara (Geography)
ES1 Investigating Weather Maps/Station Models Act# 10 Name Block Date
 yay, bonus pt. because oops, no HO, book, heading this date =MP ES1 Investigating Weather Maps/Station Models Act# 10 Name Block Date Weather INTRODUCTION: Weather maps combine meteorological data from
Speed. June Victor Couture (U. Toronto) Gilles Duranton (U. Toronto) Matt Turner (U. Toronto)
 Gilles Duranton (U. Toronto) Matt Turner (U. Toronto)") Speed June 2012 Victor Couture (U. Toronto) Gilles Duranton (U. Toronto) Matt Turner (U. Toronto) Objectives: Assess differences in driving speed across us metropolitan areas Explore their determinants
Speed June 2012 Victor Couture (U. Toronto) Gilles Duranton (U. Toronto) Matt Turner (U. Toronto) Objectives: Assess differences in driving speed across us metropolitan areas Explore their determinants
MULTIPLE CHOICE. Choose the one alternative that best completes the statement or answers the question.
 AP Test 13 Review Name MULTIPLE CHOICE. Choose the one alternative that best completes the statement or answers the question. 1) Compared to the United States, poor families in European cities are more
Grade Four Content Overview
 Grade Four Content Overview Physical features Regions Contributions of the states Our Country: Geography and Regions Coastal and inland communities Famous landmarks Physical and human characteristics Local,
NAWIC. National Association of Women in Construction. Membership Report. August 2009
 NAWIC National Association of Women in Construction Membership Report August 2009 Core Purpose: To enhance the success of women in the construction industry Region 1 67 Gr Washington, DC 9 16 2 3 1 0 0
Centrality Measures In The Real World. David Kravitz
 Centrality Measures In The Real World David Kravitz dkravitz78@gmail.com Graph Questions For Today Given a record of all phone calls made in one town over a period of one month, who is the most influential
National Geographic New York City: Destination Map (National Geographic Destination Map) By National Geographic Society;Laminating Services
 By National Geographic Society;Laminating Services") National Geographic New York City: Destination Map (National Geographic Destination Map) By National Geographic Society;Laminating Services director of the Hayden Planetarium and host of National Geographic's
National Geographic New York City: Destination Map (National Geographic Destination Map) By National Geographic Society;Laminating Services director of the Hayden Planetarium and host of National Geographic's
Integrated Science I: Locating earthquake epicenters. Name Per Date
 Integrated Science I: Locating earthquake epicenters. Name Per Date Whenever a significant earthquake occurs somewhere in the world, news media present reports about two issues; the size or magnitude of
Land Use in the context of sustainable, smart and inclusive growth
 Land Use in the context of sustainable, smart and inclusive growth François Salgé Ministry of sustainable development France facilitator EUROGI vice president AFIGéO board member 1 Introduction e-content+
Access Across America: Transit 2017
 Access Across America: Transit 2017 Final Report Prepared by: Andrew Owen Brendan Murphy Accessibility Observatory Center for Transportation Studies University of Minnesota CTS 18-12 1. Report No. CTS
Demographic Change Near Rail Stations
 4/10/2015 Demographic Change Near Rail Stations University of North Carolina at Chapel Hill Department of City and Regional Planning TABLE OF CONTENTS Introduction... 3 1. Literature Review... 3 2. Methodology...
Texas Geography. Understanding the physical and human characteristics of our state
 Texas Geography Understanding the physical and human characteristics of our state To understand Texas you must first learn about its Geography. Geography- The study of the world, its people, and the interaction
Map directions are broken down into 2 main types; Cardinal Directions and Intermediate Directions SW S
 ELEMENTS OF MAPS COMPASS ROSE AND DIRECTIONS When reading a map it s always important to know your directions. The Compass Rose is the tool to help you do that. Map directions are broken down into 2 main
M-8.1 EARTHQUAKE 87KM SW OF PIJIJIAPAN, MEXICO EXACT LOCATION: N W DEPTH: 69.7KM SEPTEMBER 7, 11:49 PST
 M-8.1 EARTHQUAKE 87KM SW OF PIJIJIAPAN, MEXICO EXACT LOCATION: 15.068 N 93.715 W DEPTH: 69.7KM SEPTEMBER 7, 2017 @ 11:49 PST Photo: Luis Alberto Cruz / AP Photo: Carlos Jasso 1 THE 2017 CHIAPAS MEXICO
Missed Opportunity: Transit and Jobs in Metropolitan America
 Robert Puentes Brookings Institution Washington, DC May 12, 2011 Missed Opportunity: Transit and Jobs in Metropolitan America We believe we may have a public transit moment before us in the U.S. today.
Effects of Urban Rail Transit Expansions: Evidence from Sixteen Cities,
 NATHANIEL BAUM-SNOW Brown University MATTHEW E. KAHN Tufts University Effects of Urban Rail Transit Expansions: Evidence from Sixteen Cities, 1970 2000 FEDERAL, STATE, AND LOCAL governments have spent
Lesson 1. Investigation. Name:
 Check Unit Your 2 Understanding Lesson 1 Investigation 3 Write rules in the NOW-NEXT and y = mx + b forms for the linear functions that give the following tables and graphs. For the graphs, assume a scale
Speakers: Jeff Price, Federal Transit Administration Linda Young, Center for Neighborhood Technology Sofia Becker, Center for Neighborhood Technology
 Speakers: Jeff Price, Federal Transit Administration Linda Young, Center for Neighborhood Technology Sofia Becker, Center for Neighborhood Technology Peter Haas, Center for Neighborhood Technology Craig
Access Across America: Transit 2016
 Access Across America: Transit 2016 Final Report Prepared by: Andrew Owen Brendan Murphy Accessibility Observatory Center for Transportation Studies University of Minnesota David Levinson School of Civil
The ABC's of Compass and Map STUDENT WORKBOOK
 The ABC's of Compass and Map STUDENT WORKBOOK 1 EXERCISE 1: Compass Part Identification Directions: Match the terms below with the correct parts on the compass diagram. NOTES: A. Azimuth Ring B. Compass