Hotel Industry Overview. UPDATE: Trends and outlook for Northern California. Vail R. Brown
|
|
|
- Benjamin Flynn
- 5 years ago
- Views:
Transcription
1 Hotel Industry Overview UPDATE: Trends and outlook for Northern California Vail R. Brown Senior Vice President, Global Business Development & 2016 STR, Inc. All Rights Reserved. Any reprint, use or republication of all or a part of this presentation without the prior written approval of STR, Inc. or STR Global, Ltd. trading as STR (collectively STR ) is strictly prohibited. Any such reproduction shall specifically credit STR as the source. This presentation is based on data collected by STR. No strategic advice or marketing recommendation is intended or implied.
2 Agenda U.S. High level trends Northern California markets & submarkets Pipeline Outlook
3 U.S. Industry Review
4 September 2016 Jewish Calendar shift lifted results RevPAR +5.6% ADR +3.9% First time that September demand was ~105 Million Rooms Sold Group RevPAR +12.1%
5 September 2016 YTD: Occupancy Was Never Higher % Change Room Supply 1.5% Room Demand 1.5% Occupancy 67.1% 0% A.D.R. $ % RevPAR $84 3.2% Room Revenue 4.8% September 2016 YTD, Total US Results
6 RevPAR Growth: Slowing Down After 6 Yrs. Of Growth Months 31 Mo 56 Months 79 Mo Total U.S., RevPAR % Change, 1/ /2016
7 Northern California Markets & Submarkets


8 San Francisco Oakland San Francisco Sacramento Silicon Valley
9 Sacramento Market: Demand growth > Supply growth Supply Demand San Francisco Oakland Sacramento Silicon Valley Northern CA Markets Supply / Demand Percent Change Twelve Months Ended September 2016
10 ADR growth outpacing OCC growth Occupancy ADR San Francisco Oakland Sacramento Silicon Valley Northern CA Markets Occupancy / ADR Percent Change Twelve Months Ended September 2016
11 Sacramento growing over San Francisco Oakland Sacramento Silicon Valley Actual OCC by market, Twelve Month Moving Average Sept 2015 vs. Sept 2016
12 ALL RevPAR growth driven by ADR San Francisco Oakland Sacramento Silicon Valley Northern CA Markets RevPAR Percent Change Twelve Months Ended September 2016
13 Customer Segmentation Transient Segment Rooms reserved at rack rate, corporate negotiated, package, government rate or rooms booked via third party websites. Group Segment Rooms sold simultaneously in blocks of 10 or more.


14 Transient Customer Segmentation: Positive RevPAR growth Transient ADR % Change Transient OCC % Change 16.2% RevPAR % RevPAR 4.0% RevPAR % RevPAR San Francisco Oakland Sacramento Silicon Valley Transient Customer: RevPAR % Change by Contribution of OCC / ADR % Change, September 2016 YTD

15 Group Customer Segmentation: All Driven by ADR Group ADR % Change Group OCC % Change 5.1% RevPAR 15.1% RevPAR 9.7% RevPAR % RevPAR San Francisco Oakland Sacramento Silicon Valley Group Customer: RevPAR % Change by Contribution of OCC / ADR % Change, September 2016 YTD

16 San Francisco unique relationship $ $ Transient ADR Group ADR $ $ $ $ $ $ San Francisco Oakland Sacramento Silicon Valley Customer Segmentation: Actual ADR by market, September YTD Transient vs. Group
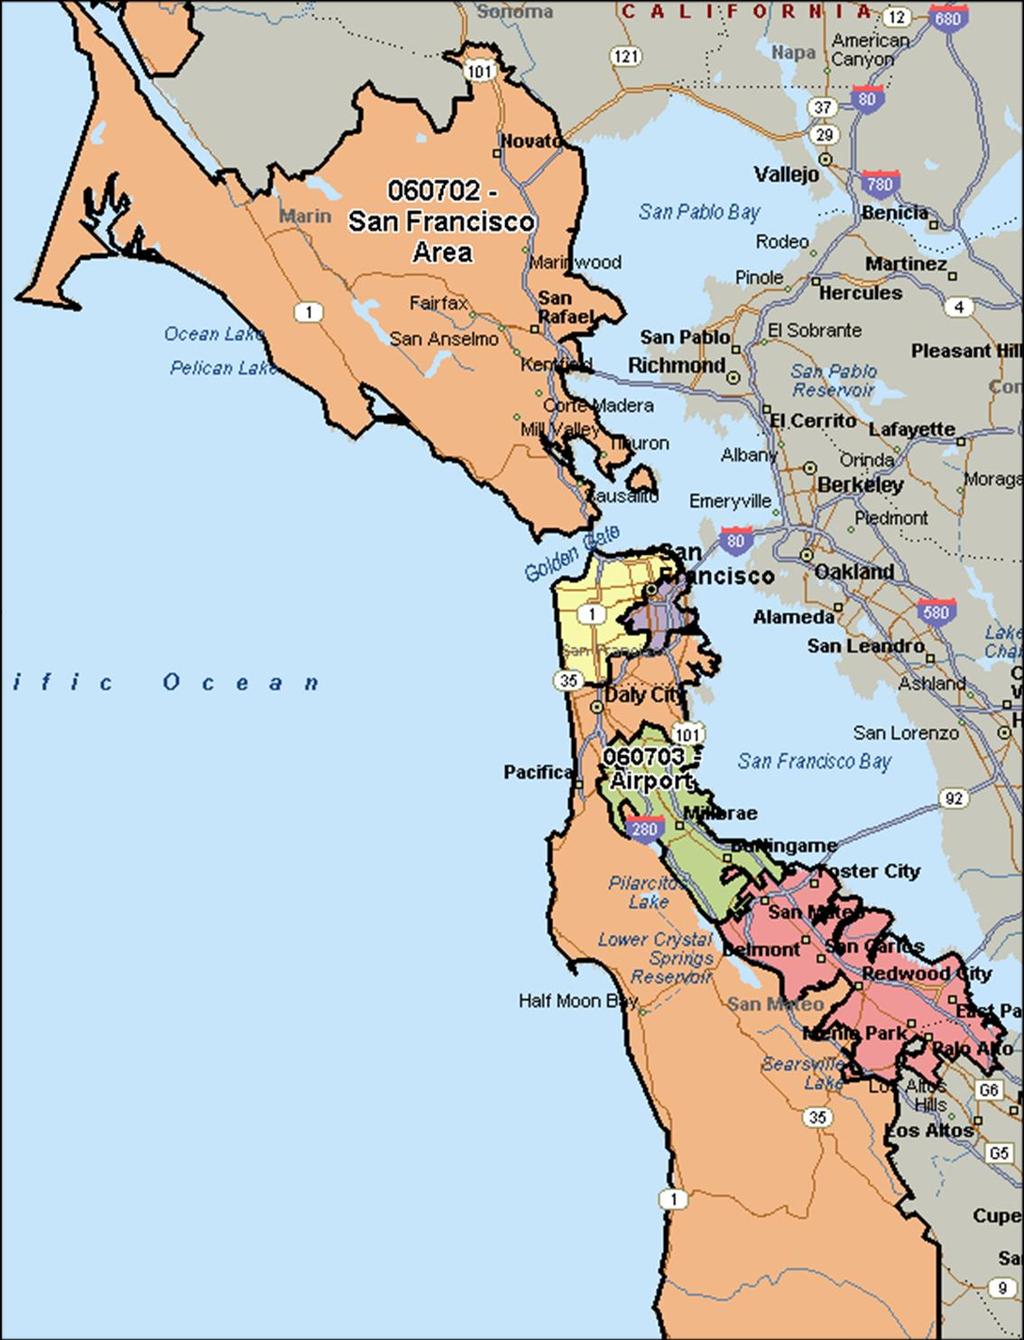
17 San Francisco Submarkets
18
19 San Francisco Area OCC: -0.1% ADR: 6.3% RevPAR: 6.2% Nob Hill/Wharf OCC: 0.8% ADR: 4.9% RevPAR: 5.7% Market/CBD OCC: 2.1% ADR: 2.8% RevPAR: 5.0% San Francisco Submarkets September 2016 YTD Airport OCC: -2.2% ADR: 5.1% RevPAR: 2.8% San Mateo/Redwood City OCC: -2.9% ADR: 7.7% RevPAR: 4.6%
20 San Francisco Area Transient OCC: 0.2% Group OCC: -4.7% Nob Hill/Wharf Transient OCC: 4.8% Group OCC: 2.6% Market/CBD Transient OCC: 3.5% Group OCC: -1.6% Airport Transient OCC: -1.0% Group OCC: -2.4% San Mateo/Redwood City Transient OCC: -4.2% Group OCC: 3.8% San Francisco Submarkets September 2016 YTD
21 San Francisco Area Transient ADR: 4.0% Group ADR: 10.3% Nob Hill/Wharf Transient ADR: 1.6% Group ADR: 10.6% Market/CBD Transient ADR: -0.2% Group ADR: 9.9% Airport Transient ADR: 1.5% Group ADR: 6.8% San Mateo/Redwood City Transient ADR: -3.8% Group ADR: 9.6% San Francisco Submarkets September 2016 YTD

22 Group ADR > Transient ADR within 3 submarkets Transient ADR Group ADR $ $ $ $ $ $ $ $ $ $ San Francisco Area Nob Hill/Wharf Market/CBD Airport San Mateo/Redwood City Customer Segmentation: Actual ADR by submarket, September YTD Transient vs. Group
23 Pipeline

24 Select Service Construction Is The Name Of The Game % Luxury Upper Upscale Upscale Upper Midscale Midscale Economy Unaffiliated U.S. Pipeline, Rooms Under Construction, 000s Rooms, by Scale, September 2016
25 Construction In Top 26 Markets: 23 With 2%+ Of Supply Market Rooms U/C % Of Existing Orlando, FL 1,129 1% Norfolk/Virginia Beach, VA 456 1% Oahu Island, HI 410 1% St Louis, MO-IL 864 2% Atlanta, GA 2,210 2% Las Vegas, NV 3,859 2% Washington, DC-MD-VA 3,137 3% Detroit, MI 1,270 3% San Diego, CA 1,866 3% San Francisco/San Mateo, CA 1,580 3% Phoenix, AZ 2,019 3% Minneapolis/St Paul, MN-WI 1,401 3% Chicago, IL 4,175 4% Anaheim/Santa Ana, CA 2,127 4% Boston, MA 2,292 4% Tampa/St Petersburg, FL 1,966 4% New Orleans, LA 1,786 5% Philadelphia, PA-NJ 2,659 6% Los Angeles/Long Beach, CA 5,921 6% Miami/Hialeah, FL 3,377 6% Houston, TX 5,305 6% Dallas, TX 5,567 7% Nashville, TN 3,549 9% Denver, CO 4,470 10% Seattle, WA 4,955 12% New York, NY 16,462 15% *US Pipeline, Top 26 Markets, U/C Rooms as % of Existing Supply, September 2016
26 Outlook
27 Notable Calendar Shifts Impacting Lodging Performance Data in 2016: Super Bowl: Easter: Jewish Holidays: From Phoenix to San Francisco From April to March From September to October July and December will have two more Weekend days (Net +) May will have two fewer Weekend days (Net -) Leap Day February 29 th (No Impact To Results) See:
 2016-2017 Outlook 2016 Forecast 2017 Forecast Supply 1.6% 2.0% Demand 1.6% 1.6% Occupancy 0.")
28 Total United States Key Performance Indicator Outlook (% Change vs. Prior Year) Outlook 2016 Forecast 2017 Forecast Supply 1.6% 2.0% Demand 1.6% 1.6% Occupancy 0.0% -0.3% ADR 3.2% 3.1% RevPAR 3.2% 2.8%
29 2016 Year End RevPAR Forecast Top 25 US Markets, Aug 2016 Forecast (Markets sorted alphabetically) -10% to -5% -5% to 0% 0% to 5% 5% to 10% Houston, TX Miami-Hialeah, FL Anaheim-Santa Ana, CA Dallas, TX New Orleans, LA Atlanta, GA Los Angeles-Long Beach, CA New York, NY Boston, MA Nashville, TN Chicago, IL Norfolk-Virginia Beach, VA Denver, CO San Francisco/San Mateo, CA Detroit, MI Minneapolis-St. Paul, MN-WI Oahu Island, HI Orlando, FL Philadelphia, PA-NJ Phoenix, AZ San Diego, CA Seattle, WA St. Louis, MO-IL Washington, D.C. Tampa, FL
30 2017 Year End RevPAR Forecast Top 25 US Markets, Aug 2016 Forecast (Markets sorted alphabetically) -5% to 0% 0% to 5% 5% to 10% Houston, TX Atlanta, GA Anaheim-Santa Ana, CA Boston, MA Detroit, MI Chicago, IL Washington, D.C. Dallas, TX Denver, CO Los Angeles-Long Beach, CA Miami-Hialeah, FL Minneapolis-St. Paul, MN-WI Nashville, TN New Orleans, LA New York, NY Norfolk-Virginia Beach, VA Oahu Island, HI Orlando, FL Philadelphia, PA-NJ Phoenix, AZ San Diego, CA San Francisco/San Mateo, CA Seattle, WA St. Louis, MO-IL Tampa, FL
31 Outlook as of March 2016 *using 4 th quarter 2015 data
32 As of March 2016 San Francisco Market Outlook 2015 Actual 2016 Forecast 2017 Forecast Occupancy % % % ADR $ % $ % $ % RevPAR $ % $ % $ % Key Performance Indicator Outlook (% Change vs. Prior Year) Actual 2015 Forecast YE
33 As of March 2016 Oakland Market Outlook 2015 Actual 2016 Forecast 2017 Forecast Occupancy % % % ADR $ % $ % $ % RevPAR $ % $ % $ % Key Performance Indicator Outlook (% Change vs. Prior Year) Actual 2015 Forecast YE
34 As of March 2016 Sacramento Market Outlook 2015 Actual 2016 Forecast 2017 Forecast Occupancy % % % ADR $ % $ % $ % RevPAR $ % $ % $ % Key Performance Indicator Outlook (% Change vs. Prior Year) Actual 2015 Forecast YE
35 As of March 2016 Silicon Valley Sub-Market Outlook 2015 Actual 2016 Forecast 2017 Forecast Occupancy % % % ADR $ % $ % $ % RevPAR $ % $ % $ % Key Performance Indicator Outlook (% Change vs. Prior Year) Actual 2015 Forecast YE
36 As of March 2016 San Fran CBD Sub-Market Outlook 2015 Actual 2016 Forecast 2017 Forecast Occupancy % % % ADR $ % $ % $ % RevPAR $ % $ % $ % Key Performance Indicator Outlook (% Change vs. Prior Year) Actual 2015 Forecast YE
37 Outlook as of October 2016 *using 3 rd Quarter 2016 data
38 As of October 2016 San Francisco Market Outlook 2015 Actual 2016 Forecast 2017 Forecast Occupancy % % % ADR $ % $ % $ % RevPAR $ % $ % $ % Key Performance Indicator Outlook (% Change vs. Prior Year) Actual 2015 Forecast YE As of August 2016 forecast report
39 As of October 2016 Oakland Market Outlook 2015 Actual 2016 Forecast 2017 Forecast Occupancy % % % ADR $ % $ % $ % RevPAR $ % $ % $ % Key Performance Indicator Outlook (% Change vs. Prior Year) Actual 2015 Forecast YE
40 As of October 2016 Sacramento Market Outlook 2015 Actual 2016 Forecast 2017 Forecast Occupancy % % % ADR $ % $ % $ % RevPAR $ % $ % $ % Key Performance Indicator Outlook (% Change vs. Prior Year) Actual 2015 Forecast YE As of August 2016 forecast report
41 As of October 2016 Silicon Valley Sub-Market Outlook 2015 Actual 2016 Forecast 2017 Forecast Occupancy % % % ADR $ % $ % $ % RevPAR $ % $ % $ % Key Performance Indicator Outlook (% Change vs. Prior Year) Actual 2015 Forecast YE As of August 2016 forecast report
42 As of October 2016 San Fran CBD Sub-Market Outlook 2015 Actual 2016 Forecast 2017 Forecast Occupancy % % % ADR $ % $ % $ % RevPAR $ % $ % $ % Key Performance Indicator Outlook (% Change vs. Prior Year) Actual 2015 Forecast YE As of August 2016 forecast report
43 To wrap it up. Total U.S. Slowing down KPI growth however still positive growth Northern CA Markets & Submarkets All RevPAR growth coming from ADR Group ADR > Transient ADR 3 out of 5 submarkets. Overall 2016 and 2017 outlook is good above U.S. RevPAR forecast
44 San Francisco Outlook So, for certain the expansion of Moscone is complicated and there is no question group demand will be affected. However what is unknown is how much unaccommodated demand is sitting on top of the market right now. If there are high levels of unaccommodated demand, much of that will fill the gaps created by the loss of group demand, effectively changing the market mix of the area for the short-term. It s our contention that at the current high levels of accommodated demand (85% OCC), there is plentiful unaccommodated demand to mitigate the impact caused by the expansion. While we see occupancy declining a bit, those high levels should still allow for pricing power (albeit at softer rates than the past several years), resulting in positive RevPAR. However, overall CBD RevPAR growth is still expected to be substantially lower than in 2015 and 2016, which is in-line with the Tourism Economics forecast for the greater market. Carter Wilson Vice President of Consulting & Analytics, STR
45 Questions? Thank you!
2/25/2019. Taking the northern and southern hemispheres together, on average the world s population lives 24 degrees from the equator.
 Where is the world s population? Roughly 88 percent of the world s population lives in the Northern Hemisphere, with about half north of 27 degrees north Taking the northern and southern hemispheres together,
ASSESSING ACCURACY: HOTEL HORIZONS FORECASTS
 ASSESSING ACCURACY: HOTEL HORIZONS FORECASTS April 13, 2016 EXECUTIVE SUMMARY The US hotel industry had another strong year in 2015 with RevPAR up 6.3 percent over the prior year. In this report, we examine
Research Update: Race and Male Joblessness in Milwaukee: 2008
 Research Update: Race and Male Joblessness in Milwaukee: 2008 by: Marc V. Levine University of Wisconsin Milwaukee Center for Economic Development Briefing Paper September 2009 Overview Over the past decade,
Lesson 1 - Pre-Visit Safe at Home: Location, Place, and Baseball
 Lesson 1 - Pre-Visit Safe at Home: Location, Place, and Baseball Objective: Students will be able to: Define location and place, two of the five themes of geography. Give reasons for the use of latitude
Vibrancy and Property Performance of Major U.S. Employment Centers. Appendix A
 Appendix A DOWNTOWN VIBRANCY SCORES Atlanta 103.3 Minneapolis 152.8 Austin 112.3 Nashville 83.5 Baltimore 151.3 New Orleans 124.3 Birmingham 59.3 New York Midtown 448.6 Charlotte 94.1 Oakland 157.7 Chicago
LODGING FORECAST ACCURACY
 tourismeconomics.com LODGING FORECAST ACCURACY 2016 ASSESSMENT JUNE 2017 We recently revisited our previous forecasts for US lodging industry performance to assess accuracy. This evaluation shows that
NAWIC. National Association of Women in Construction. Membership Report. August 2009
 NAWIC National Association of Women in Construction Membership Report August 2009 Core Purpose: To enhance the success of women in the construction industry Region 1 67 Gr Washington, DC 9 16 2 3 1 0 0
Using the ACS to track the economic performance of U.S. inner cities
 Using the ACS to track the economic performance of U.S. inner cities 2017 ACS Data Users Conference May 11, 2017 Austin Nijhuis, Senior Research Analyst Initiative for a Competitive Inner (ICIC) ICIC ICIC
Authors: Antonella Zanobetti and Joel Schwartz
 Title: Mortality Displacement in the Association of Ozone with Mortality: An Analysis of 48 US Cities Authors: Antonella Zanobetti and Joel Schwartz ONLINE DATA SUPPLEMENT Additional Information on Materials
U.S. Sugar Monthly Import and Re-Exports
 U.S. Sugar Monthly Import and Re-Exports Fiscal Year (FY) 2018 Report July 2018 The July WASDE report shows FY 2018 WTO raw sugar tariff-rate quota (TRQ) shortfall projected at 99,208 short tons raw value
Powder River Basin Coal Update
 Powder River Basin Coal Update Tom Kraemer Group Vice President Coal Southwest Power Pool Regional State Committee October 24, 2005 - Santa Fe, NM Discussion Topics BNSF coal transportation Historic PRB
North American Geography. Lesson 5: Barnstorm Like a Tennis Player!
 North American Geography Lesson 5: Barnstorm Like a Tennis Player! Unit Overview: As students work through the activities in this unit they will be introduced to the United States in general, different
Non-Parametric Two-Sample Analysis: The Mann-Whitney U Test
 Non-Parametric Two-Sample Analysis: The Mann-Whitney U Test When samples do not meet the assumption of normality parametric tests should not be used. To overcome this problem, non-parametric tests can
T H E E C O N O M Y A N D M U LT I F A M I LY M A R K E T S J U N E
 T H E E C O N O M Y A N D M U LT I F A M I LY M A R K E T S IN THE WASHINGTON METRO AREA J U N E 2 0 1 5 A G E N DA 1. National and Regional Economy 2. Demographic Shifts Impact Multifamily Design 3. Washington
Using Census Public Use Microdata Areas (PUMAs) as Primary Sampling Units in Area Probability Household Surveys
 as Primary Sampling Units in Area Probability Household Surveys") Using Census Public Use Microdata Areas (PUMAs) as Primary Sampling Units in Area Probability Household Surveys Joe McMichael, Patrick Chen RTI International, 1 3040 Cornwallis Road, Research Triangle
Using Census Public Use Microdata Areas (PUMAs) as Primary Sampling Units in Area Probability Household Surveys Joe McMichael, Patrick Chen RTI International, 1 3040 Cornwallis Road, Research Triangle
SMART GRID FORECASTING
 SMART GRID FORECASTING AND FINANCIAL ANALYTICS Itron Forecasting Brown Bag December 11, 2012 PLEASE REMEMBER» Phones are Muted: In order to help this session run smoothly, your phones are muted.» Full
C Further Concepts in Statistics
 Appendix C.1 Representing Data and Linear Modeling C1 C Further Concepts in Statistics C.1 Representing Data and Linear Modeling Use stem-and-leaf plots to organize and compare sets of data. Use histograms
Online Appendix for Inventory and Shipment Policies for the Online Movie DVD Rental Industry
 Online Appendix for Inventory and Shipment Policies for the Online Movie DVD Rental Industry Kyung Sung Jung, Casey Chung, Shun-Chen Niu, Chelliah Sriskandarajah e-mail: ksjung@ufl.edu, cxchung@caleres.com,
Invoice Information. Remittance Account Number: Invoice Number: Invoice Date: Due Date: Total Amount Due: PLEASE SEND PAYMENT TO:
 Easton Telecom Services, LLC PO Box 550 Richfield, OH 44286 Customer Service: 800-222-8122 Fax Number: 800-227-8420 custservice@eastontel.com Invoice Information Billing Summary Descriptions Charges /
HI SUMMER WORK
 HI-201 2018-2019 SUMMER WORK This packet belongs to: Dear Dual Enrollment Student, May 7 th, 2018 Dual Enrollment United States History is a challenging adventure. Though the year holds countless hours
Kathryn Robinson. Grades 3-5. From the Just Turn & Share Centers Series VOLUME 12
 1 2 From the Just Turn & Share Centers Series VOLUME 12 Temperature TM From the Just Turn & Share Centers Series Kathryn Robinson 3 4 M Enterprises WriteMath Enterprises 2303 Marseille Ct. Suite 104 Valrico,
Public Library Use and Economic Hard Times: Analysis of Recent Data
 Public Library Use and Economic Hard Times: Analysis of Recent Data A Report Prepared for The American Library Association by The Library Research Center University of Illinois at Urbana Champaign April
Nursing Facilities' Life Safety Standard Survey Results Quarterly Reference Tables
 Nursing Facilities' Life Safety Standard Survey Results Quarterly Reference Tables Table of Contents Table 1: Summary of Life Safety Survey Results by State Table 2: Ten Most Frequently Cited Life Safety
Interested in learning more? Global Information Assurance Certification Paper. Copyright SANS Institute Author Retains Full Rights
 Global Information Assurance Certification Paper Copyright SANS Institute Author Retains Full Rights This paper is taken from the GIAC directory of certified professionals. Reposting is not permited without
Speed. June Victor Couture (U. Toronto) Gilles Duranton (U. Toronto) Matt Turner (U. Toronto)
 Gilles Duranton (U. Toronto) Matt Turner (U. Toronto)") Speed June 2012 Victor Couture (U. Toronto) Gilles Duranton (U. Toronto) Matt Turner (U. Toronto) Objectives: Assess differences in driving speed across us metropolitan areas Explore their determinants
Speed June 2012 Victor Couture (U. Toronto) Gilles Duranton (U. Toronto) Matt Turner (U. Toronto) Objectives: Assess differences in driving speed across us metropolitan areas Explore their determinants
Climate Uncovered: Media Fail to Connect Hurricane Florence to Climate Change
 September 18, 2018 Climate Uncovered: Media Fail to Connect Hurricane Florence to Climate Change One of the clearest and most devastating impacts of climate change has been the intensification of the harm
Investigation 11.3 Weather Maps
 Name: Date: Investigation 11.3 Weather Maps What can you identify weather patterns based on information read on a weather map? There have been some amazing technological advancements in the gathering and
Smart Magnets for Smart Product Design: Advanced Topics
 Smart Magnets for Smart Product Design: Advanced Topics Today s Presenter Jason Morgan Vice President Engineering Correlated Magnetics Research 6 Agenda Brief overview of Correlated Magnetics Research
arc setup and seasonal adjustments manual Solar timepiece
 arc setup and seasonal adjustments manual Solar timepiece 1 Welcome / Care of your heliosphere Parts of your Heliosphere Welcome to experiencing solar time for your specific spot on the globe with your
Kenneth Shelton, Assistant Superintendent, Business Services Los Angeles County Office of Education 9300 Imperial Highway Downey, CA 90242
 April 17, 2009 Kenneth Shelton, Assistant Superintendent, Business Services Los Angeles County Office of Education 9300 Imperial Highway Downey, CA 90242 Dear Assistant Superintendent Shelton: The purpose
Solving Quadratic Equations by Graphing 6.1. ft /sec. The height of the arrow h(t) in terms
 in terms") Quadratic Function f ( x) ax bx c Solving Quadratic Equations by Graphing 6.1 Write each in quadratic form. Example 1 f ( x) 3( x + ) Example Graph f ( x) x + 6 x + 8 Example 3 An arrow is shot upward
Quadratic Function f ( x) ax bx c Solving Quadratic Equations by Graphing 6.1 Write each in quadratic form. Example 1 f ( x) 3( x + ) Example Graph f ( x) x + 6 x + 8 Example 3 An arrow is shot upward
The Elusive Connection between Density and Transit Use
 The Elusive Connection between Density and Transit Use Abstract: The connection between density and transportation is heralded by planners, yet results are often elusive. This paper analyzes two regions,
PREPARED DIRECT TESTIMONY OF GREGORY TEPLOW SOUTHERN CALIFORNIA GAS COMPANY AND SAN DIEGO GAS & ELECTRIC COMPANY
 Application No: A.1-0- Exhibit No.: Witness: Gregory Teplow Application of Southern California Gas Company (U 0 G) and San Diego Gas & Electric Company (U 0 G) for Authority to Revise their Natural Gas
Annual Performance Report: State Assessment Data
 Annual Performance Report: 2005-2006 State Assessment Data Summary Prepared by: Martha Thurlow, Jason Altman, Damien Cormier, and Ross Moen National Center on Educational Outcomes (NCEO) April, 2008 The
BEFORE THE PUBLIC UTILITIES COMMISSION OF THE STATE OF COLORADO * * * * *
 BEFORE THE PUBLIC UTILITIES COMMISSION OF THE STATE OF COLORADO * * * * * IN THE MATTER OF THE APPLICATION OF PUBLIC SERVICE COMPANY OF COLORADO FOR APPROVAL OF ITS 01 RENEWABLE ENERGY STANDARD COMPLIANCE
Chapter 4: Displaying and Summarizing Quantitative Data
 Chapter 4: Displaying and Summarizing Quantitative Data This chapter discusses methods of displaying quantitative data. The objective is describe the distribution of the data. The figure below shows three
RNR 516A. Computer Cartography. Spring GIS Portfolio
 RNR 516A Computer Cartography Spring 2016 GIS Portfolio 1 Contents 1 Political and Locator Maps 3 2 Base Maps and Digitizing 4 3 Data Entry Report 5 4 Projections and Symbolization 6 5 Choropleth Mapping
Forecasting the 2012 Presidential Election from History and the Polls
 Forecasting the 2012 Presidential Election from History and the Polls Drew Linzer Assistant Professor Emory University Department of Political Science Visiting Assistant Professor, 2012-13 Stanford University
Impacts of Transit Rail Lines on Property Values
 Impacts of Transit Rail Lines on Property Values Rail~Volution 2007 Introduction The Question Research Tools Methodology Examples Results Question Won t transit in my backyard hurt my property value?
REVISED UPDATED PREPARED DIRECT SAFETY ENHANCEMENT COST ALLOCATION TESTIMONY OF GARY LENART SAN DIEGO GAS & ELECTRIC COMPANY AND
 Application No: Exhibit No.: Witness: A.--00 ) In the Matter of the Application of San Diego Gas & ) Electric Company (U 0 G) and Southern California ) Gas Company (U 0 G) for Authority to Revise ) Their
SHSU ECONOMICS WORKING PAPER
 Sam Houston State University Department of Economics and International Business Working Paper Series Unbiased Estimation of the Half-Life to Price Index Convergence among US Cities Hiranya K Nath and Jayanta
Transferability of Household Travel Data Across Geographic Areas Using NHTS 2001
 Transferability of Household Travel Data Across Geographic Areas Using NHTS 2001 Jane Lin PhD Assistant Professor Department of Civil and Materials Engineering Institute for Environmental Science and Policy
American Tour: Climate Objective To introduce contour maps as data displays.
 American Tour: Climate Objective To introduce contour maps as data displays. www.everydaymathonline.com epresentations etoolkit Algorithms Practice EM Facts Workshop Game Family Letters Assessment Management
Urban Revival in America
 Urban Revival in America Victor Couture 1 Jessie Handbury 2 1 University of California, Berkeley 2 University of Pennsylvania and NBER May 2016 1 / 23 Objectives 1. Document the recent revival of America
What Lies Beneath: A Sub- National Look at Okun s Law for the United States.
 What Lies Beneath: A Sub- National Look at Okun s Law for the United States. Nathalie Gonzalez Prieto International Monetary Fund Global Labor Markets Workshop Paris, September 1-2, 2016 What the paper
VISITING OUR OFFICE IN MINDEN.
 MINDEN Hotel recommendations Flight Information Time Zones Airport Information Landmarks and driving distance Car Rentals Weather Climate GOOD TO KNOW VISITING OUR OFFICE IN MINDEN. 2243 Park Place Suite
ASSOCIATION OF SCIENCE MUSEUM DIRECTORS OFFICER INFORMATION FROM INCEPTION IN 1959 TO TODAY
 ASSOCIATION OF SCIENCE MUSEUM DIRECTORS OFFICER INFORMATION FROM INCEPTION IN 1959 TO TODAY 2018 Sarah George, Natural History Museum of Utah, Salt Lake City Utah Vice- Julie Stein, Burke Museum, Seattle,
AGEC 603. Stylized Cited Assumptions. Urban Density. Urban Density and Structures. q = a constant density the same throughout
 AGEC 603 Urban Density and Structures Stylized Cited Assumptions q = a constant density the same throughout c = constant structures the same throughout Reality housing is very heterogeneous Lot size varies
WEATHER NORMALIZATION METHODS AND ISSUES. Stuart McMenamin Mark Quan David Simons
 WEATHER NORMALIZATION METHODS AND ISSUES Stuart McMenamin Mark Quan David Simons Itron Forecasting Brown Bag September 17, 2013 Please Remember» Phones are Muted: In order to help this session run smoothly,
Multivariate Regression Model Results
 Updated: August, 0 Page of Multivariate Regression Model Results 4 5 6 7 8 This exhibit provides the results of the load model forecast discussed in Schedule. Included is the forecast of short term system
Making a Climograph: GLOBE Data Explorations
 Making a Climograph: A GLOBE Data Exploration Purpose Students learn how to construct and interpret climographs and understand how climate differs from weather. Overview Students calculate and graph maximum
2013 FORECAST ACCURACY BENCHMARKING SURVEY AND ENERGY
 2013 FORECAST ACCURACY BENCHMARKING SURVEY AND ENERGY Itron Forecasting Brown Bag June 4, 2013 Please Remember» Phones are Muted: In order to help this session run smoothly, your phones are muted.» Full
Short-Term Job Growth Impacts of Hurricane Harvey on the Gulf Coast and Texas
 Short-Term Job Growth Impacts of Hurricane Harvey on the Gulf Coast and Texas Keith Phillips & Christopher Slijk Federal Reserve Bank of Dallas San Antonio Branch The views expressed in this presentation
Scaling in Biology. How do properties of living systems change as their size is varied?
 Scaling in Biology How do properties of living systems change as their size is varied? Example: How does basal metabolic rate (heat radiation) vary as a function of an animal s body mass? Mouse Hamster
Unit 6: Industrialization and Development Part 3-4
 Unit 6: Industrialization and Development Part 3-4 ORIGINAL AUTHOR UNKNOWN, but appreciated greatly! Additional information added by A. Parkhurst, M.Ed. 2015 1 Part Three: The Evolution of Economic Cores
2019 Settlement Calendar for ASX Cash Market Products. ASX Settlement
 2019 Settlement Calendar for ASX Cash Market Products ASX Settlement Settlement Calendar for ASX Cash Market Products 1 ASX Settlement Pty Limited (ASX Settlement) operates a trade date plus two Business
Sluggish Economy Puts Pinch on Manufacturing Technology Orders
 Updated Release: June 13, 2016 Contact: Penny Brown, AMT, 703-827-5275 pbrown@amtonline.org Sluggish Economy Puts Pinch on Manufacturing Technology Orders Manufacturing technology orders for were down
22 cities with at least 10 million people See map for cities with red dots
 22 cities with at least 10 million people See map for cities with red dots Seven of these are in LDC s, more in future Fastest growing, high natural increase rates, loss of farming jobs and resulting migration
Viewpoint Integra Realty Resources Real Estate Value Trends
 Viewpoint 0 Integra Realty Resources Real Estate Value Trends 55 N. Wacker Drive, Chicago, Illinois Local Expertise. National Reach. Integra Realty Resources, Inc. provides world-class commercial real
Published by ASX Settlement Pty Limited A.B.N Settlement Calendar for ASX Cash Market Products
 Published by Pty Limited A.B.N. 49 008 504 532 2012 Calendar for Cash Market Products Calendar for Cash Market Products¹ Pty Limited ( ) operates a trade date plus three Business (T+3) settlement discipline
2017 Settlement Calendar for ASX Cash Market Products ASX SETTLEMENT
 2017 Settlement Calendar for ASX Cash Market Products ASX SETTLEMENT Settlement Calendar for ASX Cash Market Products 1 ASX Settlement Pty Limited (ASX Settlement) operates a trade date plus two Business
CHAPTER 6: AIR MASSES & WEATHER PATTERNS
 CHAPTER 6: AIR MASSES & WEATHER PATTERNS METEOROLOGY NAME: PERIOD: Chapter 6 - Air Masses & Weather Patterns 1 Mr. Mihalik, Room 442 YOUR SHOT AT FORECASTING The project we ve all been waiting for... you
Cluster Analysis. Part of the Michigan Prosperity Initiative
 Cluster Analysis Part of the Michigan Prosperity Initiative 6/17/2010 Land Policy Institute Contributors Dr. Soji Adelaja, Director Jason Ball, Visiting Academic Specialist Jonathon Baird, Research Assistant
Name Period Date. Analyzing Climographs
 Name Period Date Analyzing Climographs Climographs: It is often helpful to plot two different types of data on the same graph. For example, a climograph is a single graph that charts both the average temperature
Meteorology 110. Lab 1. Geography and Map Skills
 Meteorology 110 Name Lab 1 Geography and Map Skills 1. Geography Weather involves maps. There s no getting around it. You must know where places are so when they are mentioned in the course it won t be
FROM HOT TO COLD. The Business Impact of Extreme Weather in the Winter
 FROM HOT TO COLD The Business Impact of Extreme Weather in the 2013-2014 Winter Regions Across the Country Experienced Extreme Temperatures December 2013-February 2014 Temperatures Compared to the Previous
Your Galactic Address
 How Big is the Universe? Usually you think of your address as only three or four lines long: your name, street, city, and state. But to address a letter to a friend in a distant galaxy, you have to specify
Exercises 36 CHAPTER 2/ORGANIZATION AND DESCRIPTION OF DATA
 36 CHAPTER 2/ORGANIZATION AND DESCRIPTION OF DATA In the stem-and-leaf display, the column of first digits to the left of the vertical line is viewed as the stem, and the second digits as the leaves. Viewed
Analyzing Severe Weather Data
 Chapter Weather Patterns and Severe Storms Investigation A Analyzing Severe Weather Data Introduction Tornadoes are violent windstorms associated with severe thunderstorms. Meteorologists carefully monitor
Verification Of January HDD Forecasts
 Verification Of January HDD Forecasts W2020 / Average HDD stands for Heating Degree Day. A Heating Degree Day is zero if the average temperature is 65 degrees. An HDD of -30 would mean an average temperature
Appendix 5 Summary of State Trademark Registration Provisions (as of July 2016)
") Appendix 5 Summary of State Trademark Registration Provisions (as of July 2016) App. 5-1 Registration Renewal Assignments Dates Term # of of 1st # of Use # of Form Serv. Key & State (Years) Fee Spec. Use
Appendix 5 Summary of State Trademark Registration Provisions (as of July 2016) App. 5-1 Registration Renewal Assignments Dates Term # of of 1st # of Use # of Form Serv. Key & State (Years) Fee Spec. Use
2018 Annual Review of Availability Assessment Hours
 2018 Annual Review of Availability Assessment Hours Amber Motley Manager, Short Term Forecasting Clyde Loutan Principal, Renewable Energy Integration Karl Meeusen Senior Advisor, Infrastructure & Regulatory
Daily Operations Briefing Tuesday, May 14, 2013 As of 8:30 a.m. EDT
 Daily Operations Briefing Tuesday, May 14, 2013 As of 8:30 a.m. EDT 1 Significant Activity: May 13-14 Significant Events: None Significant Weather: Rain & thunderstorms: Northern Plains to Mid-Atlantic;
Weather FActors. May 8 4:15 PM. Analyzing AIR MASSES & THEIR MOVEMENT
 ` Weather FActors P: Analyze weather Q: What are the factors that cause weather? May 8 4:15 PM Analyzing AIR MASSES & THEIR MOVEMENT Read and take notes... Using pages 72-79: (IN YOUR JOURNAL!) - Identify
Heidi B. Hammel. AURA Executive Vice President. Presented to the NRC OIR System Committee 13 October 2014
 Heidi B. Hammel AURA Executive Vice President Presented to the NRC OIR System Committee 13 October 2014 AURA basics Non-profit started in 1957 as a consortium of universities established to manage public
2129 NORTH MAIN STREET HOTE PROJECT ULI SHARED PARKING STUDY City of Santa Ana, California
 2129 NORTH MAIN STREET HOTE PROJECT ULI SHARED PARKING STUDY City of Santa Ana, California Prepared for: NET DEVELOPMENT COMPANY 3130 Airway Avenue Costa Mesa, CA 92626 Prepared by: RK ENGINEERING GROUP,
Daily Operations Briefing Saturday, March 26, :30 a.m. EDT
 Daily Operations Briefing Saturday, March 26, 2016 8:30 a.m. EDT Significant Activity: March 25-26 Significant Events: None Significant Weather: Rain Pacific Northwest to Northern Intermountain; Southern
STATISTICAL FORECASTING and SEASONALITY (M. E. Ippolito; )
") STATISTICAL FORECASTING and SEASONALITY (M. E. Ippolito; 10-6-13) PART I OVERVIEW The following discussion expands upon exponential smoothing and seasonality as presented in Chapter 11, Forecasting, in
STATISTICAL FORECASTING and SEASONALITY (M. E. Ippolito; 10-6-13) PART I OVERVIEW The following discussion expands upon exponential smoothing and seasonality as presented in Chapter 11, Forecasting, in
Daily Operations Briefing Tuesday, November 5, :30 a.m. EST
 Daily Operations Briefing Tuesday, November 5, 2013 8:30 a.m. EST 1 Significant Activity: Nov 4 5 Significant Events: None Tropical Activity: Atlantic No tropical cyclone activity expected next 48 hours
NCTCOG Regional GIS Meeting 6-Years and Going Strong. May 15, 2018 hosted by: Tarrant County
 NCTCOG Regional GIS Meeting 6-Years and Going Strong May 15, 2018 hosted by: Tarrant County Woolpert at a Glance 1911 Founded in Dayton, Ohio 25+ Offices across the nation 800+ Global employees 25+ OFFICES
AMS. calendar of meetings AMERICAN METEOROLOGICAL SOCIETY. Anaheim, CA. *73rd AMS Annual Meeting January January
 Monterey, Mexico Salt Lake City, UT Albuquerque, NM Hobart, Australia Orlando, FL Seattle, WA Wiesbaden, Germany San Antonio, TX 16-18 February 8-12 March 22-25 March 29 March-2 April 14-16 April 13-16
Summary of Natural Hazard Statistics for 2008 in the United States
 Summary of Natural Hazard Statistics for 2008 in the United States This National Weather Service (NWS) report summarizes fatalities, injuries and damages caused by severe weather in 2008. The NWS Office
2006 Supplemental Tax Information for JennisonDryden and Strategic Partners Funds
 2006 Supplemental Information for JennisonDryden and Strategic Partners s We have compiled the following information to help you prepare your 2006 federal and state tax returns: Percentage of income from
Lab Activity: Weather Variables
 Name: Date: Period: Weather The Physical Setting: Earth Science Lab Activity: Weather Variables INTRODUCTION: A meteorologist is an individual with specialized education who uses scientific principles
Daily Operations Briefing Wednesday, November 6, :30 a.m. EST
 Daily Operations Briefing Wednesday, November 6, 2013 8:30 a.m. EST 1 Significant Activity: Nov 5 6 Significant Events: None Tropical Activity: Atlantic/Eastern Pacific No tropical cyclone activity expected
arxiv: v1 [q-bio.pe] 19 Dec 2012
![arxiv: v1 [q-bio.pe] 19 Dec 2012](/thumbs/88/114673757.jpg "arxiv: v1 [q-bio.pe] 19 Dec 2012") Week 49 Influenza Forecast for the 2012-2013 U.S. Season JEFFREY SHAMAN Department of Environmental Health Sciences, Mailman School of Public Health, Columbia University, New York, New York arxiv:1212.4678v1
Week 49 Influenza Forecast for the 2012-2013 U.S. Season JEFFREY SHAMAN Department of Environmental Health Sciences, Mailman School of Public Health, Columbia University, New York, New York arxiv:1212.4678v1
Every state in the nation experienced a record warm daily temperature during March.
 Monthly Long Range Weather Commentary Issued: April 05, 2012 Steven A. Root, CCM, President/CEO sroot@weatherbank.com March 2012 Record and near record breaking temperatures dominated the eastern two thirds
Hayward, P. (2007). Mexican-American assimilation in U.S. metropolitan areas. The Pennsylvania Geographer, 45(1), 3-15.
. Mexican-American assimilation in U.S. metropolitan areas. The Pennsylvania Geographer, 45(1), 3-15.") PETER HAYWARD Assistant Professor of Geography and GIS Faculty Fellow SUNY College at Oneonta 323 Milne Library Oneonta, NY 13820 Phone: 607-436-3398 Email: haywarpm@oneonta.edu Web: http://employees.oneonta.edu/haywarpm
PETER HAYWARD Assistant Professor of Geography and GIS Faculty Fellow SUNY College at Oneonta 323 Milne Library Oneonta, NY 13820 Phone: 607-436-3398 Email: haywarpm@oneonta.edu Web: http://employees.oneonta.edu/haywarpm
Lecture 26 Section 8.4. Mon, Oct 13, 2008
 Lecture 26 Section 8.4 Hampden-Sydney College Mon, Oct 13, 2008 Outline 1 2 3 4 Exercise 8.12, page 528. Suppose that 60% of all students at a large university access course information using the Internet.
Compact city policies: a comparative assessment
 Compact city policies: a comparative TADASHI MATSUMOTO Organisation for Economic Co-operation and Development (OECD) Presentation at the UNECE-OECD seminar September 26, 2012, Geneva Outline of the study
34 ab ArchitectureBoston
 Postmodern theorists writing in the late 20th-century once surmised that, during an era of airplanes, cell phones, and the Internet, the importance of geographical space was quickly diminishing. The French
Austin. What is a Public Market? The original gathering place. Worldwide, ancient phenomenon. Ripe for a Public Market?
 Downtown Austin Alliance September 25, 2013 What is a Public Market? Austin Ripe for a Public Market? Have Public Goals Operate in Public Spaces Serve Locally Owned and Operated Businesses The original
ZANER WHEN DOES WEATHER MATTER? For more information, call: Or visit: Zaner is proud to present
 ZANER The market has been under pressure the past three weeks. The 9 and 20 day moving average have met, for the first time since September and again falls below 40. Zaner is proud to present WHEN DOES
Daily Operations Briefing December 25, 2012 As of 6:30 a.m. EST
 Daily Operations Briefing December 25, 2012 As of 6:30 a.m. EST 1 Significant Activity: Dec 24-25 Significant Events: Possible Severe thunderstorms - Gulf Coast Sandy/Nor easter recovery Significant Weather:
SAMPLE AUDIT FORMAT. Pre Audit Notification Letter Draft. Dear Registrant:
 Pre Audit Notification Letter Draft Dear Registrant: The Pennsylvania Department of Transportation (PennDOT) is a member of the Federally Mandated International Registration Plan (IRP). As part of this
CITY OF MESQUITE Quarterly Investment Report Overview Quarter Ending September 30, 2018
 CITY OF MESQUITE Quarterly Investment Report Overview Quarter Ending September 30, 2018 Investment objectives are safety, liquidity, yield and public trust. Portfolio objective is to meet or exceed the
2006 & 2007 Pre-Hurricane Scenario Analyses
 2006 & 2007 Pre-Hurricane Scenario Analyses Executive Summary May 2007 Page 1 OF X FOR OFFICIAL USE ONLY 4 Public Availability to be Determined Under 5 U.S.C. 552 NOTE: Limited Distribution. Release of
Heat and Health: Reducing the Impact of the Leading Weather-Related Killer
 Heat and Health: Reducing the Impact of the Leading Weather-Related Killer Laurence S. Kalkstein, Ph.D. Department of Public Health Sciences Miller School of Medicine University of Miami June, 2017 Quick
Sample Statistics 5021 First Midterm Examination with solutions
 THE UNIVERSITY OF MINNESOTA Statistics 5021 February 12, 2003 Sample First Midterm Examination (with solutions) 1. Baseball pitcher Nolan Ryan played in 20 games or more in the 24 seasons from 1968 through
Trends in Metropolitan Network Circuity
 Trends in Metropolitan Network Circuity David J. Giacomin Luke S. James David M. Levinson Abstract Because people seek to minimize their time and travel distance (or cost) when commuting, the circuity