Module 10 Summative Assessment
|
|
|
- Derek Hancock
- 5 years ago
- Views:
Transcription
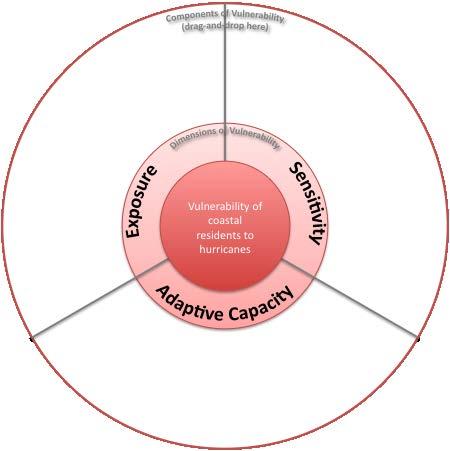
1 Module 10 Summative Assessment Activity In this activity you will use the three dimensions of vulnerability that you learned about in this module exposure, sensitivity, and adaptive capacity to assess and compare the vulnerability of residents in three coastal U.S. counties to hurricane winds and storm surge. As discussed above, each of these dimensions of vulnerability can have many components, with the exact components varying depending on the system being studied. The box below contains a list of components of the human-environment system that could contribute to the vulnerability of U.S. coastal residents to hurricane winds and storm surge. Each of the components in the box contributes primarily to one of the three dimensions of hurricane vulnerability: exposure, sensitivity, or adaptive capacity. To complete the first part of the activity, match each of these components with the appropriate dimension of hurricane vulnerability: Exposure, Sensitivity, or Adaptive Capacity. You can print out this document and write in the components directly on the diagram. This will help you to answer the questions in the first part of the Module 10 Assessment in ANGEL. Components To sort the components, create a text box in the correct VSD section in image below and add the component by either typing it or copy and pasting it. Storm Frequency Number of People in Hazard Zone Minority Populations Hard structures such as seawalls and levees Shape of Coastal Landscape Health Understanding or Perception of Risk Storm Intensity Vehicle availability Poverty Higher educational attainment Location of infrastructure in high risk areas 1

2 2
3 Now that you have assigned each of the components to the appropriate dimension, we will use measures of these components to evaluate and compare the vulnerability of coastal residents in three U.S. counties to hurricane wind and storm surge. The three counties you will be studying in this activity are Galveston County, Texas; St. Johns County, Florida; and Hudson County, New Jersey. These counties are all exposed to hurricane hazards, however their vulnerability differs in important ways. Over the course of this activity, you will learn how to measure many of the components of vulnerability in these places, and how to compare vulnerability across places and dimensions. Use the tables on Pages 4-5 to record the vulnerability measures for each county. Detailed instructions for how to find each measure are given starting on Page 8. After you have filled in all the measures, answer the questions in the Module 10 Assessment in ANGEL. 3
4 Dimension Exposure Components Coastal Landscape Hazard Frequency Measures Galveston County, Texas (Urban area: Galveston) Hudson County, New Jersey (Urban area: Jersey City) St. Johns County, Florida (Urban area: St. Augustine) Elevation at center of most important urban area (nearest m) Elevation of high point along transect from urban center to coast (nearest m) High point closer to urban center or to coast? Description of transect (for example, large hill near the coast, flat near urban center ) Number of hurricane strikes since 1900 Hazard Intensity Percentage of these strikes with category >= 3 Number of People in Hazard Zone 2010 county population Dimension Sensitivity Components Population Age Minority Populations Poverty Measures % Elderly Population % Child Population % Black % Hispanic % in Poverty (65+) (U-18) Galveston County (Texas) Hudson County (New Jersey) St. Johns County (Florida) 4
5 Dimension Adaptive Capacity Components Educational attainment Vehicle availability Household income Measures Percentage of people who have high school degrees Percentage of households which owns vehicles Median household incomes (US Dollars) or higher (100%-no vehicles) Galveston County (Texas) Hudson County (New Jersey) St. Johns County (Florida) 5
6 Questions: Exposure: Which county shows evidence of a hilly coastal landscape (a large elevation change from the coast to the urban center) that might reduce the exposure of its residents to hurricane storm surge? Which county has both a high frequency of storms and a high percentage of intense storms? Based on the 2010 population for the county as a whole, which county has the largest number of people in the hazard zone? Which county is the lowest in elevation, has had no strikes by major hurricanes (category >= 3) since 1900, and has the smallest 2010 population? Sensitivity: Which county has the highest percentage of Hispanic residents? Which county has the highest percentage of elderly residents? Which county has the highest poverty rate? Across all five measures for which you gathered data, is any one county clearly more sensitive than the others? Adaptive Capacity: Which county has the lowest percentage of people who have high school degree or higher? Which county has the highest percentage of households which own vehicles? Which county has the highest median household incomes? Based on the statistics, which one of the three counties has the highest adaptive capacities to hurricane hazards? Imagine that you are an NGO that is looking to invest in a community to help it improve its adaptive capacity for hurricanes. Based on the measures used in this activity, which of these three counties is most in need of your investment? 6
7 Overall Vulnerability: Which county has the second lowest adaptive capacity, and is also one of the most exposed to hurricanes? Which of the following is a reason why residents of St. Johns county may be more vulnerable to hurricanes than residents of the other two counties? Choose one of the following answers. A. They tend to be wealthier than residents of the other counties (higher median income) B. They experience more strong hurricanes than the other counties C. They have a higher percentage of elderly persons than the other counties D. They have a higher percentage of minority populations than the other counties Many studies have pointed out that hurricane frequency is an important determent on people s hurricane preparedness behaviors. Based on the statistics, in which one of the three counties might people lack of hurricane preparedness behaviors? When people need to evacuate for hurricanes, families with more children and more elderly generally have difficulty for evacuation because they rely on adults to help them. Based on the statistics, in which one of the three counties might families have more difficulty in evacuation? 7

8 Coastal Landscape As discussed earlier in this course, the elevation and shape of the coastal landscape plays an important role in determining the exposure of coastal residents to hurricane hazards, particularly storm surge. Generally speaking, areas with higher elevations and steep slopes tend to be less vulnerable to storm surge than areas with low elevation and gradual slopes. We will use Google Earth to explore how these two measures of the coastal landscape elevation and slope affect exposure to hurricane hazards in our three counties. These directions will walk you through how to answer the Coastal Landscape questions for the first county (Galveston, TX); you will then need to repeat these steps for the other two counties. To begin, open Google Earth. In the Layers window in the lower-left hand corner of the screen, expand the Borders and Labels item and make sure that the County Names, 2 nd Level Admin Regions (Counties) and the Populated Places items are all checked, as shown in the below screen shot. (It is OK if you also have other items checked.) Check here and here and here Then use the Search box in the upper left-hand corner to search for the location of the first county: Galveston County, Texas. Zoom in on the city of Galveston, the county seat. 8


9 Zoom in here Zoom until Galveston s urban area fills most of your window. Your screen should look similar to this: 9

 and the ocean.")

10 To find the elevation and slope of the coast in Galveston, we will create an elevation transect line from a point near the center of Galveston to the ocean. To begin, use the add path tool to draw the shortest possible straight line between the center of Galveston (shown by the red dot labeled Galveston ) and the ocean. The add path button is at the top left of the Google Earth window, as shown below (outlined in red). Clicking this button will open the New Path window. Type Galveston into the name field. Note that your mouse pointer now looks like a crosshair when you move it over the map. 10
 the red dot at the")


11 With the window still open, use the crosshair to click once near (but not on) the red dot at the center of Galveston, and then click one more time at the nearest point in the ocean. Your screen should now look like this: Note the straight line from Galveston to the ocean. Click OK to close the window. 11

12 In the places window on the right-hand side of your screen, find the item named Galveston that you just created, right click on it, and select Show Elevation Profile. Your window should now look like this: 12

13 The graph at the bottom of the screen shows the elevation at every point along the line from your starting point (Galveston city center, on the left) and your ending point (the ocean, on the right). If you run your mouse along the length of the graph, a red arrow will show you the corresponding location on the map. The elevation near the Galveston city center is about 2 m, so for the first measure of the coastal landscape ( Elevation at center of most important urban area ) in the table you should enter 2 m. The highest elevation along the transect is 5 m (the bump on the right side of the graph), and it occurs closer to the coast than the city center, so your answers for the second and third measures of the coastal landscape should be 5 m and coast, respectively. If you zoom in on the 5m tall feature near the coast, you can see that this is actually the famous Galveston Seawall, which was built after the devastating hurricane of 1900 to protect the city from storm surge. You can read more about the Galveston seawall and the hurricane of 1900 at 13
 After exploring the transect, complete the final coastal landscape question by briefly describing how elevation changes along the transect.")
14 Galveston Seawall under construction in 1905 (Source: re_battery,_fort_crockett_-_nara_-_ jpg) After exploring the transect, complete the final coastal landscape question by briefly describing how elevation changes along the transect. For example, a good description for the Galveston transect would be large rise near coast (seawall), very flat and low-lying near urban center. Now that you know how to create and interpret an elevation transect, repeat these steps for St. Johns County, Florida and Hudson County, New Jersey. In St. Johns county, use St. Augustine as the urban center. In Hudson County, use Jersey City. Hazard Frequency and Intensity Hazard frequency and intensity are essential components of most exposure assessments. The National Oceanic and Atmospheric Administration (NOAA) provides county-level historical hurricane information that we will use to calculate the frequency and intensity of hurricanes in our three counties. To find this historical hurricane information, go to the csc.noaa.gov/hurricanes/ website. Once there, click the County Strikes button at the top of the map to turn on the county-level summary of the number of hurricane hits since
.")


15 Click here Next, find your first county of interest (Galveston, Hudson, or St. Johns). You can either use the search tool in the upper left-hand corner of the webpage or you can zoom in on the map. For example, see below for a zoomed-in view of Galveston county. After you have found your county on the map, click on it. This will open a detailed report about that county s hurricane history. The hurricane history for Galveston County is shown below. 15
; red lines are strong, major hurricanes (categories 3-5). For our measure of frequency, count all of the red and green lines on the chart.")
16 Each of the green and red vertical lines on the chart represents a hurricane that struck the county. Green lines are weaker hurricanes (category 1 or 2); red lines are strong, major hurricanes (categories 3-5). For our measure of frequency, count all of the red and green lines on the chart. This is the total number of hurricane strikes on Galveston County since Tip: because many of the lines are close together, it may be easier to count the number of red and green flags than to count the lines. To get the percentage of these strikes that were category 3 or stronger (major hurricanes), first count just the number of red lines/flags (this is the number of major hurricane strikes since 1900). Then divide this number (red lines/flags only) by the total number of hurricane strikes (red and green lines/flags). This is our measure of hurricane intensity. PERCENTAGE OF STRIKES WITH = NUMBER OF RED LINES / 16
17 CATEGORY GREATER THAN OR EQUAL TO 3 NUMBER OF RED AND GREEN LINES After calculating hurricane frequency and intensity for your first county, repeat these steps for the other two counties. Note: If you have trouble accessing the hurricane history reports, you may also find them directly at the following links. Galveston County: =texas Hudson County: ew_jersey St. Johns County: florida Number of People in Hazard Zone A flat shoreline with a history of many intense hurricanes is only highly exposed to hurricane hazards if people actually live in the path of these storms. The county population from the 2010 census provides a measure of the number of people in each of the three counties that may be exposed to hurricane hazards. The distribution of this population within the county is also important; all other things being equal, a county where the population is concentrated close to the coast will be more exposed to hurricane hazards than a county where the population is concentrated further inland. However, since the three counties used in this activity do not extend very far inland, total county population can provide a reasonable estimate of the human component of their exposure to hurricane hazards. To find the total population for each county from the 2010 Census, navigate to the Census Bureau s homepage at On the Census Bureau homepage, there is a tab entitled Data at the top of the page. Hover your cursor over this tab, and select American FactFinder from the menu that appears. 17


18 Click Advanced Search in the navigation bar at the top of the page. Click Geographies in the left-hand column. Select County 050 from the dropdown menu. For Galveston County, select Texas from the State menu and Galveston County from the list that appears. Then click Add to Your Selections. Next, for Hudson County, select New Jersey from the State menu. The list of counties will regenerate, and you should select Hudson County, and again, click Add to Your Selections. Repeat these steps for St. Johns County, selecting Florida from the State menu and St. Johns County from the list, and clicking Add to Your Selections one more time. Now close the Select Geographies pop-up, and confirm that these three counties are listed in the Your Selections column to the left. 18

19 Click Topics in the left-hand column. Expand the Dataset item at the bottom, then click on the 2010 Demographic Profile SF link. Now close the Select Topics popup, and confirm that the 2010 Demographic Profile SF is listed in the Your Selections column to the left. In the main table at the center of your screen, click on the link for Profile of General Population and Housing Characteristics: This will load the 2010 census demographic information for the three counties. This first item in the list, Total population is the one you need to complete this measure. Enter the total population for each county into the table on your answer sheet. To switch counties, use the Geography dropdown menu. NOTE: After you complete this section, leave this browser window open. You will need the data from these tables to complete many of the measures of sensitivity and adaptive capacity. Instructions: Sensitivity Measures All of the required sensitivity measures are available from the Census American FactFinder site you used in the previous step. To begin, clear the 2010 Demographic Profile SF dataset by clicking the blue X next to this item in the Your Selections section of the lefthand column. Click Topics in the left-hand column. Expand the Dataset tab by clicking on the + next to it, and scroll down to 2010 ACS 1-year estimates, which includes data from the American Community Survey conducted in 2010, and close the Select Topics pop-up. Population Age and Minority Populations Measures 19
20 In the list of tables that appears after completing the above step, select DP05 ACS Demographic and Housing Estimates. Note all three counties of interest appear in the output table. Total county population at the 2010 Decennial Census is at the top of the table. There is a line for Population 65 and older in the table. Make sure to select the Percent column. To obtain Under-18 population, you will need to subtract the percentage listed in the 18 years and older row from 100. To obtain Percent Black, scroll down to the Race section and select the percentage for Black or African American under the One Race heading. To obtain Percent Hispanic, scroll down to the Hispanic or Latino and Race section and select the percentage for Hispanic or Latino (of any race). Poverty Measure Click Back to Advanced Search at the top of the table. Uncheck the box next to DP05. Click DP03 Selected Economic Characteristics. Under the heading Percentage of Families and People Whose Income in the Past 12 Months is Below the Poverty Level, select the percentage value for All People. Instructions: Adaptive Capacity Measures As discussed earlier, adaptive capacity shows people s abilities to cope with, to mitigate the loss from natural hazards. As a result, adaptive capacity indicators usually describe people s abilities in the positive perspective. From the list of components above, higher educational attainment, higher median household income, and car availability are more suitable to represent the indicators for adaptive capacity because, generally speaking, people who have higher educational attainment know more about natural hazards, or have more access to the resources that can help them in a hazard event; households which have higher median incomes have the capacity to have better preparedness (buying enough foods and waters or emergency kits) or better mitigation behaviors or activities (like strengthen the structures of the house, buy hazard insurance); households with their own vehicles do not need to reply on public transportations when evacuations. For the three adaptive capacity indicators, we can use the year American Community Survey data from the Census American FactFinder advanced search site you used in the previous step. Below are detailed steps about how to find the data. In the Census American FactFinder advanced search site, add the three counties we are interested in and the 2010 ACS 1-year estimates in the left hand column. 20

21 To find data on educational attainment, click on SELECTED SOCIAL CHARACTERSITICS IN THE UNITED STATES. Then you will be redirect to a new page like below: On this page, find or search for Percent high school graduate or higher under the subject of EDUCATIONAL ATTAINMENT. You know can see a Percent of people in the three counties who have high school degree or higher. 21
22 After you have recorded the percentage, click BACK TO ADVANCED SEARCH in the top-right of the page. To find data on vehicle availability, click on SELECTED HOUSING CHARACTERSITICS Then you will be redirect to a new page. On this page, find or search for No vehicles available under the subject of VEHICLE AVAILABLE. You now can the see an estimated percent of occupied housing units in the three counties which have no vehicles. To calculate how many households have vehicles, simply calculate: 100 the percentage of households which has no vehicles. After you have done the calculation, click BACK TO ADVANCED SEARCH in the top-right of the page. To find data on household income, click on SELECTED ECONOMIC CHARACTERSITICS. Then you will be redirect to a new page. 22
. You now can see an estimate of median household income.")
23 On this page, find or search for Median household income (dollars) under the subject of INCOME AND BENEFITS (IN 2010 INFLATION-ADJUSTED DOLLARS). You now can see an estimate of median household income. 23
Child Opportunity Index Mapping
 Child Opportunity Index Mapping A partnership project of How to Use and Interpret the Child Opportunity Index Maps How to Use the Child Opportunity Index Maps Getting Started: How to Find and Open a Child
Community Opportunity Map
 Community Opportunity Map User Guide and FAQs UPDATED FEBRUARY 2018 Contents User Guide... 2 Overview... 2 Choosing a location... 3 Search for a city or address... 4 Select a county or ZIP code... 4 Explore
Utilizing Data from American FactFinder with TIGER/Line Shapefiles in ArcGIS
 Utilizing Data from American FactFinder with TIGER/Line Shapefiles in ArcGIS Web Adams, GISP Data Dissemination Specialist U.S. Census Bureau New York Regional Office 1 What We Do Decennial Census Every
Guide to the Data-Driven Planning Toolkit in CPD Maps
 The econ Planning Suite: Guide to the Data-Driven Planning Toolkit in CPD Maps Version: April 2014 TABLE OF CONTENTS Introduction... 1 The Data-Driven Planning Toolkit... 3 Overview of the Basic Model...
The Church Demographic Specialists
 The Church Demographic Specialists Easy-to-Use Features Map-driven, Web-based Software An Integrated Suite of Information and Query Tools Providing An Insightful Window into the Communities You Serve Key
Assessing Social Vulnerability to Biophysical Hazards. Dr. Jasmine Waddell
 Assessing Social Vulnerability to Biophysical Hazards Dr. Jasmine Waddell About the Project Built on a need to understand: The pre-disposition of the populations in the SE to adverse impacts from disaster
Exercise on Using Census Data UCSB, July 2006
 Exercise on Using Census Data UCSB, July 2006 Purpose The purpose of this lab is to become familiar with Census Bureau data. Second, we will learn how to join tables which allows you to add data to the
Social Vulnerability explorer (SV-X)
") 311 Social Vulnerability explorer (SV-X) D. P. Lanter 1 ; S. Durden 2 ; C. Baker 3 ; and C. M. Dunning 4 1 CDM Smith, Two Penn Center Plaza, 1500 JFK Blvd, Philadelphia, PA 19102. E-mail: lanterdp@cdmsmith.com
311 Social Vulnerability explorer (SV-X) D. P. Lanter 1 ; S. Durden 2 ; C. Baker 3 ; and C. M. Dunning 4 1 CDM Smith, Two Penn Center Plaza, 1500 JFK Blvd, Philadelphia, PA 19102. E-mail: lanterdp@cdmsmith.com
Using American Factfinder
 Using American Factfinder What is American Factfinder? American Factfinder is a search engine that provides access to the population, housing and economic data collected by the U.S. Census Bureau. It can
AFFH-T User Guide September 2017 AFFH-T User Guide U.S. Department of Housing and Urban Development
 AFFH-T User Guide Affirmatively Furthering Fair Housing Data and Mapping Tool v. 4.1 U.S. Department of Housing and Urban Development September 2017 Version 4.1 ❿ September 2017 Page 1 Document History
User Guide. Affirmatively Furthering Fair Housing Data and Mapping Tool. U.S. Department of Housing and Urban Development
 User Guide Affirmatively Furthering Fair Housing Data and Mapping Tool U.S. Department of Housing and Urban Development December, 2015 1 Table of Contents 1. Getting Started... 5 1.1 Software Version...
Visualizing hurricanes
 Visualizing hurricanes NAME: DATE: Scientific visualization is an integral part of the process of simulating natural phenomena. In the computational sciences, the main goal is to understand the workings
Neighborhood social characteristics and chronic disease outcomes: does the geographic scale of neighborhood matter? Malia Jones
 Neighborhood social characteristics and chronic disease outcomes: does the geographic scale of neighborhood matter? Malia Jones Prepared for consideration for PAA 2013 Short Abstract Empirical research
Module 7, Lesson 1 Water world
 Module 7, Lesson 1 Water world Imagine that the year is 2100. Scientists have determined that the rapidly warming climate of the earth will cause the ice sheets of Antarctica to break apart and melt at
Data Visualization with GIS, Dr. Chris Badurek Visualization and Computing Teacher s Workshop. Part 1: Getting Started with Tectonic Hot Spot Mapping
 Data Visualization with GIS, Dr. Chris Badurek Visualization and Computing Teacher s Workshop Part 1: Getting Started with Tectonic Hot Spot Mapping Lesson Overview This lesson is designed to help students
Module 7, Lesson 2 In the eye of the storm
 Module 7, Lesson 2 In the eye of the storm October 21, 1998 A tropical storm is brewing in the Atlantic Ocean. It began as a tropical wave a few weeks earlier, off the coast of western Africa. Today it
Environmental Analysis, Chapter 4 Consequences, and Mitigation
 Environmental Analysis, Chapter 4 4.17 Environmental Justice This section summarizes the potential impacts described in Chapter 3, Transportation Impacts and Mitigation, and other sections of Chapter 4,
SECOORA Data Portal Exercises
 SECOORA Data Portal Exercises Exercise #1: April 2018- Carolina Storm using Historic Real-time Sensor Exercise #2: Exploration of Data Trends for Estuarine Fish Abundance and Sea Surface Temperature Exercise
HURREVAC REFERENCE IMPORTANT INFORMATION TO KNOW WHEN A STORM IS APPROACHING
 HURREVAC REFERENCE IMPORTANT INFORMATION TO KNOW WHEN A STORM IS APPROACHING PART 1: Workspace Layout Program Header (1 Red) Includes tools that allow the user to manage program setup, update forecast
Using the Budget Features in Quicken 2008
 Using the Budget Features in Quicken 2008 Quicken budgets can be used to summarize expected income and expenses for planning purposes. The budget can later be used in comparisons to actual income and expenses
1. Double-click the ArcMap icon on your computer s desktop. 2. When the ArcMap start-up dialog box appears, click An existing map and click OK.
 Module 2, Lesson 1 The earth moves In this activity, you will observe worldwide patterns of seismic activity (earthquakes) and volcanic activity (volcanoes). You will analyze the relationships of those
hurricane harvey and equitable recovery
 hurricane harvey and equitable recovery Mapping social vulnerability and intensity of wind and flooding from Hurricane Harvey in Texas hurricane harvey s impact on texas In August 2017, Hurricane Harvey
Salem Coastal Vulnerability. By: Ariabel Adames, Abby Jackson, Mariluz Ayala, Mikara Crowley, Karley Skutul
 Salem Coastal Vulnerability By: Ariabel Adames, Abby Jackson, Mariluz Ayala, Mikara Crowley, Karley Skutul Total Population: 42,544 Sea level Rise: 10,700 Worst Case Storm Surge: 22,560 Minority Income
Working with Census 2000 Data from MassGIS
 Tufts University GIS Tutorial Working with Census 2000 Data from MassGIS Revised September 26, 2007 Overview In this tutorial, you will use pre-processed census data from Massachusetts to create maps of
Student Activity Sheet- Denali Topo Map
 Student Activity Sheet- Denali Topo Map Directions: Follow the steps in order and answer the associated questions as you proceed through the activity. The first part of the activity will be guided by your
APPENDIX C-3 Equitable Target Areas (ETA) Technical Analysis Methodology
 Technical Analysis Methodology") APPENDIX C-3 Equitable Target Areas (ETA) Technical Analysis Methodology Contents Introduction... 1 ETA Index Methodology... 1 ETA Index Development... 1 Other EJ Measures... 4 The Limited English Proficiency
APPENDIX C-3 Equitable Target Areas (ETA) Technical Analysis Methodology Contents Introduction... 1 ETA Index Methodology... 1 ETA Index Development... 1 Other EJ Measures... 4 The Limited English Proficiency
Coastal Emergency Risks Assessment - CERA Real-Time Storm Surge and Wave Visualization Tool
 Coastal Emergency Risks Assessment - CERA Real-Time Storm Surge and Wave Visualization Tool Introduction This document provides guidance for using the Coastal Emergency Risks Assessment (CERA) visualization
Social Vulnerability Index. Susan L. Cutter Department of Geography, University of South Carolina
 Social Vulnerability Index Susan L. Cutter Department of Geography, University of South Carolina scutter@sc.edu Great Lakes and St. Lawrence Cities Initiative Webinar December 3, 2014 Vulnerability The
2014 Planning Database (PDB)
") 2014 Planning Database (PDB) November 19, 2014 Barbara O Hare, Nancy Bates, Julia Coombs, Travis Pape, Chandra Erdman Office of Survey Analytics 1 Overview Tract and Block Group PDBs Useful for: Identifying
2014 Planning Database (PDB) November 19, 2014 Barbara O Hare, Nancy Bates, Julia Coombs, Travis Pape, Chandra Erdman Office of Survey Analytics 1 Overview Tract and Block Group PDBs Useful for: Identifying
How to Make or Plot a Graph or Chart in Excel
 This is a complete video tutorial on How to Make or Plot a Graph or Chart in Excel. To make complex chart like Gantt Chart, you have know the basic principles of making a chart. Though I have used Excel
OneStop Map Viewer Navigation
 OneStop Map Viewer Navigation» Intended User: Industry Map Viewer users Overview The OneStop Map Viewer is an interactive map tool that helps you find and view information associated with energy development,
DATA DISAGGREGATION BY GEOGRAPHIC
 PROGRAM CYCLE ADS 201 Additional Help DATA DISAGGREGATION BY GEOGRAPHIC LOCATION Introduction This document provides supplemental guidance to ADS 201.3.5.7.G Indicator Disaggregation, and discusses concepts
Quality Measures (QM) Report. Self Guided Tutorial
 Report. Self Guided Tutorial") Quality Measures (QM) Report Self Guided Tutorial 1 Tutorial Contents Overview of the QM Online Report Facility Summary Report Resident Drill down Monthly Trend Report Resident Roster Report Printing Reports/Export
Quality Measures (QM) Report Self Guided Tutorial 1 Tutorial Contents Overview of the QM Online Report Facility Summary Report Resident Drill down Monthly Trend Report Resident Roster Report Printing Reports/Export
Business Preparedness and Hurricane Risk
 Business Preparedness and Hurricane Risk Hurricanes are one of the more predictable natural disasters compared to events such as earthquakes, wildfires and tornadoes. Meteorologists gather data to predict
READY WRIGLEY PREPARES FOR HURRICANES
 READY WRIGLEY PREPARES FOR HURRICANES NAME: Note to Parents, Guardians, and Teachers The Centers for Disease Control and Prevention has created Ready Wrigley to provide parents, guardians, teachers, and
Gravity: How fast do objects fall? Student Advanced Version
 Gravity: How fast do objects fall? Student Advanced Version Kinematics is the study of how things move their position, velocity, and acceleration. Acceleration is always due to some force acting on an
Social and Economic Impacts of Brownfield Redevelopment in Florida New Analytical Tools to Assess the State and Tribal Response Program
 Social and Economic Impacts of Brownfield Redevelopment in Florida New Analytical Tools to Assess the State and Tribal Response Program Christian Wells Our mission is to leverage interdisciplinary scientific
REPLACE DAMAGED OR MISSING TEXTBOOK BARCODE LABEL
 Destiny Textbook Manager allows users to create and print replacement barcode labels for textbooks. In this tutorial you will learn how to: Replace damaged textbook barcode label(s) Replace missing textbook
KCC White Paper: The 100 Year Hurricane. Could it happen this year? Are insurers prepared? KAREN CLARK & COMPANY. June 2014
 KAREN CLARK & COMPANY KCC White Paper: The 100 Year Hurricane Could it happen this year? Are insurers prepared? June 2014 Copyright 2014 Karen Clark & Company The 100 Year Hurricane Page 1 2 COPLEY PLACE
(THIS IS AN OPTIONAL BUT WORTHWHILE EXERCISE)
") PART 2: Analysis in ArcGIS (THIS IS AN OPTIONAL BUT WORTHWHILE EXERCISE) Step 1: Start ArcCatalog and open a geodatabase If you have a shortcut icon for ArcCatalog on your desktop, double-click it to start
PART 2: Analysis in ArcGIS (THIS IS AN OPTIONAL BUT WORTHWHILE EXERCISE) Step 1: Start ArcCatalog and open a geodatabase If you have a shortcut icon for ArcCatalog on your desktop, double-click it to start
OnTheMap for Emergency Management
 OnTheMap for Emergency Management Robert Pitts Geographer/Project Manager Longitudinal Employer Household Dynamics (LEHD) Center for Economic Studies U.S. Census Bureau Jody Hoon-Star Geographer/Application
Module 7, Lesson 1 Water world
 Module 7, Lesson 1 Water world Imagine that the year is 2100. Scientists have determined that the rapidly warming climate of the earth will cause the ice sheets of Antarctica to break apart and melt at
Introduction to the College of DuPage NEXLAB Website
 Introduction to the College of DuPage NEXLAB Website The purpose of this lab is to familiarize yourself with our website so that you will have an easier time following along in class and will be able to
Guide to Hydrologic Information on the Web
 NOAA s National Weather Service Guide to Hydrologic Information on the Web Colorado River at Lees Ferry Photo: courtesy Tim Helble Your gateway to web resources provided through NOAA s Advanced Hydrologic
Gravity: How fast do objects fall? Teacher Advanced Version (Grade Level: 8 12)
") Gravity: How fast do objects fall? Teacher Advanced Version (Grade Level: 8 12) *** Experiment with Audacity and Excel to be sure you know how to do what s needed for the lab*** Kinematics is the study
Gravity: How fast do objects fall? Teacher Advanced Version (Grade Level: 8 12) *** Experiment with Audacity and Excel to be sure you know how to do what s needed for the lab*** Kinematics is the study
Name Date Class. Figure 1. The Google Earth Pro drop-down menu.
 GIS Student Walk-Through Worksheet Procedure 1. Import historical tornado and hurricane data into Google Earth Pro by following these steps: A. In the Google Earth Pro drop-down menu > click File > Import
Mapping Social Vulnerability and Lyme Disease in Vermont
 Mapping Social Vulnerability and Lyme Disease in Vermont March 30, 2017, Dr. Joseph Holler Contact email: joseph@josephholler.com Website: www.josephholler.com This work is licensed under a Creative Commons
Spatial Organization of Data and Data Extraction from Maptitude
 Spatial Organization of Data and Data Extraction from Maptitude N. P. Taliceo Geospatial Information Sciences The University of Texas at Dallas UT Dallas GIS Workshop Richardson, TX March 30 31, 2018 1/
KENTUCKY HAZARD MITIGATION PLAN RISK ASSESSMENT
 KENTUCKY HAZARD MITIGATION PLAN RISK ASSESSMENT Presentation Outline Development of the 2013 State Hazard Mitigation Plan Risk Assessment Determining risk assessment scale Census Data Aggregation Levels
An Assessment of People, Place and Business on Syracuse s Near Northside
 An Assessment of People, Place and Business on Syracuse s Near Northside May 2013 Report produced by Jon Glass, Kelly Montague and Mark Pawliw Edited by Jon Glass and Jonnell Robinson Syracuse Community
Step 2: Discover the relationship between heat flow and plate boundaries.
 How does thermal energy move around in the Earth? Movement of the Earth s tectonic plates is driven by heat flow in the Earth s interior. Plumes of mantle rock rise slowly from the bottom of the mantle
Lesson Plan 2 - Middle and High School Land Use and Land Cover Introduction. Understanding Land Use and Land Cover using Google Earth
 Understanding Land Use and Land Cover using Google Earth Image an image is a representation of reality. It can be a sketch, a painting, a photograph, or some other graphic representation such as satellite
Introduction to Google Earth
 Introduction to Google Earth Name Goals 1. To become proficient at using the basic features of Google Earth. 2. To recognize differences in coastal features between the east and west coast of North America.
Studying Topography, Orographic Rainfall, and Ecosystems (STORE)
") Introduction Studying Topography, Orographic Rainfall, and Ecosystems (STORE) Lesson: Using ArcGIS Explorer to Analyze the Connection between Topography, Tectonics, and Rainfall GIS-intensive Lesson This
Introduction Studying Topography, Orographic Rainfall, and Ecosystems (STORE) Lesson: Using ArcGIS Explorer to Analyze the Connection between Topography, Tectonics, and Rainfall GIS-intensive Lesson This
MEASUREMENT OF THE CHARGE TO MASS RATIO (e/m e ) OF AN ELECTRON
 OF AN ELECTRON") MEASUREMENT OF THE CHARGE TO MASS RATIO (e/m e ) OF AN ELECTRON Object This experiment will allow you to observe and understand the motion of a charged particle in a magnetic field and to measure the ratio
MEASUREMENT OF THE CHARGE TO MASS RATIO (e/m e ) OF AN ELECTRON Object This experiment will allow you to observe and understand the motion of a charged particle in a magnetic field and to measure the ratio
GIS-Based Analysis of the Commuting Behavior and the Relationship between Commuting and Urban Form
 GIS-Based Analysis of the Commuting Behavior and the Relationship between Commuting and Urban Form 1. Abstract A prevailing view in the commuting is that commuting would reconstruct the urban form. By
Electric Fields and Equipotentials
 OBJECTIVE Electric Fields and Equipotentials To study and describe the two-dimensional electric field. To map the location of the equipotential surfaces around charged electrodes. To study the relationship
LAB 5 INSTRUCTIONS LINEAR REGRESSION AND CORRELATION
 LAB 5 INSTRUCTIONS LINEAR REGRESSION AND CORRELATION In this lab you will learn how to use Excel to display the relationship between two quantitative variables, measure the strength and direction of the
II. Performance Task Using the data set, you will be looking at images from four different years and studying the terminus of the glacier.
 Page 1 of 9 I. The Relevant Issue The United States Geological Survey (USGS) has identified the Bering Glacier, located in southeast Alaska, for long term ecological monitoring as an indicator of climate
Tutorial using the 2011 Statistics Canada boundary files and the Householder survey
 Tutorial using the 2011 Statistics Canada boundary files and the Householder survey In this tutorial, we ll try to determine the wards that contain the highest income groups. To do this, we will have to
Lab 7: Cell, Neighborhood, and Zonal Statistics
 Lab 7: Cell, Neighborhood, and Zonal Statistics Exercise 1: Use the Cell Statistics function to detect change In this exercise, you will use the Spatial Analyst Cell Statistics function to compare the
Outline of Guideline for Development and Utilization of Tsunami Disaster Management Map
 Outline of Guideline for Development and Utilization of Tsunami Disaster Management Map Port and Airport Research Institute, Japan The Overseas Coastal Area Development Institute of Japan Ports and Harbours
Physics Lab #5: Starry Night Observations of the Sun and Moon
 Physics 10293 Lab #5: Starry Night Observations of the Sun and Moon Introduction Today, we are going to use the Starry Night software to learn about motion of the stars, sun and moon on the celestial sphere.
What Are Disasters? The Rescue Kids Trio!
 The Rescue Kids Trio! What Are Disasters? This manual was made possible through funding by the Council of Local Authorities for International Relations. Disasters and emergency preparedness Emergency preparedness
Experiment: Oscillations of a Mass on a Spring
 Physics NYC F17 Objective: Theory: Experiment: Oscillations of a Mass on a Spring A: to verify Hooke s law for a spring and measure its elasticity constant. B: to check the relationship between the period
Intro to the Major Landforms of Texas and the Four Regions of Texas
 Intro to the Major Landforms of Texas and the Four Regions of Texas High Plains CAPROCK ESCARPMENT Permian Basin Edwards Plateau Coastal Plains BALCONES ESCARPMENT As we discussed in our Walk Across Texas,
Agricultural Outlook Forum Presented: February 17, 2006 THE SCIENCE BEHIND THE ATLANTIC HURRICANES AND SEASONAL PREDICTIONS
 Agricultural Outlook Forum Presented: February 17, 2006 THE SCIENCE BEHIND THE ATLANTIC HURRICANES AND SEASONAL PREDICTIONS Gerald Bell Meteorologist, National Centers for Environmental Prediction NOAA,
Experiment 0 ~ Introduction to Statistics and Excel Tutorial. Introduction to Statistics, Error and Measurement
 Experiment 0 ~ Introduction to Statistics and Excel Tutorial Many of you already went through the introduction to laboratory practice and excel tutorial in Physics 1011. For that reason, we aren t going
HURRICANE PREPAREDNESS GUIDE
 HURRICANE PREPAREDNESS GUIDE BE PREPARED! TABLE OF CONTENTS Basic Preparedness Tips... 3 Preparing Your Home... 4 What To Do... 5 Make a Hurricane Plan... 6 Important Information... 7 pacu.com 800.433.7228
GIS Workshop UCLS_Fall Forum 2014 Sowmya Selvarajan, PhD TABLE OF CONTENTS
 TABLE OF CONTENTS TITLE PAGE NO. 1. ArcGIS Basics I 2 a. Open and Save a Map Document 2 b. Work with Map Layers 2 c. Navigate in a Map Document 4 d. Measure Distances 4 2. ArcGIS Basics II 5 a. Work with
Massachusetts Hurricane Evacuation Study
 Massachusetts Hurricane Evacuation Study Technical Data Report May 2016 New England District Massachusetts Hurricane Evacuation Study Technical Data Report May 2016 Table of Contents 1.0 Study Area...
MINI LESSON. Lesson 2a Linear Functions and Applications
 MINI LESSON Lesson 2a Linear Functions and Applications Lesson Objectives: 1. Compute AVERAGE RATE OF CHANGE 2. Explain the meaning of AVERAGE RATE OF CHANGE as it relates to a given situation 3. Interpret
McIDAS-V Tutorial Displaying Point Observations from ADDE Datasets updated July 2016 (software version 1.6)
") McIDAS-V Tutorial Displaying Point Observations from ADDE Datasets updated July 2016 (software version 1.6) McIDAS-V is a free, open source, visualization and data analysis software package that is the
McIDAS-V Tutorial Displaying Point Observations from ADDE Datasets updated July 2016 (software version 1.6) McIDAS-V is a free, open source, visualization and data analysis software package that is the
EOS 102: Dynamic Oceans Exercise 1: Navigating Planet Earth
 EOS 102: Dynamic Oceans Exercise 1: Navigating Planet Earth YOU MUST READ THROUGH THIS CAREFULLY! This exercise is designed to familiarize yourself with Google Earth and some of its basic functions while
Keywords: Air Quality, Environmental Justice, Vehicle Emissions, Public Health, Monitoring Network
 NOTICE: this is the author s version of a work that was accepted for publication in Transportation Research Part D: Transport and Environment. Changes resulting from the publishing process, such as peer
Table-Top Exercise for Emergency Preparedness Evaluation: Little Anse, Isle Madame
 Table-Top Exercise for Emergency Preparedness Evaluation: Little Anse, Isle Madame Alexander Chung, M.Sc. Candidate C-Change Student Research Associate May 2013 The Community of Little Anse Coastal community
Using Functions in Models and Decision Making: Step and Piecewise Functions V.C Student Activity Sheet 8: Introducing Step and Piecewise Functions
 Using in Models and Decision Making: Step and Piecewise Texas experiences a wide variety of weather, including hurricanes. Coastal residents often feel the direct effects of hurricanes when they make landfall
MEASUREMENT OF THE CHARGE TO MASS RATIO (e/m e ) OF AN ELECTRON
 OF AN ELECTRON") MEASUREMENT OF THE CHARGE TO MASS RATIO (e/m e ) OF AN ELECTRON Object This experiment will allow you to observe and understand the motion of a charged particle in a magnetic field and to measure the ratio
MEASUREMENT OF THE CHARGE TO MASS RATIO (e/m e ) OF AN ELECTRON Object This experiment will allow you to observe and understand the motion of a charged particle in a magnetic field and to measure the ratio
Hurricanes A 5 Day Unit Plan. Kristy Scott EDUC 651 October 30, nd grade
 Hurricanes A 5 Day Unit Plan Kristy Scott EDUC 651 October 30, 2006 2 nd grade Unit Overview Unit Description: The focus of this unit is to combine the students experiences of Hurricane Katrina with the
Assignment #0 Using Stellarium
 Name: Class: Date: Assignment #0 Using Stellarium The purpose of this exercise is to familiarize yourself with the Stellarium program and its many capabilities and features. Stellarium is a visually beautiful
Effects of Global Warming on Coastal Cities: A Katrina Case Study
 Effects of Global Warming on Coastal Cities: A Katrina Case Study Introduction This lesson was created to discuss the possible effects of temperatures increasing worldwide, with a focus on the events that
D.T.M: TRANSFER TEXTBOOKS FROM ONE SCHOOL TO ANOTHER
 Destiny Textbook Manager allows users with full access to transfer Textbooks from one school site to another and receive transfers from the warehouse In this tutorial you will learn how to: Requirements:
Population Trends Along the Coastal United States:
 Coastal Trends Report Series Population Trends Along the Coastal United States: 1980-2008 U.S. Department of Commerce National Oceanic and Atmospheric Administration National Ocean Service Assessing the
GIS = Geographic Information Systems;
 What is GIS GIS = Geographic Information Systems; What Information are we talking about? Information about anything that has a place (e.g. locations of features, address of people) on Earth s surface,
Exercise 4 Estimating the effects of sea level rise on coastlines by reclassification
 Exercise 4 Estimating the effects of sea level rise on coastlines by reclassification Due: Thursday February 1; at the start of class Goal: Get familiar with symbolizing and making time-series maps of
Local Weather History
 Local Weather History 52 40- to 2+ 50-minute sessions ACTIVITY OVERVIEW P RO J E C T Students design and conduct a survey to learn about the history of weather disasters in the local area, and then compare
Computer simulation of radioactive decay
 Computer simulation of radioactive decay y now you should have worked your way through the introduction to Maple, as well as the introduction to data analysis using Excel Now we will explore radioactive
Data Matrix User Guide
 Data Matrix User Guide 1. Introduction The 2017 Data Matrix is designed to support the 2017 iteration of the Regional Skills Assessments (RSAs) in Scotland. The RSAs align with the Regional Outcome Agreement
This module focuses on the logic of ANOVA with special attention given to variance components and the relationship between ANOVA and regression.
 WISE ANOVA and Regression Lab Introduction to the WISE Correlation/Regression and ANOVA Applet This module focuses on the logic of ANOVA with special attention given to variance components and the relationship
Can Public Transport Infrastructure Relieve Spatial Mismatch?
 Can Public Transport Infrastructure Relieve Spatial Mismatch? Evidence from Recent Light Rail Extensions Kilian Heilmann University of California San Diego April 20, 2015 Motivation Paradox: Even though
Visual Studies Exercise, Assignment 07 (Architectural Paleontology) Geographic Information Systems (GIS), Part II
 Geographic Information Systems (GIS), Part II") ARCH1291 Visual Studies II Week 8, Spring 2013 Assignment 7 GIS I Prof. Alihan Polat Visual Studies Exercise, Assignment 07 (Architectural Paleontology) Geographic Information Systems (GIS), Part II Medium:
ARCH1291 Visual Studies II Week 8, Spring 2013 Assignment 7 GIS I Prof. Alihan Polat Visual Studies Exercise, Assignment 07 (Architectural Paleontology) Geographic Information Systems (GIS), Part II Medium:
Community Inclusion in Colorado
 A Mapping Project for Emergency Preparedness and Response Aimee Voth Siebert, MA Julia Beems, MA Rachel Coles, MA Devon Williford, MPH Adam Anderson, MURP, MPH March 2015 understanding that HUMAN ENERGY
Comparative Analysis of Hurricane Vulnerability in New Orleans and Baton Rouge. Dr. Marc Levitan LSU Hurricane Center. April 2003
 Comparative Analysis of Hurricane Vulnerability in New Orleans and Baton Rouge Dr. Marc Levitan LSU Hurricane Center April 2003 In order to compare hurricane vulnerability of facilities located in different
Recommended Grade Level: 8 Earth/Environmental Science Weather vs. Climate
 Lab Activity Title: Climate Factors Past and Present Recommended Grade Level: 8 Discipline: Earth/Environmental Science Topic: Weather vs. Climate Time Requirements: 90 minutes Submitted by: Karen McCabe
Red Hook Recovery Project. Hurricane Sandy An Urban Disaster
 Red Hook Recovery Project Hurricane Sandy An Urban Disaster Overview Impact of Changing weather Urban Preparedness Overview of preparedness efforts Complexities of urban planning (Ex. NYC) Understanding
Classification Exercise UCSB July 2006
 Classification Exercise UCSB July 2006 Purpose This exercise will examine how spatial data is catergorized and the advantages and disadvantages of different classification methods. Terms to know Population,
Institute of Space and Earth Information Science & The Center for University and School Partnership, Faculty of Education, CUHK (Sponsored by QEF)
") 1 Landslides and Slope Stability in Hong Kong Introduction: There are many landslides in Hong Kong throughout the years. Some of these are disastrous, such as those occurring on Po Shan Road and in the
1 Landslides and Slope Stability in Hong Kong Introduction: There are many landslides in Hong Kong throughout the years. Some of these are disastrous, such as those occurring on Po Shan Road and in the
Mapping Data 1: Constructing a Choropleth Map
 Mapping Data 1: Constructing a Choropleth Map OVERVIEW & OBJECTIVES Students will become acquainted with mapping data and understanding the importance of recognizing patterns by constructing a choropleth
Chemwatch How To. Create Labels for Chemicals, Products & Mixtures.
 Chemwatch How To. Create Labels for Chemicals, Products & Mixtures. Dr Ian Lane Radiation and Chemical Manager Faculty of Science Version 1.0, April 2017 Outline: (i) Important Note! Part A: Creating a
Introducing IMS. v) Select the Zoom to Full Extent tool. Did you return to the original view?
 Select the Zoom to Full Extent tool. Did you return to the original view?") Ocean/ENVIR 260, Winter 2006 Lab 1, Get to Know the Puget Sound Watershed Name Introducing IMS 1) Open your web browser and navigate to http://128.208.23.127/website/lab1. (This link can be found on the
Ocean/ENVIR 260, Winter 2006 Lab 1, Get to Know the Puget Sound Watershed Name Introducing IMS 1) Open your web browser and navigate to http://128.208.23.127/website/lab1. (This link can be found on the