Demographic Data. How to get it and how to use it (with caution) By Amber Keller
|
|
|
- Judith Dean
- 6 years ago
- Views:
Transcription
1 Demographic Data How to get it and how to use it (with caution) By Amber Keller
2 101 Where does it come from? o The American Community Survey o Socio-economic characteristics of a population o Administered by the U.S. Census Bureau funded by Housing and Urban Development (HUD) o 5 year estimates for Zip Codes, Census Tracts, and Block Groups o Decennial Census o Population Count o Last data with socio-economic data 2000 o 2010 and 2020 does/will not have social & economic data o Population and Race
3 American Fact Finder = Data o Download the data o Or don t and call the API o Join by a geography identifier to the geographic areas o Document table and year o Block Group smallest level of geography Census collects data on o Highest margin of error o Highest precision lowest accuracy factfinder.census.gov

4 Document Data Source! Geography Data Set Data Table Data Source Tracts ACS14 5yr: S0101
5 Policy : update [x] every 10 years based on Census Data o Possibly a policy created when socio-economic data was collected every ten (10) years with the decennial census? o Update [geographic.areas] with [ x% of Poverty] with the Decennial Census numbers o This is not possible o Can make calculations on areas each year a dataset comes out o Calculations each year to identify key areas NOT to compare overlapping data sets
6 CAUTION! Different Methodologies Population vs Sample Decennial Census vs ACS
7 CAUTION! Boundaries Change Cities (City geography is called Place by the Census) The city grew in Population from {yyyy} to {yyyy}; == People are moving to City of {cityname}; FALSE Did it really? Or did the city annex residential areas? City Boundaries change every year (Census Boundary and Annexation Survey) Define city - Numbers by City boundary or a Metro area?
8 CAUTION! Boundaries Change or don t exist Zip Codes o Most familiar easiest to comprehend by the public o But Not a Census Geography o Representations of USPS service areas o The USPS service areas change multiple times throughout the year o Census makes a ZIP boundary shapefile every year o 1 st ACS data set with Zip Codes is the release
9 CAUTION! Boundaries Change Tracts and Block Groups Census 2000 ACS to 2014 First NONoverlapping 5 year ACS dataset with ACS First NONoverlapping 5 year ACS dataset of the SAME GEOGRAPHY with ACS Census 2010 ACS ACS ACS ACS ACS ACS ACS ACS ACS ACS Census 2020 ACS ACS ACS ACS ACS ACS ACS ACS ACS ACS
10 CAUTION! Survey Questions Change CAUTION! People don t respond to the survey CAUTION! Statistical sampling margin of error CAUTION! CAUTION! CAUTION! CAUTION! Understand there are limitations to the data The data is what it is make calculations and move on
![What the Client needs to know to make decisions Example Is [Address] in a qualified [BlockGroup] based on [ACS.DataConstraint]? Variable [ACS.DataConstraint] = { IF Housing Facility Deficiency is >=.](/docs-images/72/66460916/images/11-0.jpg "08 #because 8% is one standard deviation above the mean Housing Facility Deficiency = Lacking Full Plumbing ACS14 Table B25051 >=.08 OR Lacking Full Kitchen Table ACS14 Table B25051 >=.")
11 What the Client needs to know to make decisions Example Is [Address] in a qualified [BlockGroup] based on [ACS.DataConstraint]? Variable [ACS.DataConstraint] = { IF Housing Facility Deficiency is >=.08 #because 8% is one standard deviation above the mean Housing Facility Deficiency = Lacking Full Plumbing ACS14 Table B25051 >=.08 OR Lacking Full Kitchen Table ACS14 Table B25051 >=.08}; Return : YES YES Exactly what Block Group Extra data Why YES For reliability and trust in result YES or not the main piece of information
12 GEOI D STATE COUNTY TRACT BLOCK GROUP
13 Thanks for listening! Contact:
14 Combined Demographic Data o Previous example combined two ACS data tables o Can combine data tables, assign weighted values etc etc
15 Pre-Combined Socio-economic Data o Social Vulnerability Index o Aid in planning for populations to respond to hazardous events o Agency for Toxic Substances & Disease registry o Geography: Nationally by County and Tract o Uses: 14 Factors o Data Year: 2014 o ACS yr data and other source population data o Download Shapefile or CSV file
16 Pre-Combined Socio-economic Data o Socioeconomic Demographic Clusters o Ranks socioeconomic status from higher to lower o GA Department of Public Health o Geography: Georgia by Block Group o Uses: 25 Factors o Data Year: 2011 ( ACS) For GEORGIA o View online map or printable poster o Request or Purchase data:
17 Pre-Combined Socio-economic Data o Esri Tapestry Segmentation o Help understand customers lifestyle choices identify best customers and underserved markets o Environmental Systems Research Institute :P o Geography: Nationally by all geographic levels o Uses: 67 Factors ACS and many more data sources o Data Year: 2016 o Yes 2016 read more if you like but to view the map you need an ArcGIS Online account o Accessible online map by Zip Code o Zip Code Boundaries and methodology created by HERE not the same boundaries at the Census Zip Codes!
18
19 Open Tapestry from ArcGIS Online in ArcGIS for Desktop Womp womp o Not very useful o Can only click and view the data o Cannot use in Geoprocessing tools o Cannot Export o Cannot view Attribute Table o Cannot even select!

")
20 So much data! (see every component of this vast dataset with the Identify Tool) Predictive Demographics
21 Use Esri Maps for Office Need an ArcGIS Online account to use Esri Maps for Office ArcGIS Online comes with ArcGIS for Desktop license
22 Esri Maps for Office o If concerned about consuming credits Enrich data with caution o Scenario I want to know Tapestry data for a bunch of addresses o Enrich the addresses? o But what geography level is going into these addresses? o Response from chat with esri tech support When using point data, the output values are interpolated in some way based on the entire zip code o This lead me to learning all about Zip codes conclusion not a good idea to use Zip Codes o A conversation for another time o Instead get a dataset I can work with longer term for addresses again and again o Enrich by Tract or Block Group ID (or Zip Code too if you need to)
23 Esri Maps for Office o Recommendation Don t enrich your point data o Get base layer dataset then geocode and spatial join to the data o Have control and knowledge of the geography DEMO! YouTube: Tapestry Data for all the Tracts in Georgia Cost (two columns) 40 Credits Data Enrichment costs 10 credits per 1,000 records Which is only $4 ($100 = 1,000 credits)
24 Send me that excel sheet or shapefile! Absolutely NOT Cannot send other organization s data if that organization charges for data
25 Case Study o What insights can I gain about a client s customers with just the address? o Client Homeowner Program for people that make less than $65k/year o Customer Homebuyer o Data- Addresses for 5 years
26 Workflow Get Tapestry Data by enriching polygon GEOID in Esri Maps for Office Join to Shapefile Geocode Addresses Spatial Join Frequency (Count) or don t and use Pivot Table in Excel
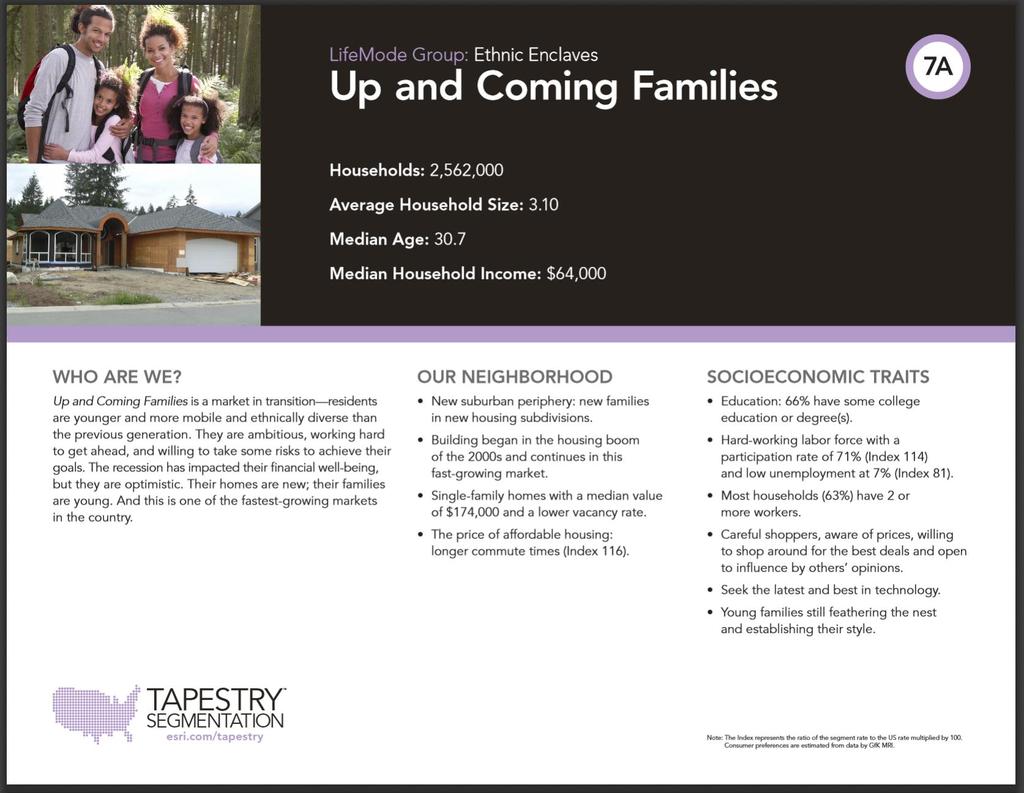
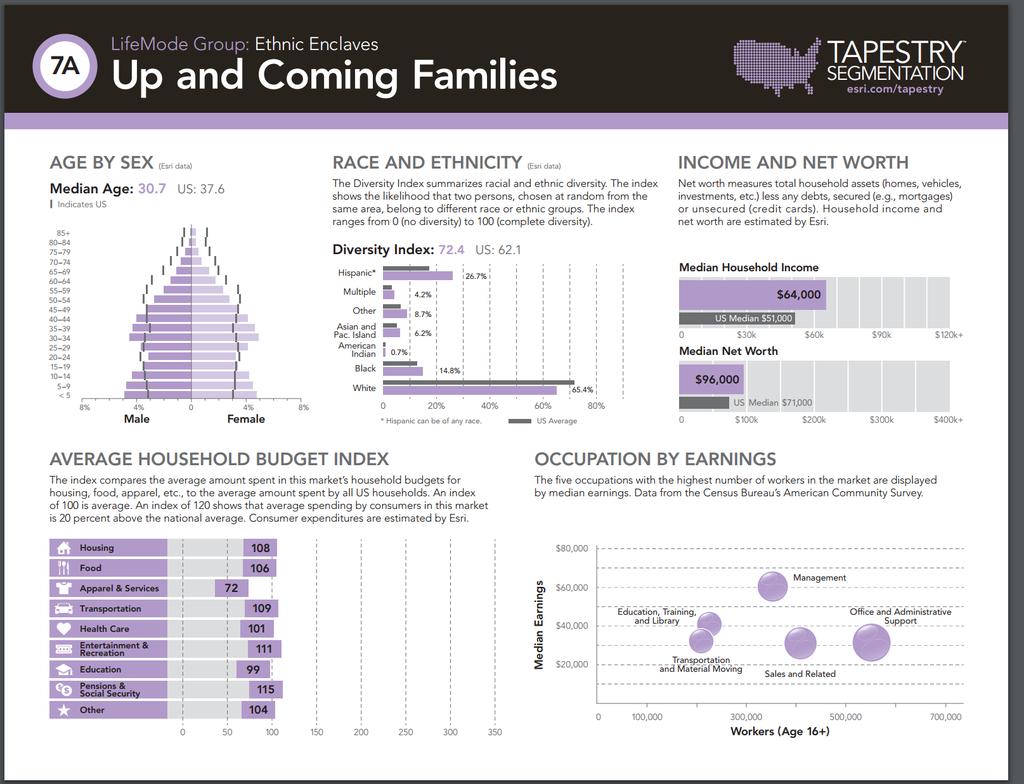
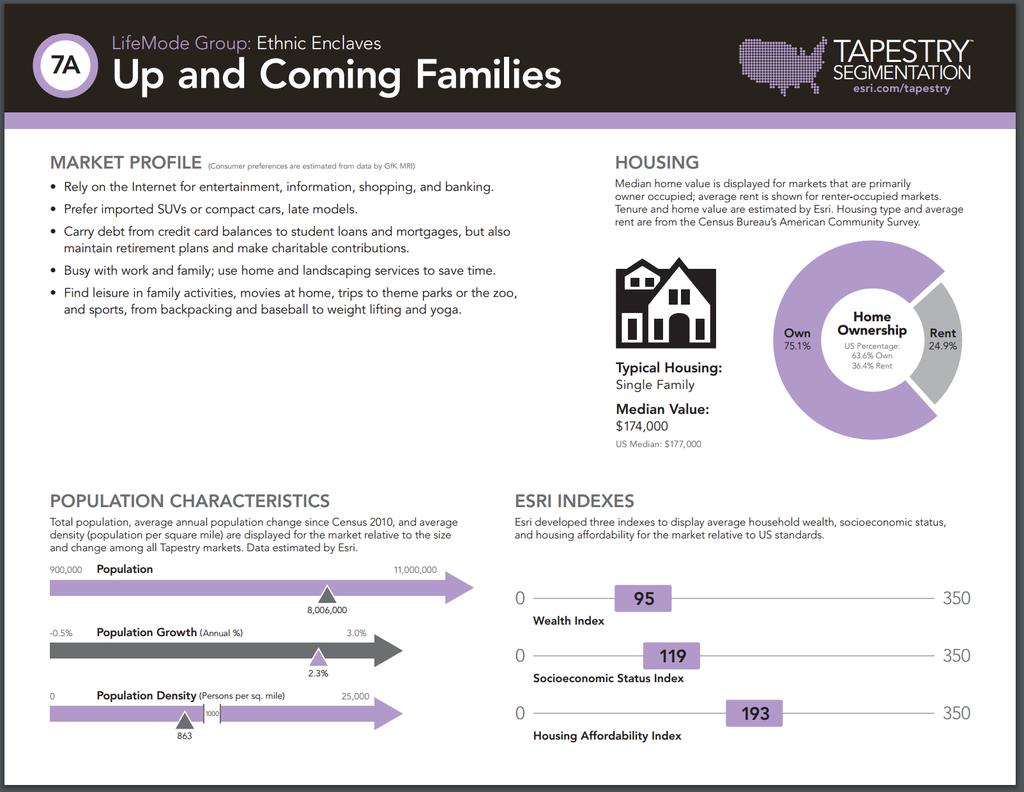
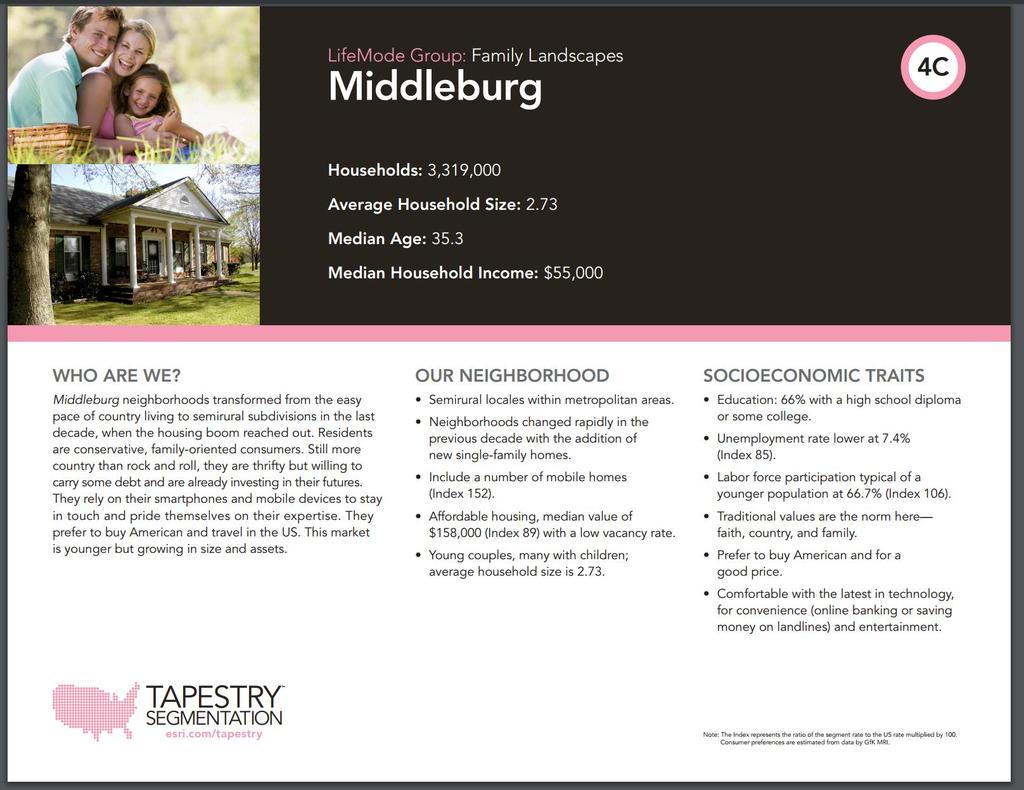
27 Result HOMEOWNERSHIP GA DREAM GEORGIA USA PROGRAM Life mode 10 Common market in Georgia, but not so much with the customer 2.24% 2.81% Out to the TOP FIVE Segments they fall in only two Life Mode Categories 4 and % 8.17% 2.83% 3.16% 5.65% 16.34% 14.56% 1.47% 2.62% 1.72% 2.61% 9.79% 1.38% 8.56% 6.03% 5.55% 4.12% 5.54% 7A 4C 4A 7C 4B 10A 10E U P A N D C O M I N G F A M I L I E S M I D D L E B U R G S O C C E R M O M S A M E R I C A N D R E A M E R S H O M E I M P R O V E M E N T S O U T H E R N S A T E L L I T E S R U R A L B Y P A S S E S 0.50%
28 LifeMode 4 Family Landscapes LifeMode 7 Ethnic Enclaves o Successful young families in their first homes o Non-diverse, prosperous married-couple families, residing in suburban or semirural areas with a low vacancy rate (second lowest) o Homeowners (80%) with mortgages (second highest %), living in newer single-family homes, with median home value slightly higher than the U.S. o Two workers in the family, contributing to the second highest labor force participation rate, as well as low unemployment o Do-it-yourselfers, who work on home improvement projects, as well as their lawns and gardens o Sports enthusiasts, typically owning newer sedans or SUVs, dogs, and savings accounts/plans, comfortable with the latest technology o Eat out frequently at fast food or family restaurants to accommodate their busy lifestyle o Especially enjoy bowling, swimming, playing golf, playing video games, watching movies rented via Redbox, and taking trips to a zoo or theme park o o o o o o o Established diversity young, Hispanic homeowners with families Multilingual and multigenerational households feature children that represent second-, third- or fourthgeneration Hispanic families Neighborhoods feature single-family, owner-occupied homes built at city's edge, primarily built after 1980 Hard-working and optimistic, most residents aged 25 years or older have a high school diploma or some college education Shopping and leisure also focus on their children baby and children's products from shoes to toys and games and trips to theme parks, water parks or the zoo Residents favor Hispanic programs on radio or television; children enjoy playing video games on personal computers, handheld or console devices Many households have dogs for domestic pets
29
30
31
32
Demographic Data in ArcGIS. Harry J. Moore IV
 Demographic Data in ArcGIS Harry J. Moore IV Outline What is demographic data? Esri Demographic data - Real world examples with GIS - Redistricting - Emergency Preparedness - Economic Development Next
The Church Demographic Specialists
 The Church Demographic Specialists Easy-to-Use Features Map-driven, Web-based Software An Integrated Suite of Information and Query Tools Providing An Insightful Window into the Communities You Serve Key
CRP 608 Winter 10 Class presentation February 04, Senior Research Associate Kirwan Institute for the Study of Race and Ethnicity
 CRP 608 Winter 10 Class presentation February 04, 2010 SAMIR GAMBHIR SAMIR GAMBHIR Senior Research Associate Kirwan Institute for the Study of Race and Ethnicity Background Kirwan Institute Our work Using
Neighborhood social characteristics and chronic disease outcomes: does the geographic scale of neighborhood matter? Malia Jones
 Neighborhood social characteristics and chronic disease outcomes: does the geographic scale of neighborhood matter? Malia Jones Prepared for consideration for PAA 2013 Short Abstract Empirical research
Utilizing Data from American FactFinder with TIGER/Line Shapefiles in ArcGIS
 Utilizing Data from American FactFinder with TIGER/Line Shapefiles in ArcGIS Web Adams, GISP Data Dissemination Specialist U.S. Census Bureau New York Regional Office 1 What We Do Decennial Census Every
The econ Planning Suite: CPD Maps and the Con Plan in IDIS for Consortia Grantees Session 1
 The econ Planning Suite: CPD Maps and the Con Plan in IDIS for Consortia Grantees Session 1 1 Training Objectives Use CPD Maps to analyze, assess, and compare levels of need in your community Use IDIS
Using American Factfinder
 Using American Factfinder What is American Factfinder? American Factfinder is a search engine that provides access to the population, housing and economic data collected by the U.S. Census Bureau. It can
Working with Census 2000 Data from MassGIS
 Tufts University GIS Tutorial Working with Census 2000 Data from MassGIS Revised September 26, 2007 Overview In this tutorial, you will use pre-processed census data from Massachusetts to create maps of
Environmental Analysis, Chapter 4 Consequences, and Mitigation
 Environmental Analysis, Chapter 4 4.17 Environmental Justice This section summarizes the potential impacts described in Chapter 3, Transportation Impacts and Mitigation, and other sections of Chapter 4,
An Assessment of People, Place and Business on Syracuse s Near Northside
 An Assessment of People, Place and Business on Syracuse s Near Northside May 2013 Report produced by Jon Glass, Kelly Montague and Mark Pawliw Edited by Jon Glass and Jonnell Robinson Syracuse Community
PALS: Neighborhood Identification, City of Frederick, Maryland. David Boston Razia Choudhry Chris Davis Under the supervision of Chao Liu
 PALS: Neighborhood Identification, City of Frederick, Maryland David Boston Razia Choudhry Chris Davis Under the supervision of Chao Liu University of Maryland School of Architecture, Planning & Preservation
Speakers: Jeff Price, Federal Transit Administration Linda Young, Center for Neighborhood Technology Sofia Becker, Center for Neighborhood Technology
 Speakers: Jeff Price, Federal Transit Administration Linda Young, Center for Neighborhood Technology Sofia Becker, Center for Neighborhood Technology Peter Haas, Center for Neighborhood Technology Craig
Spatial Organization of Data and Data Extraction from Maptitude
 Spatial Organization of Data and Data Extraction from Maptitude N. P. Taliceo Geospatial Information Sciences The University of Texas at Dallas UT Dallas GIS Workshop Richardson, TX March 30 31, 2018 1/
Exercise on Using Census Data UCSB, July 2006
 Exercise on Using Census Data UCSB, July 2006 Purpose The purpose of this lab is to become familiar with Census Bureau data. Second, we will learn how to join tables which allows you to add data to the
The geography of domestic energy consumption
 The geography of domestic energy consumption Anastasia Ushakova PhD student at CDRC UCL Ellen Talbot PhD student at CDRC Liverpool Some important research questions How can we classify energy consumption
OnTheMap for Emergency Management
 OnTheMap for Emergency Management Robert Pitts Geographer/Project Manager Longitudinal Employer Household Dynamics (LEHD) Center for Economic Studies U.S. Census Bureau Jody Hoon-Star Geographer/Application
GIS Lecture 5: Spatial Data
 GIS Lecture 5: Spatial Data GIS 1 Outline Vector Data Formats Raster Data Formats Map Projections Coordinate Systems US Census geographic files US Census data files GIS Data Sources GIS 2 Vector Data Formats
GIS Spatial Statistics for Public Opinion Survey Response Rates
 GIS Spatial Statistics for Public Opinion Survey Response Rates July 22, 2015 Timothy Michalowski Senior Statistical GIS Analyst Abt SRBI - New York, NY t.michalowski@srbi.com www.srbi.com Introduction
Globally Estimating the Population Characteristics of Small Geographic Areas. Tom Fitzwater
 Globally Estimating the Population Characteristics of Small Geographic Areas Tom Fitzwater U.S. Census Bureau Population Division What we know 2 Where do people live? Difficult to measure and quantify.
Are You Maximizing The Value Of All Your Data?
 Are You Maximizing The Value Of All Your Data? Using The SAS Bridge for ESRI With ArcGIS Business Analyst In A Retail Market Analysis SAS and ESRI: Bringing GIS Mapping and SAS Data Together Presented
Rural Pennsylvania: Where Is It Anyway? A Compendium of the Definitions of Rural and Rationale for Their Use
 Rural Pennsylvania: Where Is It Anyway? A Compendium of the Definitions of Rural and Rationale for Their Use Pennsylvania Office of Rural Health 310 Nursing Sciences Building University Park, PA 16802
INSIDE. Metric Descriptions by Topic Area. Data Sources and Methodology by Topic Area. Technical Appendix
 As part of the Chicago Neighborhoods 2015 (CN2015) project, the Institute for Housing Studies at DePaul University collected data and built metrics to help The Chicago Community Trust and the City of Chicago
Big-Geo-Data EHR Infrastructure Development for On-Demand Analytics
 Big-Geo-Data EHR Infrastructure Development for On-Demand Analytics Sohayla Pruitt, MA Senior Geospatial Scientist Duke Medicine DUHS DHTS EIM HIRS Page 1 Institute of Medicine, World Health Organization,
Acknowledgments xiii Preface xv. GIS Tutorial 1 Introducing GIS and health applications 1. What is GIS? 2
 Acknowledgments xiii Preface xv GIS Tutorial 1 Introducing GIS and health applications 1 What is GIS? 2 Spatial data 2 Digital map infrastructure 4 Unique capabilities of GIS 5 Installing ArcView and the
Inclusion of Non-Street Addresses in Cancer Cluster Analysis
 Inclusion of Non-Street Addresses in Cancer Cluster Analysis Sue-Min Lai, Zhimin Shen, Darin Banks Kansas Cancer Registry University of Kansas Medical Center KCR (Kansas Cancer Registry) KCR: population-based
BROOKINGS May
 Appendix 1. Technical Methodology This study combines detailed data on transit systems, demographics, and employment to determine the accessibility of jobs via transit within and across the country s 100
Working with ArcGIS Online
 Esri International User Conference San Diego, CA Technical Workshops July 12, 2011 Working with ArcGIS Online Bern Szukalski, Deane Kensok Topics for this Session ArcGIS Online Overview ArcGIS Online Content
Final Group Project Paper. Where Should I Move: The Big Apple or The Lone Star State
 Final Group Project Paper Where Should I Move: The Big Apple or The Lone Star State By: Nathan Binder, Shannon Scolforo, Kristina Conste, Madison Quinones Main Goal: Determine whether New York or Texas
A Comprehensive Method for Identifying Optimal Areas for Supermarket Development. TRF Policy Solutions April 28, 2011
 A Comprehensive Method for Identifying Optimal Areas for Supermarket Development TRF Policy Solutions April 28, 2011 Profile of TRF The Reinvestment Fund builds wealth and opportunity for lowwealth communities
Module 10 Summative Assessment
 Module 10 Summative Assessment Activity In this activity you will use the three dimensions of vulnerability that you learned about in this module exposure, sensitivity, and adaptive capacity to assess
Institutional Research with Public Data and Open Source Software
 2017 Institutional Research with Public Data and Open Source Software DUE1304591, 1644409, 1700496 Opinions expressed are those of the authors and not necessarily those of the National Science Foundation.
A Street Named for a King
 A Street Named for a King Dr. Jerry Mitchell University of South Carolina OVERVIEW This lesson adapts the work of Dr. Derek Alderman, a geographer who has used the Martin Luther King, Jr. street-naming
Administrative Data Research Facility Linked HMDA and ACS Database
 University of Pennsylvania ScholarlyCommons 2017 ADRF Network Research Conference Presentations ADRF Network Research Conference Presentations 11-2017 Administrative Data Research Facility Linked HMDA
Assessing Social Vulnerability to Biophysical Hazards. Dr. Jasmine Waddell
 Assessing Social Vulnerability to Biophysical Hazards Dr. Jasmine Waddell About the Project Built on a need to understand: The pre-disposition of the populations in the SE to adverse impacts from disaster
Evaluating Community Analyst for Use in School Demography Studies
 Portland State University PDXScholar Publications, Reports and Presentations Population Research Center 7-2013 Evaluating Community Analyst for Use in School Demography Studies Richard Lycan Portland State
GIS ADMINISTRATOR / WEB DEVELOPER EVANSVILLE-VANDERBURGH COUNTY AREA PLAN COMMISSION
 GIS ADMINISTRATOR / WEB DEVELOPER EVANSVILLE-VANDERBURGH COUNTY AREA PLAN COMMISSION SALARY RANGE INITIATION $43,277 SIX MONTHS $45,367 POSITION GRADE PAT VI The Evansville-Vanderburgh County Area Plan
Geographic Systems and Analysis
 Geographic Systems and Analysis New York University Robert F. Wagner Graduate School of Public Service Instructor Stephanie Rosoff Contact: stephanie.rosoff@nyu.edu Office hours: Mondays by appointment
Do the Causes of Poverty Vary by Neighborhood Type?
 Do the Causes of Poverty Vary by Neighborhood Type? Suburbs and the 2010 Census Conference Uday Kandula 1 and Brian Mikelbank 2 1 Ph.D. Candidate, Maxine Levin College of Urban Affairs Cleveland State
Population Profiles
 U N D E R S T A N D I N G A N D E X P L O R I N G D E M O G R A P H I C C H A N G E MAPPING AMERICA S FUTURES, BRIEF 6 2000 2010 Population Profiles Atlanta, Las Vegas, Washington, DC, and Youngstown Allison
PopStats Data Resource Manual. Demographic and Socio-Economic Data
 PopStats Data Resource Manual Demographic and Socio-Economic Data This page is intentionally left blank. Table of Contents 1 Introduction and How to Use this Guide 2 Using PopStats 3 Data Sources and Methodology
Census Transportation Planning Products (CTPP)
") Census Transportation Planning Products (CTPP) Penelope Weinberger CTPP Program Manager - AASHTO September 15, 2010 1 What is the CTPP Program Today? The CTPP is an umbrella program of data products, custom
Census Transportation Planning Products (CTPP) Penelope Weinberger CTPP Program Manager - AASHTO September 15, 2010 1 What is the CTPP Program Today? The CTPP is an umbrella program of data products, custom
Tracey Farrigan Research Geographer USDA-Economic Research Service
 Rural Poverty Symposium Federal Reserve Bank of Atlanta December 2-3, 2013 Tracey Farrigan Research Geographer USDA-Economic Research Service Justification Increasing demand for sub-county analysis Policy
Understanding Your Community A Guide to Data
 Understanding Your Community A Guide to Data Alex Lea September 2013 Research and Insight Team LeicestershireCounty Council Understanding Geographies Important to understand the various geographies that
GIS 520 Data Cardinality. Joining Tabular Data to Spatial Data in ArcGIS
 GIS 520 Data Cardinality Joining Tabular Data to Spatial Data in ArcGIS Joining Tabular Data to Spatial Data in ArcGIS Outline Working with Zip Code Data Data Cardinality Issues Exploring Data Format Requirements
2014 Planning Database (PDB)
") 2014 Planning Database (PDB) November 19, 2014 Barbara O Hare, Nancy Bates, Julia Coombs, Travis Pape, Chandra Erdman Office of Survey Analytics 1 Overview Tract and Block Group PDBs Useful for: Identifying
2014 Planning Database (PDB) November 19, 2014 Barbara O Hare, Nancy Bates, Julia Coombs, Travis Pape, Chandra Erdman Office of Survey Analytics 1 Overview Tract and Block Group PDBs Useful for: Identifying
EXAMINING THE DEMOGRAPHICS OF THE DOG RIVER WATERSHED
 EXAMINING THE DEMOGRAPHICS OF THE DOG RIVER WATERSHED Phillip B. Whatley, Department of Earth Sciences, University of South Alabama, Mobile, AL, 36688. Email: pbw401@jaguar1.usouthal.edu. Examining the
emerge Network: CERC Survey Survey Sampling Data Preparation
 emerge Network: CERC Survey Survey Sampling Data Preparation Overview The entire patient population does not use inpatient and outpatient clinic services at the same rate, nor are racial and ethnic subpopulations
How is Your Health? Using SAS Macros, ODS Graphics, and GIS Mapping to Monitor Neighborhood and Small-Area Health Outcomes
 Paper 3214-2015 How is Your Health? Using SAS Macros, ODS Graphics, and GIS Mapping to Monitor Neighborhood and Small-Area Health Outcomes Roshni Shah, Santa Clara County Public Health Department ABSTRACT
emerge Network: CERC Survey Survey Sampling Data Preparation
 emerge Network: CERC Survey Survey Sampling Data Preparation Overview The entire patient population does not use inpatient and outpatient clinic services at the same rate, nor are racial and ethnic subpopulations
Understanding China Census Data with GIS By Shuming Bao and Susan Haynie China Data Center, University of Michigan
 Understanding China Census Data with GIS By Shuming Bao and Susan Haynie China Data Center, University of Michigan The Census data for China provides comprehensive demographic and business information
Under a New Halo: Site Suitability Study for the Hypothetical Relocation of Angel Stadium. Jerry P. Magaña
 Under a New Halo: Site Suitability Study for the Hypothetical Relocation of Angel Stadium Jerry P. Magaña About me Relatively new to GIS and an honor to present at the 2017 UC Received Certificate in GIS
Analysis of Bank Branches in the Greater Los Angeles Region
 Analysis of Bank Branches in the Greater Los Angeles Region Brian Moore Introduction The Community Reinvestment Act, passed by Congress in 1977, was written to address redlining by financial institutions.
Social Vulnerability Index. Susan L. Cutter Department of Geography, University of South Carolina
 Social Vulnerability Index Susan L. Cutter Department of Geography, University of South Carolina scutter@sc.edu Great Lakes and St. Lawrence Cities Initiative Webinar December 3, 2014 Vulnerability The
Developing Spatial Data to Support Statistical Analysis of Education
 Developing Spatial Data to Support Statistical Analysis of Education Doug Geverdt National Center for Education Statistics Education Demographic and Geographic Estimates (EDGE) Program 2016 ESRI User Conference
Neighborhood Locations and Amenities
 University of Maryland School of Architecture, Planning and Preservation Fall, 2014 Neighborhood Locations and Amenities Authors: Cole Greene Jacob Johnson Maha Tariq Under the Supervision of: Dr. Chao
Visualization of Commuter Flow Using CTPP Data and GIS
 Visualization of Commuter Flow Using CTPP Data and GIS Research & Analysis Department Southern California Association of Governments 2015 ESRI User Conference l July 23, 2015 l San Diego, CA Jung Seo,
Geospatial Analysis of Job-Housing Mismatch Using ArcGIS and Python
 Geospatial Analysis of Job-Housing Mismatch Using ArcGIS and Python 2016 ESRI User Conference June 29, 2016 San Diego, CA Jung Seo, Frank Wen, Simon Choi and Tom Vo, Research & Analysis Southern California
compass.durhamnc.gov Building Community by Illustrating Community Durham s Neighborhood Compass
 Building Community by Illustrating Community Durham s Neighborhood Compass A presentation by John Killeen Rob Cushman Tyler Waring Neighborhood Improvement Services & Technology Solutions City of Durham,
Spatial Analysis with Web GIS. Rachel Weeden
 Spatial Analysis with Web GIS Rachel Weeden Agenda Subhead goes here Introducing ArcGIS Online Spatial Analysis Workflows Scenarios Other Options Resources ArcGIS is a Platform Making mapping and analytics
Child Opportunity Index Mapping
 Child Opportunity Index Mapping A partnership project of How to Use and Interpret the Child Opportunity Index Maps How to Use the Child Opportunity Index Maps Getting Started: How to Find and Open a Child
STAR COMMUNITY RATING SYSTEM OBJECTIVE EE-4: EQUITABLE SERVICES & ACCESS COMMUNITY LEVEL OUTCOMES FOR KING COUNTY, WA
 STAR COMMUNITY RATING SYSTEM OBJECTIVE EE-4: EQUITABLE SERVICES & ACCESS COMMUNITY LEVEL OUTCOMES FOR KING COUNTY, WA OUTCOME I: EQUITABLE ACCESS AND PROXIMITY Background: This analysis has been developed
LEO Catchment Profile (LCP) Key Data for Enterprise Strategy
 Key Data for Enterprise Strategy") Laois...Portarlington LEO Catchment Profile (LCP) Key Data for Enterprise Strategy Laois Local Enterprise Office Address: Business Support Unit, County Hall, Portlaoise, County Laois Web: https://www.localenterprise.ie/laois/
Laois...Portarlington LEO Catchment Profile (LCP) Key Data for Enterprise Strategy Laois Local Enterprise Office Address: Business Support Unit, County Hall, Portlaoise, County Laois Web: https://www.localenterprise.ie/laois/
Esri s Living Atlas of the World Community Maps
 Esri s Living Atlas of the World Community Maps Seth Sarakaitis Wednesday May 7, 2014 ArcGIS Living Atlas Concept Living Atlas Content Tour Contributing to the Living Atlas (Community Maps) Seth Sarakaitis
Orien Ori t en a t tion a Webi W nar: ebi CPD Maps 2
 Orientation Webinar: CPD Maps 2 Agenda 1. Background - econ Planning Suite 2. Expanded Planning Data 3. CPD Maps Overview 4. Demonstration Guide Me Wizard Map Selection Identify Tool Printing and Saving
AFFH-T User Guide September 2017 AFFH-T User Guide U.S. Department of Housing and Urban Development
 AFFH-T User Guide Affirmatively Furthering Fair Housing Data and Mapping Tool v. 4.1 U.S. Department of Housing and Urban Development September 2017 Version 4.1 ❿ September 2017 Page 1 Document History
Tutorial using the 2011 Statistics Canada boundary files and the Householder survey
 Tutorial using the 2011 Statistics Canada boundary files and the Householder survey In this tutorial, we ll try to determine the wards that contain the highest income groups. To do this, we will have to
Mapping Accessibility Over Time
 Journal of Maps, 2006, 76-87 Mapping Accessibility Over Time AHMED EL-GENEIDY and DAVID LEVINSON University of Minnesota, 500 Pillsbury Drive S.E., Minneapolis, MN 55455, USA; geneidy@umn.edu (Received
2014 HAZUS Methodology and Results Reports
 Union County 2014 Hazard Vulnerability Assessment and Mitigation Plan Update Appendix F 2014 HAZUS Methodology and Results Reports F-1 Union County 2014 Hazard Vulnerability Assessment and Mitigation Plan
2010 Census Data Release and Current Geographic Programs. Michaellyn Garcia Geographer Seattle Regional Census Center
 2010 Census Data Release and Current Geographic Programs Michaellyn Garcia Geographer Seattle Regional Census Center 2010 Center of Population Located approximately 2.7 miles northeast of Plato, Missouri
Hennepin GIS. Tree Planting Priority Areas - Analysis Methodology. GIS Services April 2018 GOAL:
 Hennepin GIS GIS Services April 2018 Tree Planting Priority Areas - Analysis Methodology GOAL: To create a GIS data layer that will aid Hennepin County Environment & Energy staff in determining where to
Implications for the Sharing Economy
 Locational Big Data and Analytics: Implications for the Sharing Economy AMCIS 2017 SIGGIS Workshop Brian N. Hilton, Ph.D. Associate Professor Director, Advanced GIS Lab Center for Information Systems and
Integrating GIS into Food Access Analysis
 GIS Day at Kansas University Integrating GIS into Food Access Analysis Daoqin Tong School of Geography and Development Outline Introduction Research questions Method Results Discussion Introduction Food
Introduction to Spatial Analysis in ArcGIS Online. Jian Lange, Vicki Lynn Cove
 Introduction to Spatial Analysis in ArcGIS Online Jian Lange, Vicki Lynn Cove Topics Introducing ArcGIS Online Spatial Analysis ArcGIS Online Spatial Analysis Workflow Demos and examples - Using ArcGIS
MAKING PLANNING LOCAL
 Georgia Social Vulnerability Index 2010 Atlas MAKING PLANNING LOCAL VULNERABLE & AT-RISK POPULATIONS DATA FOR JURISDICTIONS AT THE CENSUS TRACT LEVEL Public Health Districts Regional Coordinating Hospital
AUTOMATED METERED WATER CONSUMPTION ANALYSIS
 AUTOMATED METERED WATER CONSUMPTION ANALYSIS Shane Zhong 1, Nick Turich 1, Patrick Hayde 1 1. Treatment and Network Planning, SA Water, Adelaide, SA, Australia ABSTRACT Water utilities collect and store
Council Workshop on Neighbourhoods Thursday, October 4 th, :00 to 4:00 p.m. Burlington Performing Arts Centre
 Council Workshop on Neighbourhoods Thursday, October 4 th, 2012 1:00 to 4:00 p.m. Burlington Performing Arts Centre Agenda Introductions Warm-Up Exercise Presentation Exercise Neighbourhood Planning Break
Frontier and Remote (FAR) Area Codes: A Preliminary View of Upcoming Changes John Cromartie Economic Research Service, USDA
 Area Codes: A Preliminary View of Upcoming Changes John Cromartie Economic Research Service, USDA") National Center for Frontier Communities webinar, January 27, 2015 Frontier and Remote (FAR) Area Codes: A Preliminary View of Upcoming Changes John Cromartie Economic Research Service, USDA The views
National Center for Frontier Communities webinar, January 27, 2015 Frontier and Remote (FAR) Area Codes: A Preliminary View of Upcoming Changes John Cromartie Economic Research Service, USDA The views
ASSOCIATED PRESS-WEATHER UNDERGROUND WEATHER SURVEY CONDUCTED BY KNOWLEDGE NETWORKS January 28, 2011
 1350 Willow Rd, Suite 102 Menlo Park, CA 94025 www.knowledgenetworks.com Interview dates: January 21 January 26, 2011 Interviews: 1,125 adults Sampling margin of error for a 50% statistic with 95% confidence
Hazus Methodology and Results Report
 Cumberland County 2014 All-Hazard Mitigation Plan Update Appendix G Hazus Methodology and Results Report The Cumberland County HMP used an enhanced Hazus run to model the 1% annual-chanceflood. Enhancements
Esri Maps for Office
 2013 Europe, Middle East, and Africa User Conference October 23-25, 2013 Munich, Germany Maps for Office Tony Howser Technical Product Manager Agenda Location Analytics Maps for Office 2.1.2 Road Ahead
Datahoods or Data-Driven Neighborhoods. Using GIS to better understand neighborhoods
 Datahoods or Data-Driven Neighborhoods Using GIS to better understand neighborhoods Who am I? Silas Toms President, Loki Intelligent Corporation Author, ArcPy and ArcGIS (2 editions) Co-Host of the Mappyist
GROWING APART: THE CHANGING FIRM-SIZE WAGE PREMIUM AND ITS INEQUALITY CONSEQUENCES ONLINE APPENDIX
 GROWING APART: THE CHANGING FIRM-SIZE WAGE PREMIUM AND ITS INEQUALITY CONSEQUENCES ONLINE APPENDIX The following document is the online appendix for the paper, Growing Apart: The Changing Firm-Size Wage
Map your way to deeper insights
 Map your way to deeper insights Target, forecast and plan by geographic region Highlights Apply your data to pre-installed map templates and customize to meet your needs. Select from included map files
The Cultural Landscape Eleventh Edition
 Chapter 13 Lecture The Cultural Landscape Eleventh Edition Urban Patterns Matthew Cartlidge University of Nebraska-Lincoln Key Issues Why do services cluster downtown? Where are people distributed within
GIS-Based Analysis of the Commuting Behavior and the Relationship between Commuting and Urban Form
 GIS-Based Analysis of the Commuting Behavior and the Relationship between Commuting and Urban Form 1. Abstract A prevailing view in the commuting is that commuting would reconstruct the urban form. By
Purpose Study conducted to determine the needs of the health care workforce related to GIS use, incorporation and training.
 GIS and Health Care: Educational Needs Assessment Cindy Gotz, MPH, CHES Janice Frates, Ph.D. Suzanne Wechsler, Ph.D. Departments of Health Care Administration & Geography California State University Long
This report details analyses and methodologies used to examine and visualize the spatial and nonspatial
 Analysis Summary: Acute Myocardial Infarction and Social Determinants of Health Acute Myocardial Infarction Study Summary March 2014 Project Summary :: Purpose This report details analyses and methodologies
The Attractive Side of Corpus Christi: A Study of the City s Downtown Economic Growth
 The Attractive Side of Corpus Christi: A Study of the City s Downtown Economic Growth GISC PROJECT DR. LUCY HUANG SPRING 2012 DIONNE BRYANT Introduction Background As a GIS Intern working with the City
Visualizing Census Data in GIS. Andrew Rowan, Ph.D. Director, NJ Office of GIS
 Visualizing Census Data in GIS Andrew Rowan, Ph.D. Director, NJ Office of GIS Outline VERY accelerated cartography primer Software choices Demos/how-to ArcGIS Desktop (formerly ArcView) ArcGIS Online Notes
Getting Started with Community Maps
 Esri International User Conference San Diego, California Technical Workshops July 24, 2012 Getting Started with Community Maps Shane Matthews and Tamara Yoder Topics for this Session ArcGIS is a complete
Analysis of Change in Land Use around Future Core Transit Corridors: Austin, TX, Eric Porter May 3, 2012
 Analysis of Change in Land Use around Future Core Transit Corridors: Austin, TX, 1990-2006 PROBLEM DEFINITION Eric Porter May 3, 2012 This study examines the change in land use from 1990 to 2006 in the
APPENDIX C-3 Equitable Target Areas (ETA) Technical Analysis Methodology
 Technical Analysis Methodology") APPENDIX C-3 Equitable Target Areas (ETA) Technical Analysis Methodology Contents Introduction... 1 ETA Index Methodology... 1 ETA Index Development... 1 Other EJ Measures... 4 The Limited English Proficiency
APPENDIX C-3 Equitable Target Areas (ETA) Technical Analysis Methodology Contents Introduction... 1 ETA Index Methodology... 1 ETA Index Development... 1 Other EJ Measures... 4 The Limited English Proficiency
Guide to the Data-Driven Planning Toolkit in CPD Maps
 The econ Planning Suite: Guide to the Data-Driven Planning Toolkit in CPD Maps Version: April 2014 TABLE OF CONTENTS Introduction... 1 The Data-Driven Planning Toolkit... 3 Overview of the Basic Model...
Finding Common Ground Through GIS
 Finding Common Ground Through GIS Matthew Stone, MPH Special Unit for Technical Assistance Chronic Disease and Injury Control California Department of Public Health ESRI Health GIS Conference Scottsdale,
Housing Action Illinois Membership Coverage and Recommended New Office Location
 Housing Action Illinois Membership Coverage and Recommended New Office Location Housing Action Illinois GEO 242: GIS II Dr. Hwang March 10, 2011 Alex Bordens Jeffrey Lind Sergio Mendoza Brad Nosan Mercedes
Where to Invest Affordable Housing Dollars in Polk County?: A Spatial Analysis of Opportunity Areas
 Resilient Neighborhoods Technical Reports and White Papers Resilient Neighborhoods Initiative 6-2014 Where to Invest Affordable Housing Dollars in Polk County?: A Spatial Analysis of Opportunity Areas
Intimate Infrastructures
 Intimate Infrastructures A social and spatial strategy for high-density design at a human scale By Natasha Reid Intimate Infrastructures Intimate Infrastructures A social and spatial strategy for high-density
Community Inclusion in Colorado
 A Mapping Project for Emergency Preparedness and Response Aimee Voth Siebert, MA Julia Beems, MA Rachel Coles, MA Devon Williford, MPH Adam Anderson, MURP, MPH March 2015 understanding that HUMAN ENERGY
An Introduction to China and US Map Library. Shuming Bao Spatial Data Center & China Data Center University of Michigan
 An Introduction to China and US Map Library Shuming Bao Spatial Data Center & China Data Center University of Michigan Current Spatial Data Services http://chinadataonline.org China Geo-Explorer http://chinageoexplorer.org
Tools to Assess Local Health Needs. Richard Leadbeater, Esri NACo 2011 Healthy Counties Forum December 1, 2011
 Tools to Assess Local Health Needs Richard Leadbeater, Esri NACo 2011 Healthy Counties Forum December 1, 2011 Richard Leadbeater currently holds the position of Industry Solutions Manager with Esri. He