Administrative Data Research Facility Linked HMDA and ACS Database
|
|
|
- Virginia Holland
- 5 years ago
- Views:
Transcription
1 University of Pennsylvania ScholarlyCommons 2017 ADRF Network Research Conference Presentations ADRF Network Research Conference Presentations Administrative Data Research Facility Linked HMDA and ACS Database Jun Zhu Urban Institute Follow this and additional works at: admindata_conferences_presentations_2017 Zhu, Jun, "Administrative Data Research Facility Linked HMDA and ACS Database" (2017) ADRF Network Research Conference Presentations This paper is posted at ScholarlyCommons. For more information, please contact
2 Administrative Data Research Facility Linked HMDA and ACS Database This presentation is available at ScholarlyCommons:

3 Administrative Data Research Facility Linked HMDA and ACS Database Jun Zhu Housing Finance Policy Center Urban Institute
4 Background Challenges for research: Publicly available government data is messy and hard to aggregate up and link to geographic levels Researchers need to download data and use the installed statistical software to analyze the data Our solution: Create a relational database across geographies by crosswalking data Databases can either be downloaded on the initial web interface or spun up into the spark social science platform for analysis.
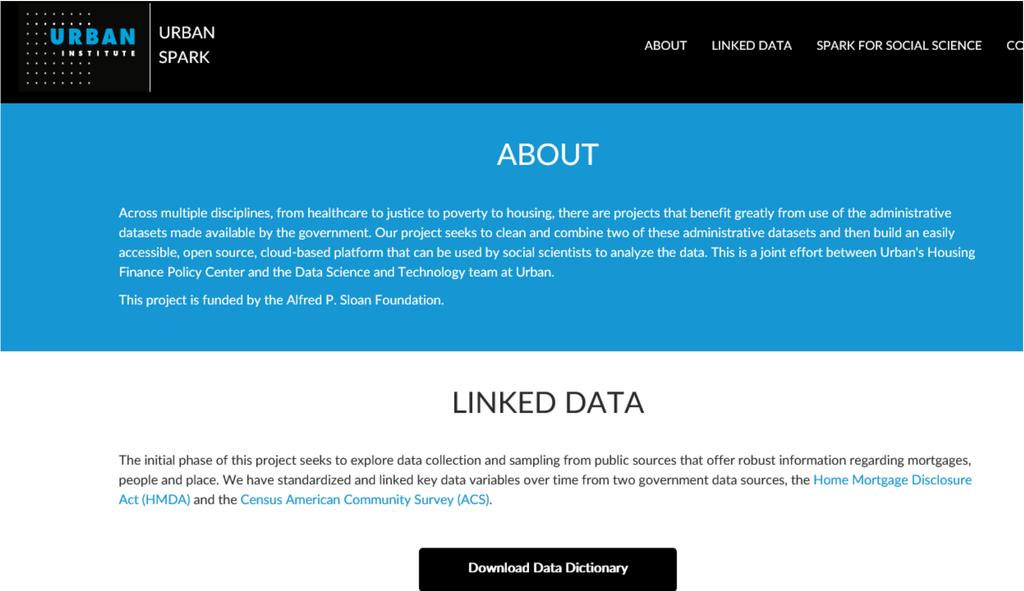
5 Product Details LINKED DATASETS Most of the variables from American Community Survey (ACS) and Home Mortgage Disclosure Act (HMDA) linked by geographies Data Dictionary to define these variables SPARK SOCIAL SCIENCE PLATFORM Push button launch of platform from website Platform includes tutorials, access to linked data and manual WEB INTERFACE Basic, open-source website offering download of data/data dictionary and a way to launch the analytics platform Critical information about the project, including guidance on how to cite linked data
6 Product Details Linked Datasets For download Public Web Interface Project information, links to publications, links to resources. Data Dictionary For download Spark Platform Button launches platform Tutorials Data

7

8 Sloan Website Data can also be analyzed in the Spark for Social Science platform

9 Spark
10 Methodology We have linked the two datasets on geographic level. Census Tract 2000 to Census Tract 2010 Census Tract (HMDA) PUMA (ACS) PUMA 2000 to Census Tract 2010 Census Tract 2000 to PUMA 2010 PUMA 2000 to PUMA 2010 Census Tract 2010 to Zipcode 2010 PUMA 2010 to CBSA 2013 PUMA 2010 to County 2014 If the direct crosswalk is not available from the website, we did some manipulations to create a new crosswalk

11 Geographic Levels Available From 2001 There are 6 databases at different geographic levels.
12 Data structure HMDA Variables ACS Housing Variables ACS Household Variables ACS Person Variables Agency Supervisory/reg ulatory agency of institution Loan purpose Purchase, refinance, home improvement Loan Amount Mortgage Status If there is a mortgage owned free and clear Bedrooms Number of bedrooms in the house Monthly Mortgage Payment Number of families Number of families in the household Multiple generations Number of generations in the household Household Income Sex Whether the respondent is male or female Grade Attained Grade or level of recent schooling Transportation Time (minutes) In the dataset, we have included both the raw variables from HMDA and ACS, as well as some variables which we constructed
13 Variable Types Categorical Variables Numerical Variables Categorical- Categorical Categorical- Numerical Variable with codes Mean Percentiles (P10, P25, P50, P75, P90) Standard deviation Variable with codes Mean

14 Data Dictionary We have a detailed data dictionary available which covers all the data types, variables, and definitions
 find the race/ethnicity variable and ownership variables.")
15 Sample Use Case What is the black homeownership rate in Atlanta? Original Way: (1) go to IPUMS. (2) find the race/ethnicity variable and ownership variables. (3) find the geographic level variables.
16 Answer This Question using IPUMS Pick the years. Search for the crosswalk (PUMA 2000 to PUMA 2010) Calculate the total households and homeowners using crosswalk
17 Or with the ADRF 3 Simple Steps: Use the CBSA database Search for CBSA (12060) for Atlanta Find the cross tab variable: race1_hh_b_ownership_1 and single categorical variable: race1_hh_b Year HH_Black Owner_Black Black homeownership rate , , % , , % , , % , , % , , % , , % , , % , , % , , % , , % , , %
18 Developing a Housing Affordability Index A New housing affordability index How many renters earn as much income as an owner who just purchased a 1-4 unit home in the same area? PA= Likelihood that a renter s income falls in a specific income level A QA= Likelihood that a renter s income is enough to get a mortgage and purchase a home, given his/her specific income level A Renter income: ACS; Borrower income: HMDA
19 Affordability Index Inputs Using ADRF Income Level P A Q A P A *Q A
20 Affordability Index Using ADRF
21 Using the database for empirical studies Different geographic level variables can be easily added in the regressions to control the local market conditions. Unemployment rate by race at county level Percentage of minority population at zipcode level Average mortgage borrower income at census tract level Average loan amount at CBSA level
22 Future Work We hope that the process of doing these crosswalks is helpful to researchers in all fields In the next phase of our project, we plan to include more datasets We are planning to update the most recent 2016 HMDA and ACS data.
The Church Demographic Specialists
 The Church Demographic Specialists Easy-to-Use Features Map-driven, Web-based Software An Integrated Suite of Information and Query Tools Providing An Insightful Window into the Communities You Serve Key
AFFH-T User Guide September 2017 AFFH-T User Guide U.S. Department of Housing and Urban Development
 AFFH-T User Guide Affirmatively Furthering Fair Housing Data and Mapping Tool v. 4.1 U.S. Department of Housing and Urban Development September 2017 Version 4.1 ❿ September 2017 Page 1 Document History
Demographic Data in ArcGIS. Harry J. Moore IV
 Demographic Data in ArcGIS Harry J. Moore IV Outline What is demographic data? Esri Demographic data - Real world examples with GIS - Redistricting - Emergency Preparedness - Economic Development Next
Medical GIS: New Uses of Mapping Technology in Public Health. Peter Hayward, PhD Department of Geography SUNY College at Oneonta
 Medical GIS: New Uses of Mapping Technology in Public Health Peter Hayward, PhD Department of Geography SUNY College at Oneonta Invited research seminar presentation at Bassett Healthcare. Cooperstown,
Speakers: Jeff Price, Federal Transit Administration Linda Young, Center for Neighborhood Technology Sofia Becker, Center for Neighborhood Technology
 Speakers: Jeff Price, Federal Transit Administration Linda Young, Center for Neighborhood Technology Sofia Becker, Center for Neighborhood Technology Peter Haas, Center for Neighborhood Technology Craig
INSIDE. Metric Descriptions by Topic Area. Data Sources and Methodology by Topic Area. Technical Appendix
 As part of the Chicago Neighborhoods 2015 (CN2015) project, the Institute for Housing Studies at DePaul University collected data and built metrics to help The Chicago Community Trust and the City of Chicago
Working with Census 2000 Data from MassGIS
 Tufts University GIS Tutorial Working with Census 2000 Data from MassGIS Revised September 26, 2007 Overview In this tutorial, you will use pre-processed census data from Massachusetts to create maps of
Residential Demographic Multipliers
 Rutgers University, Center for Urban Policy Research Residential Demographic Multipliers Estimates of the Occupants of New Housing (Residents, School-Age Children, Public School-Age Children) by State,
Demographic Data. How to get it and how to use it (with caution) By Amber Keller
 By Amber Keller") Demographic Data How to get it and how to use it (with caution) By Amber Keller 101 Where does it come from? o The American Community Survey o Socio-economic characteristics of a population o Administered
Demographic Data How to get it and how to use it (with caution) By Amber Keller 101 Where does it come from? o The American Community Survey o Socio-economic characteristics of a population o Administered
Using American Factfinder
 Using American Factfinder What is American Factfinder? American Factfinder is a search engine that provides access to the population, housing and economic data collected by the U.S. Census Bureau. It can
Understanding China Census Data with GIS By Shuming Bao and Susan Haynie China Data Center, University of Michigan
 Understanding China Census Data with GIS By Shuming Bao and Susan Haynie China Data Center, University of Michigan The Census data for China provides comprehensive demographic and business information
Spatial Organization of Data and Data Extraction from Maptitude
 Spatial Organization of Data and Data Extraction from Maptitude N. P. Taliceo Geospatial Information Sciences The University of Texas at Dallas UT Dallas GIS Workshop Richardson, TX March 30 31, 2018 1/
ACS Multiyear PUMS Estimates and Usage: User-Created PUMS Files. Nate Ramsey U.S. Department of Education
 ACS Multiyear PUMS Estimates and Usage: User-Created PUMS Files Nate Ramsey U.S. Department of Education Research Questions 1. How accurate are concatenated single-year PUMS file estimates? 2. How often
This report details analyses and methodologies used to examine and visualize the spatial and nonspatial
 Analysis Summary: Acute Myocardial Infarction and Social Determinants of Health Acute Myocardial Infarction Study Summary March 2014 Project Summary :: Purpose This report details analyses and methodologies
The econ Planning Suite: CPD Maps and the Con Plan in IDIS for Consortia Grantees Session 1
 The econ Planning Suite: CPD Maps and the Con Plan in IDIS for Consortia Grantees Session 1 1 Training Objectives Use CPD Maps to analyze, assess, and compare levels of need in your community Use IDIS
PALS: Neighborhood Identification, City of Frederick, Maryland. David Boston Razia Choudhry Chris Davis Under the supervision of Chao Liu
 PALS: Neighborhood Identification, City of Frederick, Maryland David Boston Razia Choudhry Chris Davis Under the supervision of Chao Liu University of Maryland School of Architecture, Planning & Preservation
User Guide. Affirmatively Furthering Fair Housing Data and Mapping Tool. U.S. Department of Housing and Urban Development
 User Guide Affirmatively Furthering Fair Housing Data and Mapping Tool U.S. Department of Housing and Urban Development December, 2015 1 Table of Contents 1. Getting Started... 5 1.1 Software Version...
Applying Health Outcome Data to Improve Health Equity
 Applying Health Outcome Data to Improve Health Equity Devon Williford, MPH, Health GIS Specialist Lorraine Dixon-Jones, Policy Analyst CDPHE Health Equity and Environmental Justice Collaborative Mile High
Mapping the Route Identifying and Consulting with HS2 s Impacted Populations
 Tuesday 6 December 2016 Mapping the Route Identifying and Consulting with HS2 s Impacted Populations Carry Stephenson, Evelyn Robertson SYSTRA Michael Flynn HS2 Summary Study Context and Objectives Methodology
Spatiotemporal Analysis of Commuting Patterns in Southern California Using ACS PUMS, CTPP and LODES
 Spatiotemporal Analysis of Commuting Patterns in Southern California Using ACS PUMS, CTPP and LODES 2017 ACS Data Users Conference May 11-12, 2017 Alexandria, VA Jung Seo, Tom Vo, Frank Wen and Simon Choi
A User s Guide to the Federal Statistical Research Data Centers
 A User s Guide to the Federal Statistical Research Data Centers Mark Roberts Professor of Economics and Director PSU FSRDC September 2016 M. Roberts () RDC User s Guide September 2016 1 / 14 Outline Introduction
Census Transportation Planning Products (CTPP)
") Census Transportation Planning Products (CTPP) Penelope Weinberger CTPP Program Manager - AASHTO September 15, 2010 1 What is the CTPP Program Today? The CTPP is an umbrella program of data products, custom
Census Transportation Planning Products (CTPP) Penelope Weinberger CTPP Program Manager - AASHTO September 15, 2010 1 What is the CTPP Program Today? The CTPP is an umbrella program of data products, custom
Jun Tu. Department of Geography and Anthropology Kennesaw State University
 Examining Spatially Varying Relationships between Preterm Births and Ambient Air Pollution in Georgia using Geographically Weighted Logistic Regression Jun Tu Department of Geography and Anthropology Kennesaw
Guide to the Data-Driven Planning Toolkit in CPD Maps
 The econ Planning Suite: Guide to the Data-Driven Planning Toolkit in CPD Maps Version: April 2014 TABLE OF CONTENTS Introduction... 1 The Data-Driven Planning Toolkit... 3 Overview of the Basic Model...
Massachusetts Institute of Technology Department of Urban Studies and Planning
 Massachusetts Institute of Technology Department of Urban Studies and Planning 11.204: Planning, Communications & Digital Media Fall 2002 Lecture 6: Tools for Transforming Data to Action Lorlene Hoyt October
What are we like? Population characteristics from UK censuses. Justin Hayes & Richard Wiseman UK Data Service Census Support
 What are we like? Population characteristics from UK censuses Justin Hayes & Richard Wiseman UK Data Service Census Support Who are we? Richard Wiseman UK Data Service / Jisc Justin Hayes UK Data Service
Orien Ori t en a t tion a Webi W nar: ebi CPD Maps 2
 Orientation Webinar: CPD Maps 2 Agenda 1. Background - econ Planning Suite 2. Expanded Planning Data 3. CPD Maps Overview 4. Demonstration Guide Me Wizard Map Selection Identify Tool Printing and Saving
The World Bank Community Development Program Support Project-Phase III (P144637)
") Public Disclosure Authorized AFRICA Cameroon Social, Urban, Rural and Resilience Global Practice Global Practice IBRD/IDA Investment Project Financing FY 2016 Seq No: 5 ARCHIVED on 21-Dec-2017 ISR30226
Public Disclosure Authorized AFRICA Cameroon Social, Urban, Rural and Resilience Global Practice Global Practice IBRD/IDA Investment Project Financing FY 2016 Seq No: 5 ARCHIVED on 21-Dec-2017 ISR30226
Spatial and Socioeconomic Analysis of Commuting Patterns in Southern California Using LODES, CTPP, and ACS PUMS
 Spatial and Socioeconomic Analysis of Commuting Patterns in Southern California Using LODES, CTPP, and ACS PUMS Census for Transportation Planning Subcommittee meeting TRB 95th Annual Meeting January 11,
APPENDIX C-3 Equitable Target Areas (ETA) Technical Analysis Methodology
 Technical Analysis Methodology") APPENDIX C-3 Equitable Target Areas (ETA) Technical Analysis Methodology Contents Introduction... 1 ETA Index Methodology... 1 ETA Index Development... 1 Other EJ Measures... 4 The Limited English Proficiency
APPENDIX C-3 Equitable Target Areas (ETA) Technical Analysis Methodology Contents Introduction... 1 ETA Index Methodology... 1 ETA Index Development... 1 Other EJ Measures... 4 The Limited English Proficiency
Where to Invest Affordable Housing Dollars in Polk County?: A Spatial Analysis of Opportunity Areas
 Resilient Neighborhoods Technical Reports and White Papers Resilient Neighborhoods Initiative 6-2014 Where to Invest Affordable Housing Dollars in Polk County?: A Spatial Analysis of Opportunity Areas
Neighborhood social characteristics and chronic disease outcomes: does the geographic scale of neighborhood matter? Malia Jones
 Neighborhood social characteristics and chronic disease outcomes: does the geographic scale of neighborhood matter? Malia Jones Prepared for consideration for PAA 2013 Short Abstract Empirical research
How is Your Health? Using SAS Macros, ODS Graphics, and GIS Mapping to Monitor Neighborhood and Small-Area Health Outcomes
 Paper 3214-2015 How is Your Health? Using SAS Macros, ODS Graphics, and GIS Mapping to Monitor Neighborhood and Small-Area Health Outcomes Roshni Shah, Santa Clara County Public Health Department ABSTRACT
CRP 608 Winter 10 Class presentation February 04, Senior Research Associate Kirwan Institute for the Study of Race and Ethnicity
 CRP 608 Winter 10 Class presentation February 04, 2010 SAMIR GAMBHIR SAMIR GAMBHIR Senior Research Associate Kirwan Institute for the Study of Race and Ethnicity Background Kirwan Institute Our work Using
Rural Pennsylvania: Where Is It Anyway? A Compendium of the Definitions of Rural and Rationale for Their Use
 Rural Pennsylvania: Where Is It Anyway? A Compendium of the Definitions of Rural and Rationale for Their Use Pennsylvania Office of Rural Health 310 Nursing Sciences Building University Park, PA 16802
Geospatial Analysis of Job-Housing Mismatch Using ArcGIS and Python
 Geospatial Analysis of Job-Housing Mismatch Using ArcGIS and Python 2016 ESRI User Conference June 29, 2016 San Diego, CA Jung Seo, Frank Wen, Simon Choi and Tom Vo, Research & Analysis Southern California
Acknowledgments xiii Preface xv. GIS Tutorial 1 Introducing GIS and health applications 1. What is GIS? 2
 Acknowledgments xiii Preface xv GIS Tutorial 1 Introducing GIS and health applications 1 What is GIS? 2 Spatial data 2 Digital map infrastructure 4 Unique capabilities of GIS 5 Installing ArcView and the
Utilizing Data from American FactFinder with TIGER/Line Shapefiles in ArcGIS
 Utilizing Data from American FactFinder with TIGER/Line Shapefiles in ArcGIS Web Adams, GISP Data Dissemination Specialist U.S. Census Bureau New York Regional Office 1 What We Do Decennial Census Every
NEW YORK DEPARTMENT OF SANITATION. Spatial Analysis of Complaints
 NEW YORK DEPARTMENT OF SANITATION Spatial Analysis of Complaints Spatial Information Design Lab Columbia University Graduate School of Architecture, Planning and Preservation November 2007 Title New York
Understanding and accessing 2011 census aggregate data
 Understanding and accessing 2011 census aggregate data 4 July 11:00 to 16:00 BST Justin Hayes and Richard Wiseman UK Data Service Census Support UK censuses provide an unparalleled resource of high quality
Spring. The City of Pittsburgh and Allegheny County. Allegheny Valley Bank of Pittsburgh. NorthWest Savings Bank. First Commonwealth
 Allegheny Valley Bank of Pittsburgh Bank of America Bank of New York Mellon Citizens Bank Dollar Bank ESB Bank Fidelity Savings Bank Fifth Third Bank First Commonwealth Huntington Bank Iron and Glass Bank
Follow this and additional works at: Part of the Urban Studies Commons
 The College of Wooster Libraries Open Works Senior Independent Study Theses 2012 Does Spatial Mismatch Still Occur in 2010? An Examination of Race, Income and Urban Georgraphy in the Cleveland-Elyria-Mentor
GIS-Based Analysis of the Commuting Behavior and the Relationship between Commuting and Urban Form
 GIS-Based Analysis of the Commuting Behavior and the Relationship between Commuting and Urban Form 1. Abstract A prevailing view in the commuting is that commuting would reconstruct the urban form. By
Regression with a Binary Dependent Variable (SW Ch. 9)
") Regression with a Binary Dependent Variable (SW Ch. 9) So far the dependent variable (Y) has been continuous: district-wide average test score traffic fatality rate But we might want to understand the
Regression with a Binary Dependent Variable (SW Ch. 9) So far the dependent variable (Y) has been continuous: district-wide average test score traffic fatality rate But we might want to understand the
Online Robustness Appendix to Endogenous Gentrification and Housing Price Dynamics
 Online Robustness Appendix to Endogenous Gentrification and Housing Price Dynamics Robustness Appendix to Endogenous Gentrification and Housing Price Dynamics This robustness appendix provides a variety
BROOKINGS May
 Appendix 1. Technical Methodology This study combines detailed data on transit systems, demographics, and employment to determine the accessibility of jobs via transit within and across the country s 100
Technical Documentation Demostats april 2018
 Technical Documentation Demostats 2018 april 2018 what it is DemoStats is a database of estimates and projections for a comprehensive set of demographic and socioeconomic attributes about the Canadian
GIS Spatial Statistics for Public Opinion Survey Response Rates
 GIS Spatial Statistics for Public Opinion Survey Response Rates July 22, 2015 Timothy Michalowski Senior Statistical GIS Analyst Abt SRBI - New York, NY t.michalowski@srbi.com www.srbi.com Introduction
1Department of Demography and Organization Studies, University of Texas at San Antonio, One UTSA Circle, San Antonio, TX
 Well, it depends on where you're born: A practical application of geographically weighted regression to the study of infant mortality in the U.S. P. Johnelle Sparks and Corey S. Sparks 1 Introduction Infant
The Cost of Transportation : Spatial Analysis of US Fuel Prices
 The Cost of Transportation : Spatial Analysis of US Fuel Prices J. Raimbault 1,2, A. Bergeaud 3 juste.raimbault@polytechnique.edu 1 UMR CNRS 8504 Géographie-cités 2 UMR-T IFSTTAR 9403 LVMT 3 Paris School
Spatiotemporal Analysis of Commuting Patterns: Using ArcGIS and Big Data
 Spatiotemporal Analysis of Commuting Patterns: Using ArcGIS and Big Data 2017 ESRI User Conference July 13, 2017 San Diego, VA Jung Seo, Tom Vo, Frank Wen and Simon Choi Research & Analysis Southern California
A Comprehensive Method for Identifying Optimal Areas for Supermarket Development. TRF Policy Solutions April 28, 2011
 A Comprehensive Method for Identifying Optimal Areas for Supermarket Development TRF Policy Solutions April 28, 2011 Profile of TRF The Reinvestment Fund builds wealth and opportunity for lowwealth communities
ARIC Manuscript Proposal # PC Reviewed: _9/_25_/06 Status: A Priority: _2 SC Reviewed: _9/_25_/06 Status: A Priority: _2
 ARIC Manuscript Proposal # 1186 PC Reviewed: _9/_25_/06 Status: A Priority: _2 SC Reviewed: _9/_25_/06 Status: A Priority: _2 1.a. Full Title: Comparing Methods of Incorporating Spatial Correlation in
Data Matrix User Guide
 Data Matrix User Guide 1. Introduction The 2017 Data Matrix is designed to support the 2017 iteration of the Regional Skills Assessments (RSAs) in Scotland. The RSAs align with the Regional Outcome Agreement
An Introduction to China and US Map Library. Shuming Bao Spatial Data Center & China Data Center University of Michigan
 An Introduction to China and US Map Library Shuming Bao Spatial Data Center & China Data Center University of Michigan Current Spatial Data Services http://chinadataonline.org China Geo-Explorer http://chinageoexplorer.org
Life, Physical, and Social Science Occupations in Allegheny County
 Life, Physical, and Social Science Occupations in Allegheny County 2015-2025 1 Life, Physical, and Social Science Occupations Regions Code Description 42003 Allegheny County, PA Timeframe 2015-2025 Datarun
Tracey Farrigan Research Geographer USDA-Economic Research Service
 Rural Poverty Symposium Federal Reserve Bank of Atlanta December 2-3, 2013 Tracey Farrigan Research Geographer USDA-Economic Research Service Justification Increasing demand for sub-county analysis Policy
Public Disclosure Copy. Implementation Status & Results Report KH - Livelihood Enhancement and Association of the Poor Project (LEAP) (P153591)
 (P153591)") Public Disclosure Authorized EAST ASIA AND PACIFIC Cambodia Agriculture Global Practice IBRD/IDA Investment Project Financing FY 2017 Seq No: 1 ARCHIVED on 17-Jun-2017 ISR28362 Implementing Agencies: Ministry
Public Disclosure Authorized EAST ASIA AND PACIFIC Cambodia Agriculture Global Practice IBRD/IDA Investment Project Financing FY 2017 Seq No: 1 ARCHIVED on 17-Jun-2017 ISR28362 Implementing Agencies: Ministry
Globally Estimating the Population Characteristics of Small Geographic Areas. Tom Fitzwater
 Globally Estimating the Population Characteristics of Small Geographic Areas Tom Fitzwater U.S. Census Bureau Population Division What we know 2 Where do people live? Difficult to measure and quantify.
Urban Revival in America
 Urban Revival in America Victor Couture 1 Jessie Handbury 2 1 University of California, Berkeley 2 University of Pennsylvania and NBER May 2016 1 / 23 Objectives 1. Document the recent revival of America
Basic Training Battlemind to Home Symposium. Sept
 Basic Training Battlemind to Home Symposium Sept 2017 1 What is Measuring Communities? A social indicators project which allows users to obtain military-specific information about communities strengths
FHWA Planning Data Resources: Census Data Planning Products (CTPP) HEPGIS Interactive Mapping Portal
 HEPGIS Interactive Mapping Portal") FHWA Planning Data Resources: Census Data Planning Products (CTPP) HEPGIS Interactive Mapping Portal Jeremy Raw, P.E. FHWA, Office of Planning, Systems Planning and Analysis August 2017 Outline Census
FHWA Planning Data Resources: Census Data Planning Products (CTPP) HEPGIS Interactive Mapping Portal Jeremy Raw, P.E. FHWA, Office of Planning, Systems Planning and Analysis August 2017 Outline Census
2010 Census Data Release and Current Geographic Programs. Michaellyn Garcia Geographer Seattle Regional Census Center
 2010 Census Data Release and Current Geographic Programs Michaellyn Garcia Geographer Seattle Regional Census Center 2010 Center of Population Located approximately 2.7 miles northeast of Plato, Missouri
Applied Economics. Regression with a Binary Dependent Variable. Department of Economics Universidad Carlos III de Madrid
 Applied Economics Regression with a Binary Dependent Variable Department of Economics Universidad Carlos III de Madrid See Stock and Watson (chapter 11) 1 / 28 Binary Dependent Variables: What is Different?
CONSTRUCTING THE POVERTY AND OPPORTUNITIES/PUBLIC SERVICES MAPS INFORMATION MANAGEMENT. Background: Brazil Without Extreme Poverty Plan
 INFORMATION MANAGEMENT CONSTRUCTING THE POVERTY AND OPPORTUNITIES/PUBLIC SERVICES MAPS Background: Brazil Without Extreme Poverty Plan The Brazil Without Extreme Poverty Plan (BSM), designed to overcome
Land cover modeling in the Travis County
 Land cover modeling in the Travis County Contents Introduction.1 Data collection 3 Data pre-processing 6 Land cover modeling 12 Final considerations 13 Prepared for: GIS and Water Resources By Julie C
Exercise on Using Census Data UCSB, July 2006
 Exercise on Using Census Data UCSB, July 2006 Purpose The purpose of this lab is to become familiar with Census Bureau data. Second, we will learn how to join tables which allows you to add data to the
Using GIS to Explore the Relationship between Socioeconomic Status and Demographic Variables and Crime in Pittsburgh, Pennsylvania
 Using GIS to Explore the Relationship between Socioeconomic Status and Demographic Variables and Crime in Pittsburgh, Pennsylvania Stephen E. Mitchell Department of Resource Analysis, Saint Mary s University
DIFFERENT INFLUENCES OF SOCIOECONOMIC FACTORS ON THE HUNTING AND FISHING LICENSE SALES IN COOK COUNTY, IL
 DIFFERENT INFLUENCES OF SOCIOECONOMIC FACTORS ON THE HUNTING AND FISHING LICENSE SALES IN COOK COUNTY, IL Xiaohan Zhang and Craig Miller Illinois Natural History Survey University of Illinois at Urbana
The World Bank TOGO Community Development and Safety Nets Project (P127200)
") Public Disclosure Authorized AFRICA Togo Social Protection & Labor Global Practice IBRD/IDA Specific Investment Loan FY 2012 Seq No: 9 ARCHIVED on 16-Sep-2016 ISR25166 Implementing Agencies: Technical
Public Disclosure Authorized AFRICA Togo Social Protection & Labor Global Practice IBRD/IDA Specific Investment Loan FY 2012 Seq No: 9 ARCHIVED on 16-Sep-2016 ISR25166 Implementing Agencies: Technical
emerge Network: CERC Survey Survey Sampling Data Preparation
 emerge Network: CERC Survey Survey Sampling Data Preparation Overview The entire patient population does not use inpatient and outpatient clinic services at the same rate, nor are racial and ethnic subpopulations
VIDEO: The World In A Box: Geographic Information Systems
 Geographic Information Systems VIDEO: The World In A Box: Geographic Information Systems Adapted from: The World In A Box: Geographic Information Systems. A Public Television Documentary, Opticus Corporation:
emerge Network: CERC Survey Survey Sampling Data Preparation
 emerge Network: CERC Survey Survey Sampling Data Preparation Overview The entire patient population does not use inpatient and outpatient clinic services at the same rate, nor are racial and ethnic subpopulations
Making Our Cities Safer: A Study In Neighbhorhood Crime Patterns
 Making Our Cities Safer: A Study In Neighbhorhood Crime Patterns Aly Kane alykane@stanford.edu Ariel Sagalovsky asagalov@stanford.edu Abstract Equipped with an understanding of the factors that influence
Mapping Communities of Opportunity in New Orleans
 Mapping Communities of Opportunity in New Orleans December 11, 2009 Samir Gambhir Senior Research Associate Kirwan Institute for the study of Race and Ethnicity The Ohio State University Gambhir.2@osu.edu
Classification Exercise UCSB July 2006
 Classification Exercise UCSB July 2006 Purpose This exercise will examine how spatial data is catergorized and the advantages and disadvantages of different classification methods. Terms to know Population,
Developing Built Environment Indicators for Urban Oregon. Dan Rubado, MPH EPHT Epidemiologist Oregon Public Health Division
 Developing Built Environment Indicators for Urban Oregon Dan Rubado, MPH EPHT Epidemiologist Oregon Public Health Division What is the built environment? The built environment encompasses spaces and places
Public Disclosure Copy
 Public Disclosure Authorized MIDDLE EAST AND NORTH AFRICA Iraq Social, Urban, Rural and Resilience Global Practice Global Practice IBRD/IDA Investment Project Financing FY 2016 Seq No: 2 ARCHIVED on 27-May-2016
Analysis of Bank Branches in the Greater Los Angeles Region
 Analysis of Bank Branches in the Greater Los Angeles Region Brian Moore Introduction The Community Reinvestment Act, passed by Congress in 1977, was written to address redlining by financial institutions.
The World Bank Earthquake Housing Reconstruction Project (P155969)
") Public Disclosure Authorized SOUTH ASIA Nepal Social, Urban, Rural and Resilience Global Practice Global Practice IBRD/IDA Investment Project Financing FY 2015 Seq No: 1 ARCHIVED on 18-Nov-2015 ISR20331
Public Disclosure Authorized SOUTH ASIA Nepal Social, Urban, Rural and Resilience Global Practice Global Practice IBRD/IDA Investment Project Financing FY 2015 Seq No: 1 ARCHIVED on 18-Nov-2015 ISR20331
2014 Planning Database (PDB)
") 2014 Planning Database (PDB) November 19, 2014 Barbara O Hare, Nancy Bates, Julia Coombs, Travis Pape, Chandra Erdman Office of Survey Analytics 1 Overview Tract and Block Group PDBs Useful for: Identifying
2014 Planning Database (PDB) November 19, 2014 Barbara O Hare, Nancy Bates, Julia Coombs, Travis Pape, Chandra Erdman Office of Survey Analytics 1 Overview Tract and Block Group PDBs Useful for: Identifying
Gridded Population of the World Version 4 (GPWv4)
") Gridded Population of the World Version 4 (GPWv4) Greg Yetman Chris Small Erin Doxsey-Whitfield Kytt MacManus May 28, 2015 Global Urbanization Workshop http://sedac.ciesin.columbia.edu 1 Focus on applying
Gridded Population of the World Version 4 (GPWv4) Greg Yetman Chris Small Erin Doxsey-Whitfield Kytt MacManus May 28, 2015 Global Urbanization Workshop http://sedac.ciesin.columbia.edu 1 Focus on applying
Department of Statistics Malaysia
 Department of Statistics Malaysia 1 2 1 2 3 4 5 Introduction Geographic Information Systems (GIS) Geospatial activities for 2020 Modernisation Way Forward 3 Malaysia Population (Millions) Census 2010 2018
Propensity Score Analysis Using teffects in Stata. SOC 561 Programming for the Social Sciences Hyungjun Suh Apr
 Propensity Score Analysis Using teffects in Stata SOC 561 Programming for the Social Sciences Hyungjun Suh Apr. 25. 2016 Overview Motivation Propensity Score Weighting Propensity Score Matching with teffects
Kentucky HFA Performance Data Reporting- Borrower Characteristics
 Borrower Income ($) Above $90,000 0% 0% $70,000- $89,000 0% 0% $50,000- $69,000 0% 0% Below $50,000 0% 0% Borrower Income as Percent of Area Median Income (AMI) Above 120 110%-119 100%- 109 90%- 99 80%-
The World Bank Community Development Program Support Project-Phase III (P144637)
") Public Disclosure Authorized AFRICA Cameroon Social, Urban, Rural and Resilience Global Practice Global Practice IBRD/IDA Investment Project Financing FY 2016 Seq No: 6 ARCHIVED on 27-Jun-2018 ISR33107
Public Disclosure Authorized AFRICA Cameroon Social, Urban, Rural and Resilience Global Practice Global Practice IBRD/IDA Investment Project Financing FY 2016 Seq No: 6 ARCHIVED on 27-Jun-2018 ISR33107
Tuesday 6:30 9:30 (First/Last classes) Home Phone: SYLLABUS. I. Focus of Course
 Home Phone: SYLLABUS. I. Focus of Course") PSC 560-G Stephen Sherman GIS in Public Administration Political Science Dept. Summer, First Session, 2014 Work Phone: 373-4503 (Tue & Thur) Tuesday 6:30 9:30 (First/Last classes) Home Phone: 375-5328
PSC 560-G Stephen Sherman GIS in Public Administration Political Science Dept. Summer, First Session, 2014 Work Phone: 373-4503 (Tue & Thur) Tuesday 6:30 9:30 (First/Last classes) Home Phone: 375-5328
The World Bank Community Development Program Support Project-Phase III (P144637)
") Public Disclosure Authorized AFRICA Cameroon Social, Urban, Rural and Resilience Global Practice Global Practice IBRD/IDA Investment Project Financing FY 2016 Seq No: 4 ARCHIVED on 20-Jun-2017 ISR27942
Public Disclosure Authorized AFRICA Cameroon Social, Urban, Rural and Resilience Global Practice Global Practice IBRD/IDA Investment Project Financing FY 2016 Seq No: 4 ARCHIVED on 20-Jun-2017 ISR27942
MIDWEST INFRASTRUCTURE THE FEDERAL RESERVE BANK JUNE Understanding isolation and change in urban neighborhoods: A research symposium
 MIDWEST INFRASTRUCTURE THE FEDERAL RESERVE BANK JUNE 2003 OF CHICAGO NUMBER 190b Chicago Fed Letter Understanding isolation and change in urban neighborhoods: A research symposium by Richard Mattoon, senior
KING FAHD UNIVERSITY OF PETROLEUM & MINERALS
 KING FAHD UNIVERSITY OF PETROLEUM & MINERALS Department of City & Regional Planning Introduction To GIS (CRP 514) Identifying & Planning Public School Facility In California Using GIS Presented to Dr.
ESRI 2008 Health GIS Conference
 ESRI 2008 Health GIS Conference An Exploration of Geographically Weighted Regression on Spatial Non- Stationarity and Principal Component Extraction of Determinative Information from Robust Datasets A
Long Island Breast Cancer Study and the GIS-H (Health)
") Long Island Breast Cancer Study and the GIS-H (Health) Edward J. Trapido, Sc.D. Associate Director Epidemiology and Genetics Research Program, DCCPS/NCI COMPREHENSIVE APPROACHES TO CANCER CONTROL September,
Long Island Breast Cancer Study and the GIS-H (Health) Edward J. Trapido, Sc.D. Associate Director Epidemiology and Genetics Research Program, DCCPS/NCI COMPREHENSIVE APPROACHES TO CANCER CONTROL September,
Compact guides GISCO. Geographic information system of the Commission
 Compact guides GISCO Geographic information system of the Commission What is GISCO? GISCO, the Geographic Information System of the COmmission, is a permanent service of Eurostat that fulfils the requirements
Integrated Postsecondary Education Data System
 University of Nebraska Omaha DigitalCommons@UNO IPEDS Completions Integrated Postsecondary Education Data System 202 Completions 202-3 UNO Office of Institutional Effectiveness University of Nebraska at
GIS ADMINISTRATOR / WEB DEVELOPER EVANSVILLE-VANDERBURGH COUNTY AREA PLAN COMMISSION
 GIS ADMINISTRATOR / WEB DEVELOPER EVANSVILLE-VANDERBURGH COUNTY AREA PLAN COMMISSION SALARY RANGE INITIATION $43,277 SIX MONTHS $45,367 POSITION GRADE PAT VI The Evansville-Vanderburgh County Area Plan
Public Disclosure Copy
 Public Disclosure Authorized AFRICA Guinea Water Global Practice IBRD/IDA Investment Project Financing FY 2017 Seq No: 2 ARCHIVED on 14-Apr-2018 ISR31899 Implementing Agencies: Ministry of Energy and Hydraulics
PAMSIMAS Support Trust Fund (P116236)
") Public Disclosure Authorized EAST ASIA AND PACIFIC Indonesia Water Global Practice Recipient Executed Activities Specific Investment Loan FY 2010 Seq No: 8 ARCHIVED on 17-Dec-2015 ISR22003 Implementing
Public Disclosure Authorized EAST ASIA AND PACIFIC Indonesia Water Global Practice Recipient Executed Activities Specific Investment Loan FY 2010 Seq No: 8 ARCHIVED on 17-Dec-2015 ISR22003 Implementing
How GIS can be used for improvement of literacy and CE programmes
 How GIS can be used for improvement of literacy and CE programmes Training Workshop for Myanmar Literacy Resource Center (MLRC) ( Yangon, Myanmar, 11 20 October 2000 ) Presented by U THEIN HTUT GEOCOMP
Egypt Public DSS. the right of access to information. Mohamed Ramadan, Ph.D. [R&D Advisor to the president of CAPMAS]
![Egypt Public DSS. the right of access to information. Mohamed Ramadan, Ph.D. [R&D Advisor to the president of CAPMAS]](/thumbs/89/98483713.jpg "Egypt Public DSS. the right of access to information. Mohamed Ramadan, Ph.D. [R&D Advisor to the president of CAPMAS]") Egypt Public DSS ì the right of access to information Central Agency for Public Mobilization and Statistics Arab Republic of Egypt Mohamed Ramadan, Ph.D. [R&D Advisor to the president of CAPMAS] Egypt
Egypt Public DSS ì the right of access to information Central Agency for Public Mobilization and Statistics Arab Republic of Egypt Mohamed Ramadan, Ph.D. [R&D Advisor to the president of CAPMAS] Egypt
Mapping Social Vulnerability and Lyme Disease in Vermont
 Mapping Social Vulnerability and Lyme Disease in Vermont March 30, 2017, Dr. Joseph Holler Contact email: joseph@josephholler.com Website: www.josephholler.com This work is licensed under a Creative Commons