Land cover modeling in the Travis County
|
|
|
- Juliana Whitehead
- 6 years ago
- Views:
Transcription
1 Land cover modeling in the Travis County Contents Introduction.1 Data collection 3 Data pre-processing 6 Land cover modeling 12 Final considerations 13 Prepared for: GIS and Water Resources By Julie C Faure, December
2 Introduction In a lot of scientific papers, we can see that a correlation is made between land cover and population characteristics. It has been a preoccupation for several scientists for a few decades. This correlation is namely important for several environmental aspects. For example, land imperviousness that is induced by urbanization can have harmful impacts on water runoff, especially when it is combined to climate change problems. The conservation of this ratio can be essential to the equilibrium of the water resources of the area. For example Urich, Bach et al. [2015] studied the way that urbanization and climate change can affect the runoff of the city, and, by examining different scenarios, gave some ideas of the way the problem could be reduced. I am currently a research assistant and am studying the effect of population change in urban areas on water infrastructures and sanitation systems. So, my first idea for this final project was to find a correlation between changes in the structure of a city and its water supplies. To do so, I wanted to pick a city that is growing, and look at the population and infrastructure characteristics, to find a link between some of these characteristics and its water supplies. The Travis County was a good fit, as seen in figures 1 and 2. Figure 1: National Land Cover Database Percent Developed Imperviousness Change in Texas The red dots correspond to areas where the percent developed imperviousness changes between 2006 and The upper red zone corresponds to Austin and its agglomeration in which is located the Travis county


.")

3 Figure 2: National Land Cover Database Percent Developed Imperviousness Change in the Travis County Travis County This was actually a lot to do and I decided to focus on the effect of population and urban infrastructures on land cover characteristics of the area. Data collection Land cover data The land cover data I used were taken from the National Land Cover Database (NLCD). The available databases were 1992, 2001, 2006 and 2011 databases (it would then be interesting to use my model to predict the 2015 data for example). In these databases, I could find the land cover distribution in the Travis County, where each value corresponds to a land cover characteristic (e.g. highly urbanized, open water, ). This land cover reparation is represented on figure 3. 3
4 Figure 3: NLCD 2011 Land cover in the Travis County Travis County Land cover Value The red values correspond to the urbanized areas. I also found the percent imperviousness for each 30m*30m raster cell of the county, this value is the value I actually used for my model, because I assumed that this was the value I could actually model, using the population and urban infrastructure characteristics. Block Groups data A block group is small subdivision of a Census tract, which is a subdivision of a County. There are 220,000 census block groups in the United States I could download these block group polygon coordinates from the American Census Bureau. This gives a table like Table 1, and can be visualized on Figure 4. The unique number of each block group is the GeoID. For example, the first line of the previous Table 1 corresponds to the GeoID: : Texas 453: Travis County : Census tract 3: the block group number inside the census tract 4
, swisstopo, MapmyIndia, OpenStreetMap contributors, and the GIS User")
5 Table 1: Block Groups characteristics Figure 4 : Block groups in the Travis County Sources: Esri, HERE, DeLorme, Intermap, increment P Corp., GEBCO, USGS, FAO, NPS, NRCAN, GeoBase, IGN, Kadaster NL, Ordnance Survey, Esri Japan, METI, Esri China (Hong Kong), swisstopo, MapmyIndia, OpenStreetMap contributors, and the GIS User Community Block GroupsTravis County 5
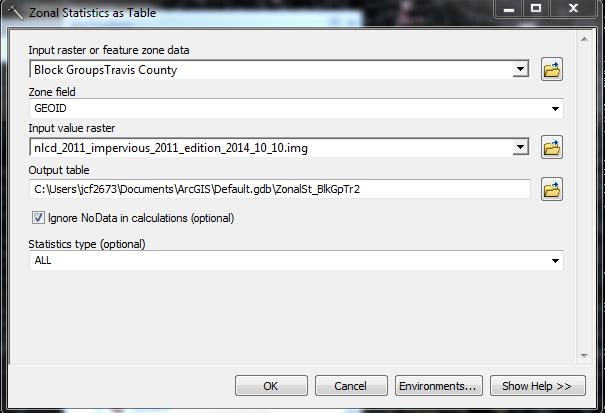
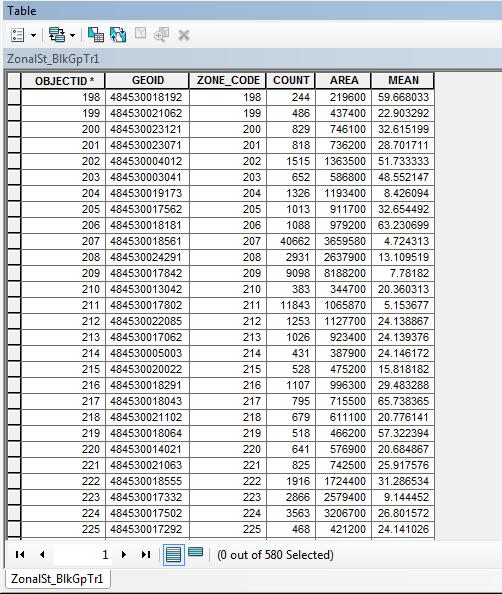
6 Population data The greatest source of data about population in the United States seems to be the American Community Survey from the American Census Bureau. The only American Community Survey data that are available on the Census Bureau website at a block group level are the 2013 and 2012 five years estimates. The reason is that a block group is so small that they need time to have enough population information to be precise. So I decided to build my land cover model for the Travis County using the 2011 National Land Cover Database and the American Community Survey 2013 five years estimates. I downloaded several different population characteristics for each Block Group from this database, for example: - total population - median household income - mean age - number of person per housing - number of housing units Data pre-processing To use all these data, I had to pre-process them. I mainly created a giant table in which each line corresponds to a block group, with all the interesting population and land cover characteristics. 1) I joined the interesting population data to Travis County Block groups 2) I used the Spatial Analysis tool Zonal statistics as Table to create a table that gives the mean percent imperviousness for each GeoID (i.e. for each Block Group). The two next pictures show the way I used the tool and the result. In the table, MEAN is the mean percent imperviousness for each block group. I could then obtain several maps (some of them are shown in Figure 5 to 8). And it enabled me to assume the population factors that were the most important for the percentage of imperviousness for each group. I finally assumed that the percentage of imperviousness in each block was a function of: - the total population per km 2 - the median income - the number of housings per km 2 6
7 7
8 Figure 5 : percent imperviousness in the Travis County Sources: Esri, HERE, DeLorme, Intermap, increment P Corp., GEBCO, USGS, FAO, NPS, NRCAN, GeoBase, IGN, Kadaster NL, Ordnance Survey, Esri Japan, METI, Esri China (Hong Kong), swisstopo, MapmyIndia, OpenStreetMap contributors, and the GIS User Community Block GroupsTravis County Mean Percent Imperviouness Value High : Low :
9 Figure 6 : population per km Sources: Esri, HERE, DeLorme, Intermap, increment P Corp., GEBCO, USGS, FAO, NPS, NRCAN, GeoBase, IGN, Kadaster NL, Ordnance Survey, Esri Japan, METI, Esri China (Hong Kong), swisstopo, MapmyIndia, OpenStreetMap contributors, and the GIS User Community Population per km
10 Figure 7: median annual household income Sources: Esri, HERE, DeLorme, Intermap, increment P Corp., GEBCO, USGS, FAO, NPS, NRCAN, GeoBase, IGN, Kadaster NL, Ordnance Survey, Esri Japan, METI, Esri China (Hong Kong), swisstopo, MapmyIndia, OpenStreetMap contributors, and the GIS User Community Median annual household income
11 Figure 8: Number of housings per km Sources: Esri, HERE, DeLorme, Intermap, increment P Corp., GEBCO, USGS, FAO, NPS, NRCAN, GeoBase, IGN, Kadaster NL, Ordnance Survey, Esri Japan, METI, Esri China (Hong Kong), swisstopo, MapmyIndia, OpenStreetMap contributors, and the GIS User Community Housing units per km


12 Land cover modeling After having obtain all these data and having chosen the parameters that I wanted to use to model the percent imperviousness in each block group, I could finally run my model. I first wanted to use the Geographically Weighted Regression tool from Spatial Statistics: mathematical model for 2011: Figure 9: illustration taken from Arcmap help and Geographically Weighted Regression tool I could then found a relation: b0 + b1*population per km 2 + b2* housing units per km 2 + b3*median annual income per housing = number of impervious cells But I did not manage to run this tool correctly since I always had a Background processing error. However, I used the solver after having exported the data, and the values that best fit for b0, b1, b2 and b3 are: b b b b
13 Final considerations By comparing the values that are theoretically found using my model, and the real values, I concluded that my model was coherent but not precise at all: there is a margin of error with this model of about 40%, which is a lot. To reduce this problem, I could try to use a more complex formula, or run this model for more counties. for example by adding the Bexar county that corresponds to the urbanized areas of San Antonio. 13
Streams in the Ranching Country of South Texas
 Streams in the Ranching Country of South Texas Watershed Analysis of HUC 12110207 Sandranell Moerbe CE GIS in Water Resources Fall 2015 INTRODUCTION This project investigates the portion of South Texas
1 foot of Sea Level Rise
 1 foot of Sea Level Rise Schools Fire Stations Law Enforcement u Hospitals 1ft SLR 0 0.125 0.25 0.5 Miles the 2013 study A Geological Perspective U.S. Mid-Atlantic Coast a probable threat expected by 2050.
1 foot of Sea Level Rise
 1 foot of Sea Level Rise Schools Fire Stations $+ Law Enforcement u Hospitals 1ft SLR 0 0.25 0.55 1.1 Miles $+ Year 20 Population: the 2013 study A Geological Perspective U.S. Mid-Atlantic Coast a probable
Mapping Hobbs State Park Spring 2015 Luke Dye Daryk Blackford
 Mapping Hobbs State Park Spring 2015 Luke Dye Daryk Blackford Introduction to Geographic Information Science Northwest Arkansas Community College Instructor Paul Lowrey Hobbs State Park-Conservation Area
HYDROGRAPHIC SURVEY. Mile 20 to Mile Station: to Channel to Harlingen ^ # * " Aids to Navigation
 Mile 2 to Mile 2. ' 2 1'N ' 1 1+ ' 2 + + + 1 1 + 2 1'N 1 2 1'N 1 1 + Authorized Depth: -ft. 1 1 + 2 1 1 1 1 Mapped by: modnmfp ' 1+ Scale: 1:, 1 1 of 1 1 Survey Date(s: 1 December 21 magery Date: October
IMAGE ANALYSIS MEASURING LANDSCAPE VEGETATION IN 1.3 MILLION PARCELS FOR OUTDOOR WATER BUDGETS
 IMAGE ANALYSIS MEASURING LANDSCAPE VEGETATION IN 1.3 MILLION PARCELS FOR OUTDOOR WATER BUDGETS Pete Vitt Santa Ana Watershed Project Authority (SAWPA) Doug Mende Statistical Research Inc. July 13, 2017
URP4273 FINAL PROJECT
 URP4273 FINAL PROJECT Demographic & Socio-Economic Profiles and US Populations in a Spatial Context relating to the 2016 Presidential Elections GROUP 4 Cara Walkover Gaby Placido Mark Rumenik Nicholas
2 Groundwater Basin Monitoring
 Zone 7 Water Agency 2 Groundwater Basin Monitoring Programs 2.1 Climatological Monitoring 2 Groundwater Basin Monitoring Programs This section describes Zone 7's Climatological Monitoring Program which
Laboratory Exercise - Temple-View Least- Cost Mountain Bike Trail
 Brigham Young University BYU ScholarsArchive Engineering Applications of GIS - Laboratory Exercises Civil and Environmental Engineering 2017 Laboratory Exercise - Temple-View Least- Cost Mountain Bike
Figure: 08. Proposed Lalor Paste Plant. Process Overview. Hudson Bay Mining and Smelting Co., Limited. Proposed Alteration of the Lalor Mine
 Last saved by: MAHEC (2016-12-02 ) Last Plotted: 2016-12-02 Project Management Initials: Designer: Checked: Approved: Filename: P:\60519517\900-CAD, GIS\920-929 (GIS-GRAPHICS)\H\60519517-FIG-08-0000-H-PROCESSESCOCETRATOR.DWG
Work Conducted in August 2018
 Kelly Nieforth Economic Development Manager City of Oshkosh 215 Church Avenue Oshkosh, W 54903 August 31, 2018 RE: Update #9: August 1 to 31, 2018 Archaeological Data Recovery at the Golf Course Site (47WN0049)
Connec&ng phosphorus loads to cyanobacteria biomass using the Western Lake Erie Ecosystem Model
 Connec&ng phosphorus loads to cyanobacteria biomass using the Western Lake Erie Ecosystem Model John F. Bra?on Edward M. Verhamme, Todd M. Redder, Derek A. Schlea, Jeremy Grush, and Joseph DePinto Western
2 Precipitation and Evaporation
 Zone 7 Water Agency 2.1 Program Description 2 Precipitation and Evaporation This section describes Zone 7's Climatological Monitoring Program which tracks rainfall and evaporation in the Valley. Zone 7
BUNCOMBE COUNTY NORTH CAROLINA
 PROJECT SITE ² 0 0. 75 1. 5 LOCATION MAP MARCH 2018 2. 25 3 Mil es AID: PROJECT # 2018-01122 18.05301 Sheet 1 of 7 Sources: Esri, HERE, DeLorme, USGS, Intermap, INCREMENT P, NRCan, Esri Japan, METI, Esri
FIGURE 2. Alborn Township Ness Township. Alborn Township. Ness Township. USGS Topographic Map
 Barr Footer: ArcIS 1.4, 216-1-24 1:1 File: I:\Client\Minntac\Work_Orders\Pit_Extension\Maps\Reports\Spider_Creek\Maps\EAW\Final Figures\Figure 1 Map.mxd User: MAK3 RainyRiver ^_ Spider Creek Restoration
NWP /1: Murphy Company (Wetlands Adjacent to Amazon Creek)
") NWP-2010-536/1: Murphy Company (Wetlands Adjacent to Amazon Creek) NWP-2010-536/1 Page 1 of 12 ENCL 0 0.25 0.5 1 Miles Scale: 1:24,000 #* t Sources: Esri, DeLorme, NAVTEQ, TomTom, ntermap, increment P
NWP-2010-536/1: Murphy Company (Wetlands Adjacent to Amazon Creek) NWP-2010-536/1 Page 1 of 12 ENCL 0 0.25 0.5 1 Miles Scale: 1:24,000 #* t Sources: Esri, DeLorme, NAVTEQ, TomTom, ntermap, increment P
ARCHAEOLOGICAL PLANNING STUDY FOR THE LAKESHORE MUNICIPAL GOLF COURSE, CITY OF OSHKOSH, WINNEBAGO COUNTY, WISCONSIN
 ARCHAEOLOGICAL PLANNING STUDY FOR THE LAKESHORE MUNICIPAL GOLF COURSE, CITY OF OSHKOSH, WINNEBAGO COUNTY, WISCONSIN By: Jennifer R. Haas, Seth A. Schneider, and Rachael A. Schultz University of Wisconsin-Milwaukee
Mortality Searches. February 7, Mr. Chris Veinot, EIT Development Engineer Natural Forces 1801 Hollis Street Suite 1205 Halifax, NS B3J 3N4
 February 7, 2017 Mr. Chris Veinot, EIT Development Engineer Natural Forces 1801 Hollis Street Suite 1205 Halifax, NS B3J 3N4 Dear Andy MacCallum Re: Summary of 2016 Monitoring at At the request of Natural
Natural and Human Influences on Flood Zones in Wake County. Georgia Ditmore
 Natural and Human Influences on Flood Zones in Wake County Georgia Ditmore Prepared for GEOG 591 December 5, 2014 2 Table of Contents Introduction.3 Objectives...5 Methods...6 Conclusion.11 References
Role of City Texture in Urban Heat Islands at Night Time
 Role of City Texture in Urban Heat Islands at Night Time J.M. Sobstyl, 1 T. Emig,, M.J. Abdolhosseini Qomi, F.-J. Ulm, 1, 1,, 5, and R. J.-M. Pellenq 1 Concrete Sustainability Hub, Department of Civil
Introducing GIS analysis
 1 Introducing GIS analysis GIS analysis lets you see patterns and relationships in your geographic data. The results of your analysis will give you insight into a place, help you focus your actions, or
Exercise on Using Census Data UCSB, July 2006
 Exercise on Using Census Data UCSB, July 2006 Purpose The purpose of this lab is to become familiar with Census Bureau data. Second, we will learn how to join tables which allows you to add data to the
Hennepin GIS. Tree Planting Priority Areas - Analysis Methodology. GIS Services April 2018 GOAL:
 Hennepin GIS GIS Services April 2018 Tree Planting Priority Areas - Analysis Methodology GOAL: To create a GIS data layer that will aid Hennepin County Environment & Energy staff in determining where to
Leon Creek Watershed October 17-18, 1998 Rainfall Analysis Examination of USGS Gauge Helotes Creek at Helotes, Texas
 Leon Creek Watershed October 17-18, 1998 Rainfall Analysis Examination of USGS Gauge 8181400 Helotes Creek at Helotes, Texas Terrance Jackson MSCE Candidate University of Texas San Antonio Abstract The
A GIS-based Approach to Watershed Analysis in Texas Author: Allison Guettner
 Texas A&M University Zachry Department of Civil Engineering CVEN 658 Civil Engineering Applications of GIS Instructor: Dr. Francisco Olivera A GIS-based Approach to Watershed Analysis in Texas Author:
Techniques for Science Teachers: Using GIS in Science Classrooms.
 Techniques for Science Teachers: Using GIS in Science Classrooms. After ESRI, 2008 GIS A Geographic Information System A collection of computer hardware, software, and geographic data used together for
Chapter 6. Fundamentals of GIS-Based Data Analysis for Decision Support. Table 6.1. Spatial Data Transformations by Geospatial Data Types
 Chapter 6 Fundamentals of GIS-Based Data Analysis for Decision Support FROM: Points Lines Polygons Fields Table 6.1. Spatial Data Transformations by Geospatial Data Types TO: Points Lines Polygons Fields
KENTUCKY HAZARD MITIGATION PLAN RISK ASSESSMENT
 KENTUCKY HAZARD MITIGATION PLAN RISK ASSESSMENT Presentation Outline Development of the 2013 State Hazard Mitigation Plan Risk Assessment Determining risk assessment scale Census Data Aggregation Levels
Presented at ESRI Education User Conference, July 6-8, 2001, San Diego, CA
 Presented at ESRI Education User Conference, July 6-8, 2001, San Diego, CA Irina V. Sharkova, Ph.D., Research Assistant Professor Richard Lycan, Ph.D., Senior Research Associate Population Research Center
Acknowledgments xiii Preface xv. GIS Tutorial 1 Introducing GIS and health applications 1. What is GIS? 2
 Acknowledgments xiii Preface xv GIS Tutorial 1 Introducing GIS and health applications 1 What is GIS? 2 Spatial data 2 Digital map infrastructure 4 Unique capabilities of GIS 5 Installing ArcView and the
GIS Lecture 5: Spatial Data
 GIS Lecture 5: Spatial Data GIS 1 Outline Vector Data Formats Raster Data Formats Map Projections Coordinate Systems US Census geographic files US Census data files GIS Data Sources GIS 2 Vector Data Formats
Evaluating access to jobs via transit from disparate neighborhoods
 Evaluating access to jobs via transit from disparate neighborhoods Clifford Kaplan GIS for Water Resources 2014, Term Project Burnet Corridor Manor Corridor Burnet Corridor Legend CapMetro bus lines Manor
Modeling the Rural Urban Interface in the South Carolina Piedmont: T. Stephen Eddins Lawrence Gering Jeff Hazelton Molly Espey
 Modeling the Rural Urban Interface in the South Carolina Piedmont: T. Stephen Eddins (teddins@clemson.edu) Lawrence Gering Jeff Hazelton Molly Espey ABSTRACT Continuing growth of America s cities has created
Utilizing Data from American FactFinder with TIGER/Line Shapefiles in ArcGIS
 Utilizing Data from American FactFinder with TIGER/Line Shapefiles in ArcGIS Web Adams, GISP Data Dissemination Specialist U.S. Census Bureau New York Regional Office 1 What We Do Decennial Census Every
Visual Studies Exercise, Assignment 07 (Architectural Paleontology) Geographic Information Systems (GIS), Part II
 Geographic Information Systems (GIS), Part II") ARCH1291 Visual Studies II Week 8, Spring 2013 Assignment 7 GIS I Prof. Alihan Polat Visual Studies Exercise, Assignment 07 (Architectural Paleontology) Geographic Information Systems (GIS), Part II Medium:
ARCH1291 Visual Studies II Week 8, Spring 2013 Assignment 7 GIS I Prof. Alihan Polat Visual Studies Exercise, Assignment 07 (Architectural Paleontology) Geographic Information Systems (GIS), Part II Medium:
2 Precipitation and Evaporation
 Zone 7 Water Agency 2.1 Program Description 2 Precipitation and Evaporation 2.1.1 Program Description This section describes Zone 7's Climatological Monitoring Program which tracks rainfall and evaporation
Land Cover Data Processing Land cover data source Description and documentation Download Use Use
 Land Cover Data Processing This document provides a step by step procedure on how to build the land cover data required by EnSim. The steps provided here my be long and there may be short cuts (like using
Development and Land Use Change in the Central Potomac River Watershed. Rebecca Posa. GIS for Water Resources, Fall 2014 University of Texas
 Development and Land Use Change in the Central Potomac River Watershed Rebecca Posa GIS for Water Resources, Fall 2014 University of Texas December 5, 2014 Table of Contents I. Introduction and Motivation..4
Yavapai County Flood Control District. Prescott Valley Mapping Activity Statement Activities (Zone A Floodplain Delineation and Base Map Updates)
") Yavapai County Flood Control District Prescott Valley Mapping Activity Statement Activities (Zone A Floodplain Delineation and Base Map Updates) Scope of ork Prepar by: October 2014 Scope of ork TABLE
Yavapai County Flood Control District Prescott Valley Mapping Activity Statement Activities (Zone A Floodplain Delineation and Base Map Updates) Scope of ork Prepar by: October 2014 Scope of ork TABLE
How GIS based Visualizations Support Land Use and Transportation Modeling
 How GIS based Visualizations Support Land Use and Transportation Modeling ESRI International Users Conference San Diego, CA - July 23, 2015 Prepared by: Troy Hightower Introduction This presentation will
Diplomacy on the Yarmouk, the Jordan River s forgotten tributary. Insight from satellite imagery into Yarmouk groundwater and rivers
 Diplomacy on the Yarmouk, the Jordan River s forgotten tributary Insight from satellite imagery into Yarmouk groundwater and rivers Yarmouk River Jabal Ash Shaykh Raqqad Al Qaly'a Largest tributary of
Visualization of Origin- Destination Commuter Flow Using CTPP Data and ArcGIS
 Visualization of Origin- Destination Commuter Flow Using CTPP Data and ArcGIS Research & Analysis Department Southern California Association of Governments 2015 ESRI User Conference l July 23, 2015 l San
Title: ArcMap: Calculating Soil Areas for Storm Water Pollution Prevention Plans Authors: Brandy Woodcock, Benjamin Byars
 Title: ArcMap: Calculating Soil Areas for Storm Water Pollution Prevention Plans Authors: Brandy Woodcock, Benjamin Byars Introduction Abstract: The use of ArcMap to calculate soil areas for storm water
ARCHAEOLOGICAL ASSESSMENT BOUNDARY ROAD SITE 9.0 MAPS. February 6, 2013 Report No /4500/
 ARCHAEOLOGICAL ASSESSMENT BOUNDARY ROAD SITE 90 MAPS February 6, 2013 Report No 12-1125-0045/4500/0160-2 22 MCNEELY RD BEARBROOK Path: \\goldergds\gal\ottawa\active\spatial_im\miller_paving_ltd\crrrc\gis\mxds\12-1125-0045\reporting\phase4000\tsd1\1211250045-4000-0160-boundaryrd-01mxd
Geodatabase for Sustainable Urban Development. Presented By Rhonda Maronn Maurice Johns Daniel Ashney Jack Anliker
 Geodatabase for Sustainable Urban Development Presented By Rhonda Maronn Maurice Johns Daniel Ashney Jack Anliker Objective Build a Geodatabase that will enable urban planners to create and assess the
Seattle/Shoreline. Shoreline. Seattle. Please answer our "Your Thoughts" questions
 Shoreline SCTION SCTION A 5 ST 5 5 5 AV 5 AV Y I- 5 F 5 AV O A YN Seattle/Shoreline 5 ST 5 5 ST.5 Sources: sri, HR, Garmin, USGS, Intermap, INCRMNT P, NRCan, sri Japan, MTI, sri China (Hong Kong), sri
Mule Shoe Bar Beck Ranch
 Mule Shoe Bar Beck Ranch All contiguous combination pivot irrigated and rangeland consisting of 7,908 acres Property Highlights List Price $4,927,263 Location The historic Mule Shoe Bar Ranches are located
HEC & GIS Modeling of the Brushy Creek HEC & GIS Watershed Modeling of the
 HEC & GIS Modeling of the Brushy Creek HEC & GIS Watershed Modeling of the By Cassandra Fagan 5, December 2014 http://ubcwatershedstudy.ursokr.com/images/ Contents Introduction... 3 Figure 1: 24-hour rainfall
Census Transportation Planning Products (CTPP)
") Census Transportation Planning Products (CTPP) Penelope Weinberger CTPP Program Manager - AASHTO September 15, 2010 1 What is the CTPP Program Today? The CTPP is an umbrella program of data products, custom
Census Transportation Planning Products (CTPP) Penelope Weinberger CTPP Program Manager - AASHTO September 15, 2010 1 What is the CTPP Program Today? The CTPP is an umbrella program of data products, custom
Geospatial Analysis of Job-Housing Mismatch Using ArcGIS and Python
 Geospatial Analysis of Job-Housing Mismatch Using ArcGIS and Python 2016 ESRI User Conference June 29, 2016 San Diego, CA Jung Seo, Frank Wen, Simon Choi and Tom Vo, Research & Analysis Southern California
Final Group Project Paper. Where Should I Move: The Big Apple or The Lone Star State
 Final Group Project Paper Where Should I Move: The Big Apple or The Lone Star State By: Nathan Binder, Shannon Scolforo, Kristina Conste, Madison Quinones Main Goal: Determine whether New York or Texas
Lecture 1 Introduction to GIS. Dr. Zhang Spring, 2017
 Lecture 1 Introduction to GIS Dr. Zhang Spring, 2017 Topics of the course Using and making maps Navigating GIS Map design Working with spatial data Geoprocessing Spatial data infrastructure Digitizing
Institutional Research with Public Data and Open Source Software
 2017 Institutional Research with Public Data and Open Source Software DUE1304591, 1644409, 1700496 Opinions expressed are those of the authors and not necessarily those of the National Science Foundation.
GIS 520 Data Cardinality. Joining Tabular Data to Spatial Data in ArcGIS
 GIS 520 Data Cardinality Joining Tabular Data to Spatial Data in ArcGIS Joining Tabular Data to Spatial Data in ArcGIS Outline Working with Zip Code Data Data Cardinality Issues Exploring Data Format Requirements
Geospatial Assessment in Support of Urban & Community Forestry Programs
 Geospatial Assessment in Support of Urban & Community Forestry Programs Funded by the USDA Forest Service, State and Private Forestry, under Cooperative Agreement # 06-CA-112244225-338 with the University
Geographic Systems and Analysis
 Geographic Systems and Analysis New York University Robert F. Wagner Graduate School of Public Service Instructor Stephanie Rosoff Contact: stephanie.rosoff@nyu.edu Office hours: Mondays by appointment
Summary of Available Datasets that are Relevant to Flood Risk Characterization
 Inter-Agency Characterization Workshop February 25-27, 2014 USACE Institute for Water Resources, Alexandria, VA, IWR Classroom Summary of Available Datasets that are Relevant to Characterization National
Praveen Subramani December 7, 2008 Athena: praveens Final Project: Placing a New Upscale Restaurant in Suffolk County, MA
 11.188 Final Project: Placing a New Upscale Restaurant in Suffolk County, MA Abstract According to an August 2008 New York Times article, over 60% of new restaurants, delis, and food shops close within
Big-Geo-Data EHR Infrastructure Development for On-Demand Analytics
 Big-Geo-Data EHR Infrastructure Development for On-Demand Analytics Sohayla Pruitt, MA Senior Geospatial Scientist Duke Medicine DUHS DHTS EIM HIRS Page 1 Institute of Medicine, World Health Organization,
WATER RESOURCES AND URBANIZATION Vulnerability and Adaptation in the Context of Climate Variability
 WATER RESOURCES AND URBANIZATION Vulnerability and Adaptation in the Context of Climate Variability Krishna Balakrishnan LA 221: Class Project Problem Statement My PhD research focuses on the vulnerability
Spatial Variation in Local Road Pedestrian and Bicycle Crashes
 2015 Esri International User Conference July 20 24, 2015 San Diego, California Spatial Variation in Local Road Pedestrian and Bicycle Crashes Musinguzi, Abram, Graduate Research Assistant Chimba,Deo, PhD.,
Spatiotemporal Analysis of Commuting Patterns: Using ArcGIS and Big Data
 Spatiotemporal Analysis of Commuting Patterns: Using ArcGIS and Big Data 2017 ESRI User Conference July 13, 2017 San Diego, VA Jung Seo, Tom Vo, Frank Wen and Simon Choi Research & Analysis Southern California
Abstract: Contents. Literature review. 2 Methodology.. 2 Applications, results and discussion.. 2 Conclusions 12. Introduction
 Abstract: Landfill is one of the primary methods for municipal solid waste disposal. In order to reduce the environmental damage and to protect the public health and welfare, choosing the site for landfill
Evaluation of Methods for Aerodynamic Roughness Length Retrieval from Very High-Resolution Imaging LIDAR Observations over the Heihe Basin in China
 remote sensing Article Evaluation of Methods for Aerodynamic Roughness Length Retrieval from Very High-Resolution Imaging LIDAR Observations over the Heihe Basin in China Robin Faivre 1,2, *, Jérôme Colin
Analysis of Change in Land Use around Future Core Transit Corridors: Austin, TX, Eric Porter May 3, 2012
 Analysis of Change in Land Use around Future Core Transit Corridors: Austin, TX, 1990-2006 PROBLEM DEFINITION Eric Porter May 3, 2012 This study examines the change in land use from 1990 to 2006 in the
Plastic debris in 29 Great Lakes tributaries: Relations to watershed attributes and hydrology
 Plastic debris in 29 Great Lakes tributaries: Relations to watershed attributes and hydrology Supporting Information Austin K. Baldwin a, *, Steven R. Corsi a, Sherri A. Mason b a U.S. Geological Survey,
Where to Invest Affordable Housing Dollars in Polk County?: A Spatial Analysis of Opportunity Areas
 Resilient Neighborhoods Technical Reports and White Papers Resilient Neighborhoods Initiative 6-2014 Where to Invest Affordable Housing Dollars in Polk County?: A Spatial Analysis of Opportunity Areas
Tsunami Simulations after the Mw7.5 78km N of Palu, Indonesia September 28, 2018
 Tsunami Simulations after the Mw7.5 78km N of Palu, Indonesia September 28, 2018 Luisa Urra, Erick Mas, Luis Moya, Shunichi Koshimura LABORATORY OF REMOTE SENSING AND GEOINFORMATICS FOR DISASTER MANAGEMENT
GED 554 IT & GIS. Lecture 6 Exercise 5. May 10, 2013
 GED 554 IT & GIS Lecture 6 Exercise 5 May 10, 2013 Free GIS data sources ******************* Mapping numerical data & Symbolization ******************* Exercise: Making maps for presentation GIS DATA SOFTWARE
In this exercise we will learn how to use the analysis tools in ArcGIS with vector and raster data to further examine potential building sites.
 GIS Level 2 In the Introduction to GIS workshop we filtered data and visually examined it to determine where to potentially build a new mixed use facility. In order to get a low interest loan, the building
LandScan Global Population Database
 LandScan Global Population Database The World s Finest Population Distribution Data Uncommon information. Extraordinary places. LandScan Global Population Database East View Cartographic is now offering
GIS ADMINISTRATOR / WEB DEVELOPER EVANSVILLE-VANDERBURGH COUNTY AREA PLAN COMMISSION
 GIS ADMINISTRATOR / WEB DEVELOPER EVANSVILLE-VANDERBURGH COUNTY AREA PLAN COMMISSION SALARY RANGE INITIATION $43,277 SIX MONTHS $45,367 POSITION GRADE PAT VI The Evansville-Vanderburgh County Area Plan
GIS Semester Project Working With Water Well Data in Irion County, Texas
 GIS Semester Project Working With Water Well Data in Irion County, Texas Grant Hawkins Question for the Project Upon picking a random point in Irion county, Texas, to what depth would I have to drill a
Administrative Data Research Facility Linked HMDA and ACS Database
 University of Pennsylvania ScholarlyCommons 2017 ADRF Network Research Conference Presentations ADRF Network Research Conference Presentations 11-2017 Administrative Data Research Facility Linked HMDA
The Attractive Side of Corpus Christi: A Study of the City s Downtown Economic Growth
 The Attractive Side of Corpus Christi: A Study of the City s Downtown Economic Growth GISC PROJECT DR. LUCY HUANG SPRING 2012 DIONNE BRYANT Introduction Background As a GIS Intern working with the City
4. GIS Implementation of the TxDOT Hydrology Extensions
 4. GIS Implementation of the TxDOT Hydrology Extensions A Geographic Information System (GIS) is a computer-assisted system for the capture, storage, retrieval, analysis and display of spatial data. It
Working with Census 2000 Data from MassGIS
 Tufts University GIS Tutorial Working with Census 2000 Data from MassGIS Revised September 26, 2007 Overview In this tutorial, you will use pre-processed census data from Massachusetts to create maps of
Spatial and Socioeconomic Analysis of Commuting Patterns in Southern California Using LODES, CTPP, and ACS PUMS
 Spatial and Socioeconomic Analysis of Commuting Patterns in Southern California Using LODES, CTPP, and ACS PUMS Census for Transportation Planning Subcommittee meeting TRB 95th Annual Meeting January 11,
Visualization of Commuter Flow Using CTPP Data and GIS
 Visualization of Commuter Flow Using CTPP Data and GIS Research & Analysis Department Southern California Association of Governments 2015 ESRI User Conference l July 23, 2015 l San Diego, CA Jung Seo,
H. R heading to fund the award and oversight by the Administrator of grants made under this heading. FEDERAL HIGHWAY ADMINISTRATION
 H. R. 1 92 heading to fund the award and oversight by the Administrator of grants made under this heading. FEDERAL HIGHWAY ADMINISTRATION HIGHWAY INFRASTRUCTURE INVESTMENT For an additional amount for
Introduction To Raster Based GIS Dr. Zhang GISC 1421 Fall 2016, 10/19
 Introduction To Raster Based GIS Dr. Zhang GISC 1421 Fall 2016, 10/19 Model of the course Using and making maps Navigating GIS maps Map design Working with spatial data Geoprocessing Spatial data infrastructure
Software requirements * :
 Title: Product Type: Developer: Target audience: Format: Software requirements * : Using GRACE to evaluate change in Greenland s ice sheet Part I: Download, import and map GRACE data Part II: View and
CITY OF RIVERSIDE USING HAZUS TO CREATE A EARTHQUAKE PLANNING GUIDE FOR A UNIFIED FIELD RESPONSE
 CITY OF RIVERSIDE USING HAZUS TO CREATE A EARTHQUAKE PLANNING GUIDE FOR A UNIFIED FIELD RESPONSE Presented by the Phil McCormick City of Riverside Office of Emergency Management HISTORY The City had several
Regional GIS Presentation for Small and Large Jurisdictions. Michelle E. Fults GIS Manager January 8, 2009
 Regional GIS Presentation for Small and Large Jurisdictions Michelle E. Fults GIS Manager January 8, 2009 Presentation Contributions from Juston Manville Henrico County Kevin Nelson Hanover County Mark
PALS: Neighborhood Identification, City of Frederick, Maryland. David Boston Razia Choudhry Chris Davis Under the supervision of Chao Liu
 PALS: Neighborhood Identification, City of Frederick, Maryland David Boston Razia Choudhry Chris Davis Under the supervision of Chao Liu University of Maryland School of Architecture, Planning & Preservation
Spatiotemporal Analysis of Commuting Patterns in Southern California Using ACS PUMS, CTPP and LODES
 Spatiotemporal Analysis of Commuting Patterns in Southern California Using ACS PUMS, CTPP and LODES 2017 ACS Data Users Conference May 11-12, 2017 Alexandria, VA Jung Seo, Tom Vo, Frank Wen and Simon Choi
CHANGES IN ETHNIC GEOGRAPHY IN WATERBURY AS A RESULT OF NATURAL DISASTERS AND URBAN RENEWAL
 G-1302: GIS and Environmental Modeling Final Project Report December 4, 2012 Student: David Perrier Instructor: Tatiana Serebriakova, Ph.D. CHANGES IN ETHNIC GEOGRAPHY IN WATERBURY AS A RESULT OF NATURAL
ISAT: NEMO: Nonpoint Education for Municipal Officials. Impervious Surface Analysis Tool. Nonpoint Education for Municipal Officials
 ISAT: Analysis Tool NOAA Coastal Services Center University of Connecticut NEMO Project NEMO: Nonpoint Education for Municipal Officials Mission: An educational program for local land use officials that
Dr Arulsivanathan Naidoo Statistics South Africa 18 October 2017
 ESRI User Conference 2017 Space Time Pattern Mining Analysis of Matric Pass Rates in Cape Town Schools Dr Arulsivanathan Naidoo Statistics South Africa 18 October 2017 Choose one of the following Leadership
P l a t e F t. S h e r i d a n P r o j e c t A r e a
 P l a t e 0 1 - F t. S h e r i d a n P r o j e c t A r e a McCormick Ravine Janes Ravine The Ft. Sheridan Section 506 study area consists of eight (8) mature ravines, (1) immature ravine (MacArthur) and
User Guide. Affirmatively Furthering Fair Housing Data and Mapping Tool. U.S. Department of Housing and Urban Development
 User Guide Affirmatively Furthering Fair Housing Data and Mapping Tool U.S. Department of Housing and Urban Development December, 2015 1 Table of Contents 1. Getting Started... 5 1.1 Software Version...
Location Suitability Analysis
 2010 Fall 406 Final Project Location Suitability Analysis New Burger stores in San Fernando Valley Presenter: Rich Lee I. Introduction In-N-Out Burger is famous in South West America. Established in 1948
BROOKINGS May
 Appendix 1. Technical Methodology This study combines detailed data on transit systems, demographics, and employment to determine the accessibility of jobs via transit within and across the country s 100
What are the five components of a GIS? A typically GIS consists of five elements: - Hardware, Software, Data, People and Procedures (Work Flows)
") LECTURE 1 - INTRODUCTION TO GIS Section I - GIS versus GPS What is a geographic information system (GIS)? GIS can be defined as a computerized application that combines an interactive map with a database
LECTURE 1 - INTRODUCTION TO GIS Section I - GIS versus GPS What is a geographic information system (GIS)? GIS can be defined as a computerized application that combines an interactive map with a database
Tracey Farrigan Research Geographer USDA-Economic Research Service
 Rural Poverty Symposium Federal Reserve Bank of Atlanta December 2-3, 2013 Tracey Farrigan Research Geographer USDA-Economic Research Service Justification Increasing demand for sub-county analysis Policy
Intro to GIS In Review
 Intro to GIS In Review GIS Analysis Winter 2016 GIS A quarter in review Geographic data types Acquiring GIS data Projections / Coordinate systems Working with attribute tables Data classification Map design
GIS for ChEs Introduction to Geographic Information Systems
 GIS for ChEs Introduction to Geographic Information Systems AIChE Webinar John Cirucci 1 GIS for ChEs Introduction to Geographic Information Systems What is GIS? Tools and Methods Applications Examples
Analyzing Suitability of Land for Affordable Housing
 Analyzing Suitability of Land for Affordable Housing Vern C. Svatos Jarrod S. Doucette Abstract: This paper explains the use of a geographic information system (GIS) to distinguish areas that might have
Write a report (6-7 pages, double space) on some examples of Internet Applications. You can choose only ONE of the following application areas:
 on some examples of Internet Applications. You can choose only ONE of the following application areas:") UPR 6905 Internet GIS Homework 1 Yong Hong Guo September 9, 2008 Write a report (6-7 pages, double space) on some examples of Internet Applications. You can choose only ONE of the following application
UPR 6905 Internet GIS Homework 1 Yong Hong Guo September 9, 2008 Write a report (6-7 pages, double space) on some examples of Internet Applications. You can choose only ONE of the following application
Under a New Halo: Site Suitability Study for the Hypothetical Relocation of Angel Stadium. Jerry P. Magaña
 Under a New Halo: Site Suitability Study for the Hypothetical Relocation of Angel Stadium Jerry P. Magaña About me Relatively new to GIS and an honor to present at the 2017 UC Received Certificate in GIS