Laboratory Exercise - Temple-View Least- Cost Mountain Bike Trail
|
|
|
- William Lang
- 5 years ago
- Views:
Transcription

. Engineering Applications of GIS - Laboratory Exercises. 2. https://scholarsarchive.byu.")
1 Brigham Young University BYU ScholarsArchive Engineering Applications of GIS - Laboratory Exercises Civil and Environmental Engineering 2017 Laboratory Exercise - Temple-View Least- Cost Mountain Bike Trail Brad Wells Jacob Wilcock Follow this and additional works at: Part of the Civil Engineering Commons, and the Geographic Information Sciences Commons Recommended Citation Wells, Brad and Wilcock, Jacob, "Laboratory Exercise - Temple-View Least- Cost Mountain Bike Trail" (2017). Engineering Applications of GIS - Laboratory Exercises This Article is brought to you for free and open access by the Civil and Environmental Engineering at BYU ScholarsArchive. It has been accepted for inclusion in Engineering Applications of GIS - Laboratory Exercises by an authorized administrator of BYU ScholarsArchive. For more information, please contact scholarsarchive@byu.edu.
2 Laboratory Exercise - Temple-View Least- Cost Mountain Bike Trail Background The International Mountain Bicycling Association (IMBA) has created several guidelines that are used when locating and building new mountain bike trails. A GIS is can be used to generate possible locations for mountain bike trails while following guidelines given by the IMBA. These guidelines include maximum allowable slopes, avoiding fall lines, avoiding flat areas, and seeking areas that include control points such as viewpoints, water, or other attractions. One way to determine the most appropriate placement of a mountain bike trail is to create and run a model in ArcMap that has the necessary input parameters defined within the model. A virtual cost terrain can be created by combining several raster data sets. The best path, or least cost path through this terrain can be determined by running a least-cost analysis. Problem Statement This lab simulates the placement of a mountain biking trail from existing trailheads at the mouth of Rock Canyon and Provo Canyon. Other than the IMBA trail building guidelines, the placement of trail is to be determined by maximizing the viewability of the LDS temples within Utah Valley. The lab assumes that a trail is desired and the starting and ending points are known and that the remaining consideration is simply the routing of the trail. Spatial Considerations Using ArcGIS Model Builder and the data supplied, create a model that will site a mountain bike trail considering the following criteria: Trails should start and end at existing trail heads. Trails should avoid municipal boundaries whenever possible. Set the new values to either 1 or 30. Trails should avoid running in existing streams and waterways as much as possible. Set the new values to 1 or 20. Because the slope of the terrain is a major factor in determining the path, cell size is very important for an accurate trail. Make sure all cell sizes are sized the same and are as small as possible. Use a uniform scale factor (1 to 50) when using the raster calculator/reclassification tools to determine what locations would be suitable for a mountain bike path. The scales above are scaling guidelines with lover values meaning more suitable areas.
3 Data boundaries/citycountystate/ - Municipal Boundaries: Download the city boundaries for Utah. This is found in the Municipal Boundaries section using the Municipal Boundaries:Shapefile link boundaries/citycountystate/ - Utah Counties Shapefile: A shapefile can be downloaded that contains geographic data for all of the counties in Utah. You will select Utah county from this data set and use it in the model /data/elevation-terrain-data/10-30-meter-elevation-models-usgs-ned/ - NED (National Elevation Dataset): You will download the elevation dataset for Utah. It is provided by the USGS. Either the 10m or 30m NED for Utah County will work for this lab. /data/water-data-services/lakes-rivers-dams - Utah Lakes and Streams: You will download TWO shapefiles from this location. The first is the Utah Lakes file named Lakes NHD High Res: Shapefile. The other is Utah streams file named Streams NHD High Res: Shapefile. User Created Shapefile of Temple locations - You will need to create a shapefile containing the point data for the locations of the temples in Utah county. This can be done by finding the locations manually using the basemap. User Created Start/Finish Point Shapefiles: You will need to create TWO separate Shapefiles for this step. The first is a shapefile containing the point data of the location of the start of the bike trail. For this lab, the start point will be near the entrance to Rock Canyon park in Provo. The second Shapefile will contain the point data of the location of the end of the bike trail. For this lab, the end point will be near the entrance to Provo Canyon. Model Builder Tools In this laboratory exercise, you may use previous tools and will use the following new tool. Viewshed creates a raster that records the number of times each area can be seen from an input set of data points or polyline. It allows areas that are viewable from specific locations to be identified.

4 Example Model
5


6 Step By Step Solution For an advanced GIS student, the information up to this point is all you need to complete the assignment and create an output map from the results. Feel free to try conducting the analysis using on the information provided above. If you need specific steps, follow the instructions. Step 1 The clip tool can be used to select the areas of interest from the shapefiles that contain information for the entire state of Utah. In order to help the model run more efficiently, the lakes shapefile and the rivers/streams shapefile should be clipped using the Utah County boundary. Step 2 You will next need to project the initial raster elevation layer into NAD 1983, resulting in a new raster layer, assuming it is not already in that projection. The output coordinate system can also be made a parameter, so the user can define what coordinate system is being used without using the editor.


7 Step 3 Next you will calculate the region within the area of interest that is visible from each of the three temples within Utah County, and is therefore the region where it is possible to see all three temples at the same time. Most of the parameters for this tool will be left blank, only selecting the inputs of the elevation raster layer and the shapefile that contains all the temple locations. Step 4 You will also need to calculate the slope of the projected raster layer from step 2 using the Slope tool. Step 5 Next you will convert all of the polygon and polyline layers into raster layers. This is so that they can be reclassified to reflect the desired characteristics for trail locations. The municipal boundaries and the lakes layers will be converted using the Polygon to Raster tool and the streams layer will be converted using the Polyline to Raster tool. Make sure to specify the desired cell size, which for this lab is 10 meters.


8 Step 6 The following step is to begin the process of reclassifying each of the raster layers to reflect the IMBA guidelines and where the trail is supposed to be located. All of these reclassifications can be modified to give more weight to the various raster layers.
9 Reclassifying the Municipal Boundary- The municipal boundary raster should be simply a selection of cells with values and cells with NoData. The cells with values fall within the municipal boundary and are not desirable for the mountain bike trail. Values Reclassified Values NoData 1 Reclassifying the Lakes Raster- The lakes layer should also be a simple raster that reflects a yes or no on whether the cells are considered lakes. Unlike the municipal boundary, it is actually impossible to route the trail through a lake, so the reclassified values should be higher for cells that are considered lakes. Values Reclassified Values NoData 1 Reclassifying the Streams Raster- The stream raster should reflect the different types of streams that the original shapefile differentiated, but again we are only interested in whether a cell is considered to have a stream in it or not. Also, according to IMBA guidelines, crossing streams is permissible, but should be done as little as possible, so the reclassified value should not prohibit the trail from crossing the stream. Values Reclassified Values NoData 1
10 Reclassifying the Slope Raster - The slope raster is more complicated than the previous rasters. IMBA guidelines dictate that trails should not travel in flat areas, nor in extremely steep areas. Also it is best if the trail reverses grade periodically so that water does not drain directly down the trail. Values Reclassified Values Reclassifying the Viewshed Raster- The viewshed raster also differs from the earlier rasters in that we want the trail to go where the viewshed raster has values. Anywhere that does not have a view of the temple should be a high cost area for the trail to travel. Values Reclassified Values

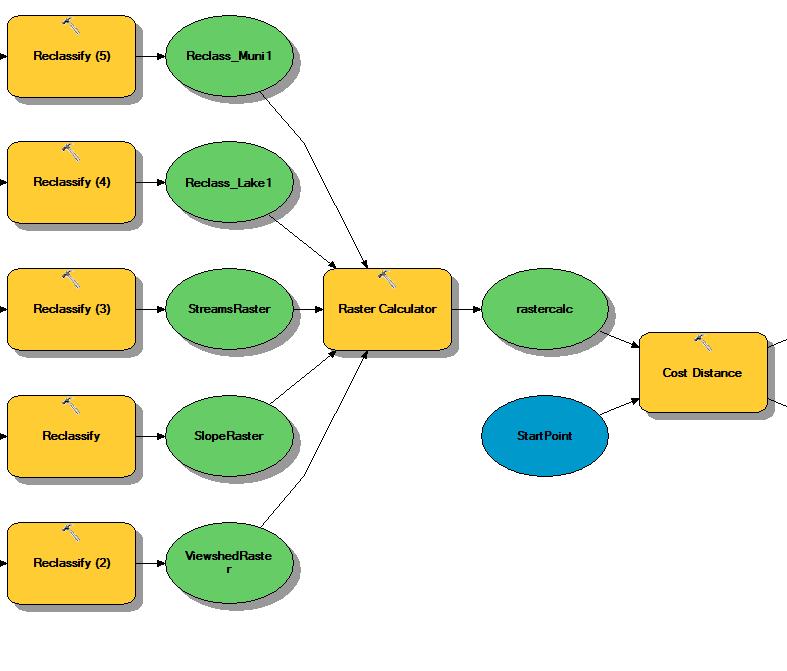
11 Step 7 After all the raster layers have been reclassified, the next step is to add them all together using the raster calculator to produce the virtual cost raster that will be used to determine the least cost path. The raster calculator is used to add all of the raster layers together so that the virtual cost map will reflect the sum of the costs for each cell. The formula may look something like this (%Reclass_Mun1% + %Reclass_Lake1% + %StreamsRaster% + %SlopesRaster% + %ViewshedRaster% ).


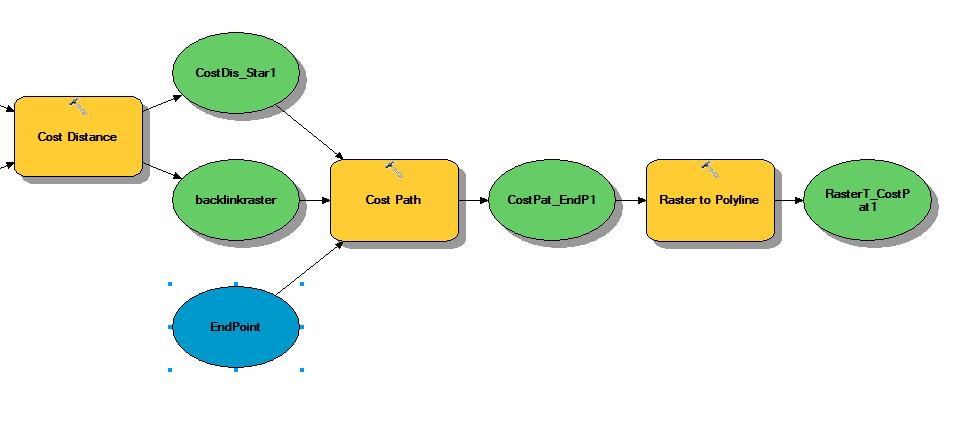
12 Step 8 The next step is to use the Cost Distance tool and the Cost Path tool to calculate the least cost path between the starting and ending points. The two tools and the input data sets are used in the order shown below. The starting point and the virtual cost map are inputs into the Cost Distance tool and then the two outputs from the Cost Distance tool and the ending point are used as inputs in the Cost Path tool. Step 9 The final step is convert the path generated into a polyline so that it can be properly displayed on the basemap.
13 Deliverables Once completed, submit your Model Builder process chart in its entirety and a map that demonstrates how you analyzed the included data and the results. Your map should conform to generally accepted cartography standards and should include at minimum, a scale bar, north arrow, and legend (see the following rubric). Your report should explain your Model Builder process and how it works. Make sure to provide any equations you used in your calculations and feel free to share any challenges you faced as you completed the process. Make sure to review the rubric at the end of this chapter for the full requirements for the laboratory exercise. References Bolstad, P. (2008) GIS Fundamentals: A first Text on Geographic Information Systems. 3rd Edition. Esri Publishing. Keen, W. (2006) International Mountain Biking Association: Designing and Building Sustainable Trails. Example Map


14 Temple View Mountain Bike Trail & ^_!( Miles Legend & End Point!( Start Point ^_ Temple Locations ± RasterT_CostPat1 Least Cost Trail ^_ Sources: Esri, HERE, DeLorme, USGS, Intermap, INCREMENT P, NRCan, Esri Japan, METI, Esri China (Hong Kong), Esri Korea, Esri (Thailand), MapmyIndia, NGCC, OpenStreetMap contributors, and the GIS User Community Least Cost Mt Bike Tail Date Projection Sources: Esri, HERE, DeLorme, USGS, Intermap, INCREMENT P, NRCan, Esri Japan, METI, Esri China (Hong Kong), Esri Korea, Esri (Thailand), MapmyIndia, NGCC,
15 Rubric Item Points Assignment Title, Author Name, Date, Course Name /5 Brief summary of the requirements of the project /5 Describe your model List each of the tools used and their settings (could someone repeat the assignment using your lab report?): 2 points List all input, intermediate, and output datasets: 2 points Describe each input dataset including type (point, line, polygon, raster) and the source of the data: 2 points Describe each input dataset including type (point, line, polygon, raster) and the source of the data: 2 points Describe each output dataset (point, line, polygon, raster): 2 points /10 Show your model on 8.5x11 inch size paper (5 points) All text is readable (10 point font minimum) (3 points) All tools and data sets are shown (2 points) /10 Describe what classifications you would change to make the model more realistic. (2 points) Describe the route computed for the mountain bike trail. Does it seem to be realistic? (3 points) /5 Make a full page (8.5x11) map showing page 21 of your atlas. Map Title: 1 point Neat Line: 1 point North Arrow: 1 point Scale Bar: 1 point Text box with author name, date, map projection: 1 point Visible basemap: 1 point All text is legible on printed map: 1 point /15 Bonus Task: Repeat the lab exercise with a different set of data. Include in your report what data you used, how you acquired it, what, if anything, you changed to complete the exercise work. Also include an additional full page map showing your results. Instructor s Discretion
Laboratory Exercise X Most Dangerous Places to Live in the United States Based on Natural Disasters
 Brigham Young University BYU ScholarsArchive Engineering Applications of GIS - Laboratory Exercises Civil and Environmental Engineering 2016 Laboratory Exercise X Most Dangerous Places to Live in the United
Laboratory Exercise Possible Zara Locations in Utah
 Brigham Young University BYU ScholarsArchive Engineering Applications of GIS - Laboratory Exercises Civil and Environmental Engineering 2017 Laboratory Exercise Possible Zara Locations in Utah Garlick
Streams in the Ranching Country of South Texas
 Streams in the Ranching Country of South Texas Watershed Analysis of HUC 12110207 Sandranell Moerbe CE GIS in Water Resources Fall 2015 INTRODUCTION This project investigates the portion of South Texas
1 foot of Sea Level Rise
 1 foot of Sea Level Rise Schools Fire Stations Law Enforcement u Hospitals 1ft SLR 0 0.125 0.25 0.5 Miles the 2013 study A Geological Perspective U.S. Mid-Atlantic Coast a probable threat expected by 2050.
1 foot of Sea Level Rise
 1 foot of Sea Level Rise Schools Fire Stations $+ Law Enforcement u Hospitals 1ft SLR 0 0.25 0.55 1.1 Miles $+ Year 20 Population: the 2013 study A Geological Perspective U.S. Mid-Atlantic Coast a probable
Land cover modeling in the Travis County
 Land cover modeling in the Travis County Contents Introduction.1 Data collection 3 Data pre-processing 6 Land cover modeling 12 Final considerations 13 Prepared for: GIS and Water Resources By Julie C
BUNCOMBE COUNTY NORTH CAROLINA
 PROJECT SITE ² 0 0. 75 1. 5 LOCATION MAP MARCH 2018 2. 25 3 Mil es AID: PROJECT # 2018-01122 18.05301 Sheet 1 of 7 Sources: Esri, HERE, DeLorme, USGS, Intermap, INCREMENT P, NRCan, Esri Japan, METI, Esri
Using ArcGIS for Hydrology and Watershed Analysis:
 Using ArcGIS 10.2.2 for Hydrology and Watershed Analysis: A guide for running hydrologic analysis using elevation and a suite of ArcGIS tools Anna Nakae Feb. 10, 2015 Introduction Hydrology and watershed
Natalie Cabrera GSP 370 Assignment 5.5 March 1, 2018
 Network Analysis: Modeling Overland Paths Using a Least-cost Path Model to Track Migrations of the Wolpertinger of Bavarian Folklore in Redwood National Park, Northern California Natalie Cabrera GSP 370
Exercise 2: Working with Vector Data in ArcGIS 9.3
 Exercise 2: Working with Vector Data in ArcGIS 9.3 There are several tools in ArcGIS 9.3 used for GIS operations on vector data. In this exercise we will use: Analysis Tools in ArcToolbox Overlay Analysis
Tutorial 8 Raster Data Analysis
 Objectives Tutorial 8 Raster Data Analysis This tutorial is designed to introduce you to a basic set of raster-based analyses including: 1. Displaying Digital Elevation Model (DEM) 2. Slope calculations
Outcrop suitability analysis of blueschists within the Dry Lakes region of the Condrey Mountain Window, North-central Klamaths, Northern California
 Outcrop suitability analysis of blueschists within the Dry Lakes region of the Condrey Mountain Window, North-central Klamaths, Northern California (1) Introduction: This project proposes to assess the
Handling Raster Data for Hydrologic Applications
 Handling Raster Data for Hydrologic Applications Prepared by Venkatesh Merwade Lyles School of Civil Engineering, Purdue University vmerwade@purdue.edu January 2018 Objective The objective of this exercise
Data Structures & Database Queries in GIS
 Data Structures & Database Queries in GIS Objective In this lab we will show you how to use ArcGIS for analysis of digital elevation models (DEM s), in relationship to Rocky Mountain bighorn sheep (Ovis
Delineation of Watersheds
 Delineation of Watersheds Adirondack Park, New York by Introduction Problem Watershed boundaries are increasingly being used in land and water management, separating the direction of water flow such that
Exercise 2: Working with Vector Data in ArcGIS 9.3
 Exercise 2: Working with Vector Data in ArcGIS 9.3 There are several tools in ArcGIS 9.3 used for GIS operations on vector data. In this exercise we will use: Analysis Tools in ArcToolbox Overlay Analysis
Exercise 6: Working with Raster Data in ArcGIS 9.3
 Exercise 6: Working with Raster Data in ArcGIS 9.3 Why Spatial Analyst? Grid query Grid algebra Grid statistics Summary by zone Proximity mapping Reclassification Histograms Surface analysis Slope, aspect,
Hydrology and Watershed Analysis
 Hydrology and Watershed Analysis Manual By: Elyse Maurer Reference Map Figure 1. This map provides context to the area of Washington State that is being focused on. The red outline indicates the boundary
Suitability Analysis on Second Home Areas Selection in Smithers British Columbia
 GEOG 613 Term Project Suitability Analysis on Second Home Areas Selection in Smithers British Columbia Zhengzhe He November 2005 Abstract Introduction / background Data Source Data Manipulation Spatial
High Speed / Commuter Rail Suitability Analysis For Central And Southern Arizona
 High Speed / Commuter Rail Suitability Analysis For Central And Southern Arizona Item Type Reports (Electronic) Authors Deveney, Matthew R. Publisher The University of Arizona. Rights Copyright is held
Location Restrictions Certification Report NIPSCO Michigan City Generating Station Boiler Slag Pond
 Location Restrictions Certification Report NIPSCO Michigan City Generating Station Boiler Slag Pond Pursuant to: 40 CFR 257.60 40 CFR 257.61 40 CFR 257.62 40 CFR 257.63 40 CFR 257.64 Submitted to: Northern
Welcome to NR502 GIS Applications in Natural Resources. You can take this course for 1 or 2 credits. There is also an option for 3 credits.
 Welcome to NR502 GIS Applications in Natural Resources. You can take this course for 1 or 2 credits. There is also an option for 3 credits. The 1st credit consists of a series of readings, demonstration,
How might you use visibility to map an ancient civilization's political landscape?
 Analyzing Ancient Political Power and Urbanization Patterns by Introduction Problem How might you use visibility to map an ancient civilization's political landscape? The Yoruba civilization, one of the
Introduction. Project Summary In 2014 multiple local Otsego county agencies, Otsego County Soil and Water
 Introduction Project Summary In 2014 multiple local Otsego county agencies, Otsego County Soil and Water Conservation District (SWCD), the Otsego County Planning Department (OPD), and the Otsego County
LANDSLIDE HAZARD ANALYSIS AND ITS EFFECT ON ENDANGERED SPECIES HABITATS, GRAND COUNTY, UTAH
 12/5/2016 LANDSLIDE HAZARD ANALYSIS AND ITS EFFECT ON ENDANGERED SPECIES HABITATS, GRAND COUNTY, UTAH GIS Final Project Ashlyn Murphy Fall 2016 1. Introduction and Problem A well-known geologic hazard
Trail Flow: Analysis of Drainage Patterns Affecting a Mountain Bike Trail
 Andy Belcher BAE 590 Professor Huffman 12.9.11 Location Trail Flow: Analysis of Drainage Patterns Affecting a Mountain Bike Trail The location of the project area rests in the Cary area of Wake County,
Delineation of high landslide risk areas as a result of land cover, slope, and geology in San Mateo County, California
 Delineation of high landslide risk areas as a result of land cover, slope, and geology in San Mateo County, California Introduction Problem Overview This project attempts to delineate the high-risk areas
Mapping Hobbs State Park Spring 2015 Luke Dye Daryk Blackford
 Mapping Hobbs State Park Spring 2015 Luke Dye Daryk Blackford Introduction to Geographic Information Science Northwest Arkansas Community College Instructor Paul Lowrey Hobbs State Park-Conservation Area
In this exercise we will learn how to use the analysis tools in ArcGIS with vector and raster data to further examine potential building sites.
 GIS Level 2 In the Introduction to GIS workshop we filtered data and visually examined it to determine where to potentially build a new mixed use facility. In order to get a low interest loan, the building
Working with Digital Elevation Models in ArcGIS 8.3
 Working with Digital Elevation Models in ArcGIS 8.3 The homework that you need to turn in is found at the end of this document. This lab continues your introduction to using the Spatial Analyst Extension
GIS in Water Resources Midterm Exam Fall 2008 There are 4 questions on this exam. Please do all 4.
 Page 1 of 8 Name: GIS in Water Resources Midterm Exam Fall 2008 There are 4 questions on this exam. Please do all 4. 1. Basic Concepts [20 points] Find the letter with the best answer for each term: 1.
Classification of Erosion Susceptibility
 GEO327G: GIS & GPS Applications in Earth Sciences Classification of Erosion Susceptibility Denali National Park, Alaska Zehao Xue 12 3 2015 2 TABLE OF CONTENTS 1 Abstract... 3 2 Introduction... 3 2.1 Universal
GIS and Forest Engineering Applications FE 257 Lecture and laboratory, 3 credits
 GIS and Forest Engineering Applications FE 257 Lecture and laboratory, 3 credits Instructor: Michael Wing Associate Professor Forest Engineering, Resources, and Management Oregon State University Crop
URP4273 FINAL PROJECT
 URP4273 FINAL PROJECT Demographic & Socio-Economic Profiles and US Populations in a Spatial Context relating to the 2016 Presidential Elections GROUP 4 Cara Walkover Gaby Placido Mark Rumenik Nicholas
Geo 327G Semester Project. Landslide Suitability Assessment of Olympic National Park, WA. Fall Shane Lewis
 Geo 327G Semester Project Landslide Suitability Assessment of Olympic National Park, WA Fall 2011 Shane Lewis 1 I. Problem Landslides cause millions of dollars of damage nationally every year, and are
FR Exam 2 Substitute Project!!!!!!! 1
 FR5131 - Exam 2 Substitute Project!!!!!!! 1 Goal We seek to identify county lands that both protect vernal pools and riparian corridors, and that provide open space and recreation within easy reach of
Vector Analysis: Farm Land Suitability Analysis in Groton, MA
 Vector Analysis: Farm Land Suitability Analysis in Groton, MA Written by Adrienne Goldsberry, revised by Carolyn Talmadge 10/9/2018 Introduction In this assignment, you will help to identify potentially
Open ArcToolbox Spatial Analyst Tools Hydrology. This should display the tools shown at the right:
 Project 2: Watershed Functions Save and close your project, above, if you haven t done so already. Then, open a new project, and add the driftless DEM. We ll be using ArcToolbox for this new project, but
GIS IN ECOLOGY: ANALYZING RASTER DATA
 GIS IN ECOLOGY: ANALYZING RASTER DATA Contents Introduction... 2 Raster Tools and Functionality... 2 Data Sources... 3 Tasks... 4 Getting Started... 4 Creating Raster Data... 5 Statistics... 8 Surface
Topographic Maps and Landforms Geology Lab
 Topographic Maps and Landforms Geology Lab Ray Rector: Instructor Today s Lab Activities 1) Discussion of Last Week s Lab 2) Lecture on Topo Maps and Elevation Contours 3) Construct Topographic Maps and
GEOG4017 Geographical Information Systems Lab 8 Spatial Analysis and Digital Terrain Modeling
 DEPARTMENT OF GEOGRAPHY HONG KONG BAPTIST UNIVERSITY Prof. Q. Zhou GEOG4017 Geographical Information Systems Lab 8 Spatial Analysis and Digital Terrain Modeling Objectives The exercise is designed to familiarize
Seattle/Shoreline. Shoreline. Seattle. Please answer our "Your Thoughts" questions
 Shoreline SCTION SCTION A 5 ST 5 5 5 AV 5 AV Y I- 5 F 5 AV O A YN Seattle/Shoreline 5 ST 5 5 ST.5 Sources: sri, HR, Garmin, USGS, Intermap, INCRMNT P, NRCan, sri Japan, MTI, sri China (Hong Kong), sri
Task 1: Start ArcMap and add the county boundary data from your downloaded dataset to the data frame.
 Exercise 6 Coordinate Systems and Map Projections The following steps describe the general process that you will follow to complete the exercise. Specific steps will be provided later in the step-by-step
Abstract: Contents. Literature review. 2 Methodology.. 2 Applications, results and discussion.. 2 Conclusions 12. Introduction
 Abstract: Landfill is one of the primary methods for municipal solid waste disposal. In order to reduce the environmental damage and to protect the public health and welfare, choosing the site for landfill
Exercise 4 Estimating the effects of sea level rise on coastlines by reclassification
 Exercise 4 Estimating the effects of sea level rise on coastlines by reclassification Due: Thursday February 1; at the start of class Goal: Get familiar with symbolizing and making time-series maps of
LANDSLIDE RISK ASSESSMENT IN YOSEMITE NATIONAL PARK. Edna Rodriguez December 1 st, 2016 Final Project
 LANDSLIDE RISK ASSESSMENT IN YOSEMITE NATIONAL PARK Edna Rodriguez December 1 st, 2016 Final Project Table of Contents Introduction... 2 Data Collection... 2 Data Preprocessing... 3 ArcGIS Processing...
Map image from the Atlas of Oregon (2nd. Ed.), Copyright 2001 University of Oregon Press
, Copyright 2001 University of Oregon Press") Map Layout and Cartographic Design with ArcGIS Desktop Matthew Baker ESRI Educational Services Redlands, CA Education UC 2008 1 Seminar overview General map design principles Working with map elements
Map Layout and Cartographic Design with ArcGIS Desktop Matthew Baker ESRI Educational Services Redlands, CA Education UC 2008 1 Seminar overview General map design principles Working with map elements
How to Create Stream Networks using DEM and TauDEM
 How to Create Stream Networks using DEM and TauDEM Take note: These procedures do not describe all steps. Knowledge of ArcGIS, DEMs, and TauDEM is required. TauDEM software ( http://hydrology.neng.usu.edu/taudem/
SCHOOL OF ENGINEERING AND TECHNOLOGY COMPUTER LAB
 PHASE 1_6 TH SESSION ARCGIS TRAINING AT KU GIS LABS: INTRODUCTION TO GIS: EXPLORING ARCCATALOG AND ARCGIS TOOLS 6 TH SESSION REPORT: 3 RD -5 TH SEPTEMBER 2014 SCHOOL OF ENGINEERING AND TECHNOLOGY COMPUTER
Topographic Maps Lab 1
 Topographic Maps Lab 1 I. Objectives 1. Construct a material model of typical terrain found in a landscape. 2. Construct a topographic map corresponding to the terrain model. 3. Learn how to interpret
Popular Mechanics, 1954
 Introduction to GIS Popular Mechanics, 1954 1986 $2,599 1 MB of RAM 2017, $750, 128 GB memory, 2 GB of RAM Computing power has increased exponentially over the past 30 years, Allowing the existence of
CE 365K Exercise 1: GIS Basemap for Design Project Spring 2014 Hydraulic Engineering Design
 CE 365K Exercise 1: GIS Basemap for Design Project Spring 2014 Hydraulic Engineering Design The purpose of this exercise is for you to construct a basemap in ArcGIS for your design project. You may execute
Office of Geographic Information Systems
 Office of Geographic Information Systems Print this Page Winter 2009 - Desktop GIS: The National Grid Wants You! By Todd Lusk In case of a disaster would you want emergency responders to be able to easily
Geographic Systems and Analysis
 Geographic Systems and Analysis New York University Robert F. Wagner Graduate School of Public Service Instructor Stephanie Rosoff Contact: stephanie.rosoff@nyu.edu Office hours: Mondays by appointment
Geographical Information Systems
 Geographical Information Systems Geographical Information Systems (GIS) is a relatively new technology that is now prominent in the ecological sciences. This tool allows users to map geographic features
Erosion Susceptibility in the area Around the Okanogan Fire Complex, Washington, US
 Erosion Susceptibility in the area Around the Okanogan Fire Complex, Washington, US 1. Problem Construct a raster that represents susceptibility to erosion based on lithology, slope, cover type, burned
Using the Stock Hydrology Tools in ArcGIS
 Using the Stock Hydrology Tools in ArcGIS This lab exercise contains a homework assignment, detailed at the bottom, which is due Wednesday, October 6th. Several hydrology tools are part of the basic ArcGIS
Date: UNI. world. *Dedicated to
 Name: Date: UNI IT THREE 2D and 3D model s of the natural world *Dedicated to Name: Date: ABSTRACT T AND RATIONALE A topographic map is a type of map that depicts the detail and quantitative representation
Map My Property User Guide
 Map My Property User Guide Map My Property Table of Contents About Map My Property... 2 Accessing Map My Property... 2 Links... 3 Navigating the Map... 3 Navigating to a Specific Location... 3 Zooming
ESM Geographic Information Systems - Spring 2014
 My Home / ESM 263 - S14 ESM 263 - GEOG. INFO. SYSTEMS - Spring 2014 SECTION LINKS 1 2 3 4 5 6 7 8 9 10 Jump to current week LATEST NEWS 12:24 PM,May 2 James Frew default workspace solution Older topics...
Yavapai County Flood Control District. Prescott Valley Mapping Activity Statement Activities (Zone A Floodplain Delineation and Base Map Updates)
") Yavapai County Flood Control District Prescott Valley Mapping Activity Statement Activities (Zone A Floodplain Delineation and Base Map Updates) Scope of ork Prepar by: October 2014 Scope of ork TABLE
Yavapai County Flood Control District Prescott Valley Mapping Activity Statement Activities (Zone A Floodplain Delineation and Base Map Updates) Scope of ork Prepar by: October 2014 Scope of ork TABLE
Alaska, USA. Sam Robbins
 Using ArcGIS to determine erosion susceptibility within Denali National Park, Alaska, USA Sam Robbins Introduction Denali National Park is six million acres of wild land with only one road and one road
Spatial Data Analysis with ArcGIS Desktop: From Basic to Advance
 Spatial Data Analysis with ArcGIS Desktop: From Basic to Advance 1. Course overview Modern environmental, energy as well as resource modeling and planning require huge amount of geographically located
Classifying Access on Whitewater Wildlife Management Area Callahan Unit using GIS
 Classifying Access on Whitewater Wildlife Management Area Callahan Unit using GIS Chris Scharenbroich 1, 2 1 Department of Resource Analysis, Saint Mary s University of Minnesota, Winona, MN 55987, 2 Minnesota
GIS Level 2. MIT GIS Services
 GIS Level 2 MIT GIS Services http://libraries.mit.edu/gis Email: gishelp@mit.edu TOOLS IN THIS WORKSHOP - Definition Queries - Create a new field in the attribute table - Field Calculator - Add XY Data
GIS in Water Resources Midterm Exam Fall 2016 There are four questions on this exam. Please do all four. They are not all of equal weight.
 Page 1 of 7 Name: GIS in Water Resources Midterm Exam Fall 2016 There are four questions on this exam. Please do all four. They are not all of equal weight. Question 1. (20%) (a) Three key functions of
GIS Workshop UCLS_Fall Forum 2014 Sowmya Selvarajan, PhD TABLE OF CONTENTS
 TABLE OF CONTENTS TITLE PAGE NO. 1. ArcGIS Basics I 2 a. Open and Save a Map Document 2 b. Work with Map Layers 2 c. Navigate in a Map Document 4 d. Measure Distances 4 2. ArcGIS Basics II 5 a. Work with
10/13/2011. Introduction. Introduction to GPS and GIS Workshop. Schedule. What We Will Cover
 Introduction Introduction to GPS and GIS Workshop Institute for Social and Environmental Research Nepal October 13 October 15, 2011 Alex Zvoleff azvoleff@mail.sdsu.edu http://rohan.sdsu.edu/~zvoleff Instructor:
Steve Pye LA /22/16 Final Report: Determining regional locations of reference sites based on slope and soil type. Client: Sonoma Land Trust
 Steve Pye LA 221 04/22/16 Final Report: Determining regional locations of reference sites based on slope and soil type. Client: Sonoma Land Trust Deliverables: Results and working model that determine
Base Maps: Creating, Using & Participating
 Base Maps: Creating, Using & Participating Michael Fashoway & Erin Geraghty Montana Base Map Service Center 2010 MAGIP Technical Session October 28, 2010 What is a Base Map? Using a Base Map Creating a
NR402 GIS Applications in Natural Resources
 NR402 GIS Applications in Natural Resources Lesson 1 Introduction to GIS Eva Strand, University of Idaho Map of the Pacific Northwest from http://www.or.blm.gov/gis/ Welcome to NR402 GIS Applications in
Lauren Jacob May 6, Tectonics of the Northern Menderes Massif: The Simav Detachment and its relationship to three granite plutons
 Lauren Jacob May 6, 2010 Tectonics of the Northern Menderes Massif: The Simav Detachment and its relationship to three granite plutons I. Introduction: Purpose: While reading through the literature regarding
Expanding Canada s Rail Network to Meet the Challenges of the Future
 Expanding Canada s Rail Network to Meet the Challenges of the Future Lesson Overview Rail may become a more popular mode of transportation in the future due to increased population, higher energy costs,
GED 554 IT & GIS. Lecture 6 Exercise 5. May 10, 2013
 GED 554 IT & GIS Lecture 6 Exercise 5 May 10, 2013 Free GIS data sources ******************* Mapping numerical data & Symbolization ******************* Exercise: Making maps for presentation GIS DATA SOFTWARE
Outline. Chapter 1. A history of products. What is ArcGIS? What is GIS? Some GIS applications Introducing the ArcGIS products How does GIS work?
 Outline Chapter 1 Introducing ArcGIS What is GIS? Some GIS applications Introducing the ArcGIS products How does GIS work? Basic data formats The ArcCatalog interface 1-1 1-2 A history of products Arc/Info
2 One-dimensional motion with constant acceleration
 2 One-dimensional motion with constant acceleration Experiment objectives: 1. Achieve a better understanding of how to solve position, velocity and acceleration problems in one-dimensional motion with
GEOREFERENCING, PROJECTIONS Part I. PRESENTING DATA Part II
 Week 7 GEOREFERENCING, PROJECTIONS Part I PRESENTING DATA Part II topics of the week Georeferencing Coordinate systems Map Projections ArcMap and Projections Geo-referencing Geo-referencing is the process
Export Basemap Imagery from GIS to CAD
 Export Basemap Imagery from GIS to CAD This tutorial illustrates how to add high resolution imagery as a basemap into an existing CAD drawing using ArcGIS and AutoCAD. Through this method, the imagery
Fire Susceptibility Analysis Carson National Forest New Mexico. Can a geographic information system (GIS) be used to analyze the susceptibility of
 be used to analyze the susceptibility of") 1 David Werth Fire Susceptibility Analysis Carson National Forest New Mexico Can a geographic information system (GIS) be used to analyze the susceptibility of Carson National Forest, New Mexico to forest
1 David Werth Fire Susceptibility Analysis Carson National Forest New Mexico Can a geographic information system (GIS) be used to analyze the susceptibility of Carson National Forest, New Mexico to forest
Geo-Enabling Mountain Bike Trail Maintenance:
 Title Slide Geo-Enabling Mountain Bike Trail Maintenance: Enhanced Stewardship of the Fountainhead Mountain Bike Trail through GIS Technology Ruthann Ligon Follow the Trail Fountainhead Mountain Bike
SAULT COLLEGE OF APPLIED ARTS AND TECHNOLOGY SAULT STE. MARIE, ONTARIO COURSE OUTLINE
 SAULT COLLEGE OF APPLIED ARTS AND TECHNOLOGY SAULT STE. MARIE, ONTARIO COURSE OUTLINE COURSE TITLE: GIS Applications CODE NO. : SEMESTER: 12W PROGRAM: AUTHOR: Geographic Information Systems Applications
The Retreat of the Grinnell Glacier: 1990-Present
 Falk, Hepler, Lopez 1 Megan Falk, Alex Hepler, Michelle Lopez GSP 270/ Graham Group Project/ Final Draft December 8, 2014 Word count: 1,148 Introduction The Retreat of the Grinnell Glacier: 1990-Present
SPATIAL MODELING GIS Analysis Winter 2016
 SPATIAL MODELING GIS Analysis Winter 2016 Spatial Models Spatial Modeling attempts to represent how the world works All models are wrong, but some are useful (G.E. Box, quoted in course textbook pg. 379)
Within this document, the term NHDPlus is used when referring to NHDPlus Version 2.1 (unless otherwise noted).
.") Exercise 7 Watershed Delineation Using ArcGIS Spatial Analyst Last Updated 4/6/2017 Within this document, the term NHDPlus is used when referring to NHDPlus Version 2.1 (unless otherwise noted). There
Exercise 7 Watershed Delineation Using ArcGIS Spatial Analyst Last Updated 4/6/2017 Within this document, the term NHDPlus is used when referring to NHDPlus Version 2.1 (unless otherwise noted). There
DEMs Downloading and projecting and using Digital Elevation Models (DEM)
") DEMs Downloading and projecting and using Digital Elevation Models (DEM) Introduction In this exercise, you will work with Digital Elevation Models (DEM). You will download a DEM in geographic coordinates
DEMs Downloading and projecting and using Digital Elevation Models (DEM) Introduction In this exercise, you will work with Digital Elevation Models (DEM). You will download a DEM in geographic coordinates
RiparianZone = buffer( River, 100 Feet )
") GIS Analysts perform spatial analysis when they need to derive new data from existing data. In GIS I, for example, you used the vector approach to derive a riparian buffer feature (output polygon) around
GIS Analysts perform spatial analysis when they need to derive new data from existing data. In GIS I, for example, you used the vector approach to derive a riparian buffer feature (output polygon) around
Georeferencing the Lackawanna Synclinorium using GIS
 Georeferencing the Lackawanna Synclinorium using GIS Conservation Services, LLC 2/20/2010 Contact: Philip Pass 570.510.1758 Rick Marquardt 570-335-7525 Managing Partners: Conservation Services LLC Author:
Exercie 5 Preparing GIS data for simulation with FARSITE REM407 GIS Applications in Fire Ecology and Management
 Exercie 5 Preparing GIS data for simulation with FARSITE REM407 GIS Applications in Fire Ecology and Management Assignment: Make maps of the Fuelmodel layer and the clipped Canopy cover layer and submit
IMAGE ANALYSIS MEASURING LANDSCAPE VEGETATION IN 1.3 MILLION PARCELS FOR OUTDOOR WATER BUDGETS
 IMAGE ANALYSIS MEASURING LANDSCAPE VEGETATION IN 1.3 MILLION PARCELS FOR OUTDOOR WATER BUDGETS Pete Vitt Santa Ana Watershed Project Authority (SAWPA) Doug Mende Statistical Research Inc. July 13, 2017
BASIC SPATIAL ANALYSIS TOOLS IN A GIS. data set queries basic statistics buffering overlay reclassification
 BASIC SPATIAL ANALYSIS TOOLS IN A GIS data set queries basic statistics buffering overlay reclassification GIS ANALYSIS TOOLS GIS ANALYSIS TOOLS Database tools: query and summarize (similar to spreadsheet
Map and Compass Skills
 Map and Compass Skills Grade levels: 5-12 In a Nutshell Given a map and compass, students will be able to find a location on the map, chart a course to that location with the compass, and find that location
A GIS-based Approach to Watershed Analysis in Texas Author: Allison Guettner
 Texas A&M University Zachry Department of Civil Engineering CVEN 658 Civil Engineering Applications of GIS Instructor: Dr. Francisco Olivera A GIS-based Approach to Watershed Analysis in Texas Author:
Esri UC2013. Technical Workshop.
 Esri International User Conference San Diego, California Technical Workshops July 9, 2013 CAD: Introduction to using CAD Data in ArcGIS Jeff Reinhart & Phil Sanchez Agenda Overview of ArcGIS CAD Support
GTECH 380/722 Analytical and Computer Cartography Hunter College, CUNY Department of Geography
 GTECH 380/722 Analytical and Computer Cartography Hunter College, CUNY Department of Geography Fall 2014 Mondays 5:35PM to 9:15PM Instructor: Doug Williamson, PhD Email: Douglas.Williamson@hunter.cuny.edu
GIS IN ECOLOGY: ANALYZING RASTER DATA
 GIS IN ECOLOGY: ANALYZING RASTER DATA Contents Introduction... 2 Tools and Functionality for Raster Data... 2 Data Sources... 3 Tasks... 4 Getting Started... 4 Creating Raster Data... 5 Summary Statistics...
Creating Watersheds from a DEM in ArcGIS 9.x
 Creating Watersheds from a DEM in ArcGIS 9.x These instructions enable you to create watersheds (a.k.a. catchments or basins) using a good quality Digital Elevation Model (DEM) in ArcGIS 9.1. The modeling
Spatial Analyst. By Sumita Rai
 ArcGIS Extentions Spatial Analyst By Sumita Rai Overview What does GIS do? How does GIS work data models Extension to GIS Spatial Analyst Spatial Analyst Tasks & Tools Surface Analysis Surface Creation
Spatial Analyst: Multiple Criteria Evaluation Material adapted from FOR 4114 developed by Forestry Associate Professor Steve Prisley
 Spatial Analyst: Multiple Criteria Evaluation Material adapted from FOR 4114 developed by Forestry Associate Professor Steve Prisley Section 1: Data In this exercise we will be working with several types
Determining the Location of the Simav Fault
 Lindsey German May 3, 2012 Determining the Location of the Simav Fault 1. Introduction and Problem Formulation: The issue I will be focusing on involves interpreting the location of the Simav fault in
SIE 509 Principles of GIS Exercise 5 An Introduction to Spatial Analysis
 SIE 509 Principles of GIS Exercise 5 An Introduction to Spatial Analysis Due: Oct. 31, 2017 Total Points: 50 Introduction: The Governor of Maine is asking communities to look at regionalization for major