OBESITY AND LOCATION IN MARION COUNTY, INDIANA MIDWEST STUDENT SUMMIT, APRIL Samantha Snyder, Purdue University
|
|
|
- Silas Hensley
- 5 years ago
- Views:
Transcription
1 OBESITY AND LOCATION IN MARION COUNTY, INDIANA MIDWEST STUDENT SUMMIT, APRIL 2008 Samantha Snyder, Purdue University
2 Organization Introduction Literature and Motivation Data Geographic Distributions ib ti and Correlations Methods Results Conclusions Discussion
3 Introduction Obesity is defined as a BMI of 30 or higher; overweight is defined as a BMI of 25 to 29.9; normal weight is defined as a BMI of 18.5 to Between 1980 and 2000, obesity and overweight have increased dramatically over all segments of the adult population. Disparities in prevalence exist across racial groups, education and income levels, and geography. Indiana (2005) 35.1% overweight, 27.2% obese (10 th in country) Marion County (2005) 35% overweight, 29.5% obese Trends in grocery retailing show unequal distribution of large chain grocers with respect to racial composition and income level.
4 Literature and Motivation Predominately conducted in fields of public health, epidemiology, and nutrition Emerging contribution from economics Unequal access to food retailers Cummins and Macintyre, Morland et al., Moore and Diez Roux, Zenk et al., Chung and Myers, Jr. Linking access directly to health Jeffery et al., Mandal and Chern, Chou et al., Morland et al., Gallagher, Rose and Richards, Wrigley et al.
5 Literature and Motivation It is agreed upon that environmental factors do play some role in idnividual health levels, for example, BMI. How does food retailer access impact BMI? While there are some variables we were able to measure, there are many we weren t. How can we build an accurate model of the determinants of BMI that incorporates known environmental factors and also allows for spatial dependence due to un-modeled factors?
6 Data 3,811 adults randomly selected and interviewed by telephone in Marion County, Indiana. Data collected on demographic and behavioral variables, and BMI and geocoded. Sample shows similar trends and associations as seen nationally. Respondents aggregated to census tracts to calculate a percent obese for each tract.
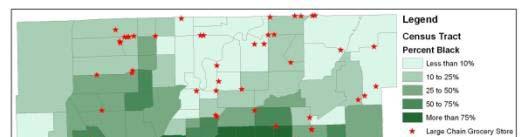
7 Data Names, addresses, and establishment type for each food retailer in Marion County, Indiana collected from Marion County Health Department. Food retailers defined into three categories: large chain grocery store, small grocery store, and convenience store. Counts of each type performed by census tract.
8 Data Census tract level variables for Marion County Median family income Percentage of African American residents Percentage of residents with some education past a high school diploma Percentage of households without a car
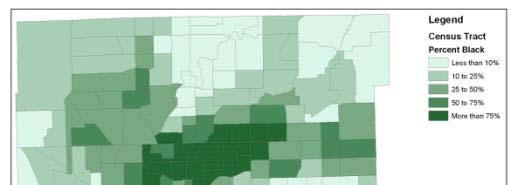
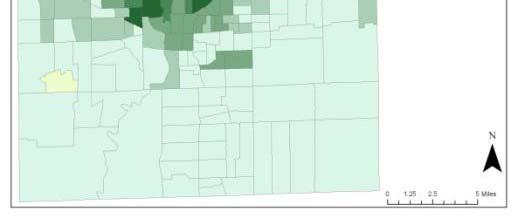
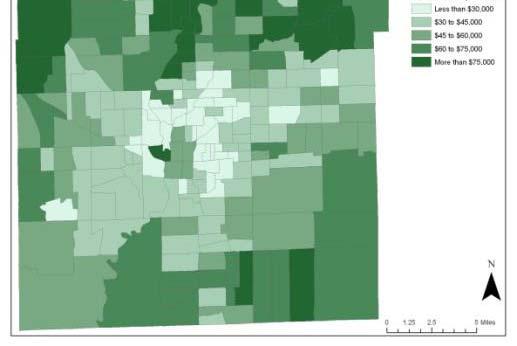
9 Geographic Distributions and Correlations


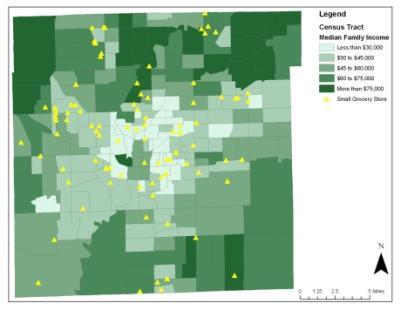
10 Geographic Distributions and Correlations

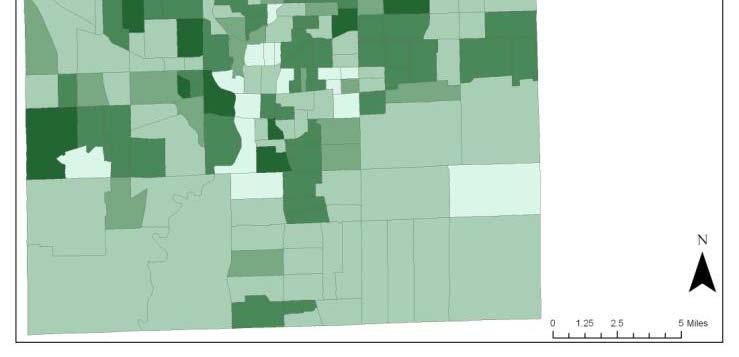
11 Geographic Distributions and Correlations
12 Methods Creation of spatial weights matrix Global Moran s I on raw values Measures spatial correlation (clustering) of census tract measures OLS with spatial diagnostics Spatial lag model Further refinement Two-stage least squares with instrumental variables
13 Results Queen contiguity matrix Census tract obesity levels are positively correlated with their neighbors levels
14 Results
15 Results
16 Results OLS Variable Coefficient Std. Error t-statistic Probability Constant Median Family Income e e % African American % > High School Diploma % No Car Large Chain Grocery Small Grocery Convenience Test Value Probability LM Lag LM Lag (Robust) LM Error LM Error (Robust) SARMA
17 Results Spatial Lag Variable Coefficient Std. Error t-statistic Probability W % Obese Constant Median Family Income e e % African American % > High School Diploma % No Car Large Chain Grocery Small Grocery Convenience
18 Further Refinement Aggregate census tracts with low sampling Heteroskedasticity Select weighted RHS variables for inclusion Two stage least squares with instrumental variables Aggregated data Individual level data More comprehensive food environment More exhaustive definition of retailer types
19 Conclusion Food retailer distribution in Marion County is highly tied to demographic characteristics such as income levels and racial composition. Patterns of levels of obesity also match these demographic distributions. ib i While both retailer distribution and obesity are correlated with population characteristics, retail access does not seem to be associated with obesity levels, once demographics are controlled. Spatial correlation, however, still exists to some degree.
20 Discussion What is it about the environment/neighborhood that could be contributing to spatial patterns in obesity levels? Can we model these factors? What do these relationships (and lack of relationships) imply for policymakers? Behavior, education, nutrition, public health, etc. What about the equity argument? How can these questions/research be adapted to address childhood obesity?
Obesity, Fast Food, and Grocery Stores: Evidence from Geo-referenced Micro Data
 Obesity, Fast Food, and Grocery Stores: Evidence from Geo-referenced Micro Data Susan E. Chen 1, Raymond J.G.M. Florax 1,, and Samantha D. Snyder 1 1 Purdue University, West Lafayette, USA VU University
Where Do Overweight Women In Ghana Live? Answers From Exploratory Spatial Data Analysis
 Where Do Overweight Women In Ghana Live? Answers From Exploratory Spatial Data Analysis Abstract Recent findings in the health literature indicate that health outcomes including low birth weight, obesity
A Comprehensive Method for Identifying Optimal Areas for Supermarket Development. TRF Policy Solutions April 28, 2011
 A Comprehensive Method for Identifying Optimal Areas for Supermarket Development TRF Policy Solutions April 28, 2011 Profile of TRF The Reinvestment Fund builds wealth and opportunity for lowwealth communities
DIFFERENT INFLUENCES OF SOCIOECONOMIC FACTORS ON THE HUNTING AND FISHING LICENSE SALES IN COOK COUNTY, IL
 DIFFERENT INFLUENCES OF SOCIOECONOMIC FACTORS ON THE HUNTING AND FISHING LICENSE SALES IN COOK COUNTY, IL Xiaohan Zhang and Craig Miller Illinois Natural History Survey University of Illinois at Urbana
Mapping the Markets: The Relative Density of Retail Food Stores in Densely Populated Census Blocks in the Central Coast Region of California
 Mapping the Markets: The Relative Density of Retail Food Stores in Densely Populated Census Blocks in the Central Coast Region of California Report to the Second Harvest Food Bank of Santa Cruz and San
Neighborhood social characteristics and chronic disease outcomes: does the geographic scale of neighborhood matter? Malia Jones
 Neighborhood social characteristics and chronic disease outcomes: does the geographic scale of neighborhood matter? Malia Jones Prepared for consideration for PAA 2013 Short Abstract Empirical research
Medical GIS: New Uses of Mapping Technology in Public Health. Peter Hayward, PhD Department of Geography SUNY College at Oneonta
 Medical GIS: New Uses of Mapping Technology in Public Health Peter Hayward, PhD Department of Geography SUNY College at Oneonta Invited research seminar presentation at Bassett Healthcare. Cooperstown,
Exploring the Association Between Family Planning and Developing Telecommunications Infrastructure in Rural Peru
 Exploring the Association Between Family Planning and Developing Telecommunications Infrastructure in Rural Peru Heide Jackson, University of Wisconsin-Madison September 21, 2011 Abstract This paper explores
TUESDAYS AT APA PLANNING AND HEALTH. SAGAR SHAH, PhD AMERICAN PLANNING ASSOCIATION SEPTEMBER 2017 DISCUSSING THE ROLE OF FACTORS INFLUENCING HEALTH
 SAGAR SHAH, PhD sshah@planning.org AMERICAN PLANNING ASSOCIATION SEPTEMBER 2017 TUESDAYS AT APA PLANNING AND HEALTH DISCUSSING THE ROLE OF FACTORS INFLUENCING HEALTH Outline of the Presentation PLANNING
Integrating GIS into Food Access Analysis
 GIS Day at Kansas University Integrating GIS into Food Access Analysis Daoqin Tong School of Geography and Development Outline Introduction Research questions Method Results Discussion Introduction Food
CRP 608 Winter 10 Class presentation February 04, Senior Research Associate Kirwan Institute for the Study of Race and Ethnicity
 CRP 608 Winter 10 Class presentation February 04, 2010 SAMIR GAMBHIR SAMIR GAMBHIR Senior Research Associate Kirwan Institute for the Study of Race and Ethnicity Background Kirwan Institute Our work Using
Geographical Inequalities and Population Change in Britain,
 Geographical Inequalities and Population Change in Britain, 1971-2011 Chris Lloyd, Nick Bearman, Gemma Catney Centre for Spatial Demographics Research, University of Liverpool, UK Email: c.d.lloyd@liverpool.ac.uk
Tracey Farrigan Research Geographer USDA-Economic Research Service
 Rural Poverty Symposium Federal Reserve Bank of Atlanta December 2-3, 2013 Tracey Farrigan Research Geographer USDA-Economic Research Service Justification Increasing demand for sub-county analysis Policy
Mapping and Health Equity Advocacy
 Mapping and Health Equity Advocacy Sarah Treuhaft PolicyLink November 7, 2008 About us PolicyLink National research and action institute that advances policies to achieve economic and social equity Center
This report details analyses and methodologies used to examine and visualize the spatial and nonspatial
 Analysis Summary: Acute Myocardial Infarction and Social Determinants of Health Acute Myocardial Infarction Study Summary March 2014 Project Summary :: Purpose This report details analyses and methodologies
BROOKINGS May
 Appendix 1. Technical Methodology This study combines detailed data on transit systems, demographics, and employment to determine the accessibility of jobs via transit within and across the country s 100
Frontier and Remote (FAR) Area Codes: A Preliminary View of Upcoming Changes John Cromartie Economic Research Service, USDA
 Area Codes: A Preliminary View of Upcoming Changes John Cromartie Economic Research Service, USDA") National Center for Frontier Communities webinar, January 27, 2015 Frontier and Remote (FAR) Area Codes: A Preliminary View of Upcoming Changes John Cromartie Economic Research Service, USDA The views
National Center for Frontier Communities webinar, January 27, 2015 Frontier and Remote (FAR) Area Codes: A Preliminary View of Upcoming Changes John Cromartie Economic Research Service, USDA The views
Comparing Perception-Based and Geographic Information System (GIS)-Based Characterizations of the Local Food Environment
-Based Characterizations of the Local Food Environment") Journal of Urban Health: Bulletin of the New York Academy of Medicine doi:10.1007/s11524-008-9259-x * 2008 The New York Academy of Medicine Comparing Perception-Based and Geographic Information System
Journal of Urban Health: Bulletin of the New York Academy of Medicine doi:10.1007/s11524-008-9259-x * 2008 The New York Academy of Medicine Comparing Perception-Based and Geographic Information System
Environmental Analysis, Chapter 4 Consequences, and Mitigation
 Environmental Analysis, Chapter 4 4.17 Environmental Justice This section summarizes the potential impacts described in Chapter 3, Transportation Impacts and Mitigation, and other sections of Chapter 4,
Developing Built Environment Indicators for Urban Oregon. Dan Rubado, MPH EPHT Epidemiologist Oregon Public Health Division
 Developing Built Environment Indicators for Urban Oregon Dan Rubado, MPH EPHT Epidemiologist Oregon Public Health Division What is the built environment? The built environment encompasses spaces and places
Planning for Economic and Job Growth
 Planning for Economic and Job Growth Mayors Innovation Project Winter 2012 Meeting January 21, 2012 Mary Kay Leonard Initiative for a Competitive Inner City AGENDA The Evolving Model for Urban Economic
Guilty of committing ecological fallacy?
 GIS: Guilty of committing ecological fallacy? David W. Wong Professor Geography and GeoInformation Science George Mason University dwong2@gmu.edu Ecological Fallacy (EF) Many slightly different definitions
An Indicator Model of the Spatial Quantification and Pattern Analysis of Urban Sustainability: A Case Study of Cincinnati, Ohio
 Current Urban Studies, 2015, 3, 231-240 Published Online September 2015 in SciRes. http://www.scirp.org/journal/cus http://dx.doi.org/10.4236/cus.2015.33019 An Indicator Model of the Spatial Quantification
Socio-Demographic and Economic Determinants of Food Deserts
 University of Arkansas, Fayetteville ScholarWorks@UARK Theses and Dissertations 8-2012 Socio-Demographic and Economic Determinants of Food Deserts Zhongyi Wang University of Arkansas, Fayetteville Follow
Going the Distance: A Regional Analysis of Food Accessibility in the Detroit Tri-County Area
 University of Michigan Deep Blue deepblue.lib.umich.edu 2012 Going the Distance: A Regional Analysis of Food Accessibility in the Detroit Tri-County Area Schewel, Elias; Seymour, Eric Schewel, Elias; Seymour,
ARIC Manuscript Proposal # PC Reviewed: _9/_25_/06 Status: A Priority: _2 SC Reviewed: _9/_25_/06 Status: A Priority: _2
 ARIC Manuscript Proposal # 1186 PC Reviewed: _9/_25_/06 Status: A Priority: _2 SC Reviewed: _9/_25_/06 Status: A Priority: _2 1.a. Full Title: Comparing Methods of Incorporating Spatial Correlation in
1Department of Demography and Organization Studies, University of Texas at San Antonio, One UTSA Circle, San Antonio, TX
 Well, it depends on where you're born: A practical application of geographically weighted regression to the study of infant mortality in the U.S. P. Johnelle Sparks and Corey S. Sparks 1 Introduction Infant
Variables and Variable De nitions
 APPENDIX A Variables and Variable De nitions All demographic county-level variables have been drawn directly from the 1970, 1980, and 1990 U.S. Censuses of Population, published by the U.S. Department
emerge Network: CERC Survey Survey Sampling Data Preparation
 emerge Network: CERC Survey Survey Sampling Data Preparation Overview The entire patient population does not use inpatient and outpatient clinic services at the same rate, nor are racial and ethnic subpopulations
Demographic Data in ArcGIS. Harry J. Moore IV
 Demographic Data in ArcGIS Harry J. Moore IV Outline What is demographic data? Esri Demographic data - Real world examples with GIS - Redistricting - Emergency Preparedness - Economic Development Next
Community Health Needs Assessment through Spatial Regression Modeling
 Community Health Needs Assessment through Spatial Regression Modeling Glen D. Johnson, PhD CUNY School of Public Health glen.johnson@lehman.cuny.edu Objectives: Assess community needs with respect to particular
Maggie M. Kovach. Department of Geography University of North Carolina at Chapel Hill
 Maggie M. Kovach Department of Geography University of North Carolina at Chapel Hill Rationale What is heat-related illness? Why is it important? Who is at risk for heat-related illness and death? Urban
ACCESS TO FOOD IN COLUMBIA, MISSOURI. A Thesis. presented to. the Faculty of the Graduate School. at the University of Missouri-Columbia
 ACCESS TO FOOD IN COLUMBIA, MISSOURI A Thesis presented to the Faculty of the Graduate School at the University of Missouri-Columbia In Partial Fulfillment of the Requirements for the Degree Master of
OnTheMap for Emergency Management
 OnTheMap for Emergency Management Robert Pitts Geographer/Project Manager Longitudinal Employer Household Dynamics (LEHD) Center for Economic Studies U.S. Census Bureau Jody Hoon-Star Geographer/Application
A SPATIAL ANALYSIS OF THE RELATIONSHIP BETWEEN OBESITY AND THE BUILT ENVIRONMENT IN SOUTHERN ILLINOIS. Shiloh L. Deitz
 A SPATIAL ANALYSIS OF THE RELATIONSHIP BETWEEN OBESITY AND THE BUILT ENVIRONMENT IN SOUTHERN ILLINOIS by Shiloh L. Deitz M.A. Southern Illinois University Carbondale, 2014 B.A. Whitworth University, 2009
Purpose Study conducted to determine the needs of the health care workforce related to GIS use, incorporation and training.
 GIS and Health Care: Educational Needs Assessment Cindy Gotz, MPH, CHES Janice Frates, Ph.D. Suzanne Wechsler, Ph.D. Departments of Health Care Administration & Geography California State University Long
Module 10 Summative Assessment
 Module 10 Summative Assessment Activity In this activity you will use the three dimensions of vulnerability that you learned about in this module exposure, sensitivity, and adaptive capacity to assess
Spatial Disparities in the Distribution of Parks and Green Spaces in the United States
 March 11 th, 2012 Active Living Research Conference Spatial Disparities in the Distribution of Parks and Green Spaces in the United States Ming Wen, Ph.D., University of Utah Xingyou Zhang, Ph.D., CDC
Improving the USDA s Definition of Food Deserts via a Spatial Interaction Approach A Case Study of Hamilton County, Ohio
 Improving the USDA s Definition of Food Deserts via a Spatial Interaction Approach A Case Study of Hamilton County, Ohio A Thesis Submitted to the Division of Graduate Studies of the University of Cincinnati
Vanessa Nadalin Lucas Mation IPEA - Institute for Applied Economic Research Regional Studies Association Global Conference Fortaleza 2014
 Spatial distribution of sanitation and income inequality in Brazilian Slums Vanessa Nadalin Lucas Mation IPEA - Institute for Applied Economic Research Regional Studies Association Global Conference Fortaleza
Nature of Spatial Data. Outline. Spatial Is Special
 Nature of Spatial Data Outline Spatial is special Bad news: the pitfalls of spatial data Good news: the potentials of spatial data Spatial Is Special Are spatial data special? Why spatial data require
Applying Health Outcome Data to Improve Health Equity
 Applying Health Outcome Data to Improve Health Equity Devon Williford, MPH, Health GIS Specialist Lorraine Dixon-Jones, Policy Analyst CDPHE Health Equity and Environmental Justice Collaborative Mile High
ESRI 2008 Health GIS Conference
 ESRI 2008 Health GIS Conference An Exploration of Geographically Weighted Regression on Spatial Non- Stationarity and Principal Component Extraction of Determinative Information from Robust Datasets A
Summary Article: Poverty from Encyclopedia of Geography
 Topic Page: Poverty Definition: poverty from Dictionary of Energy Social Issues. the fact of being poor; the absence of wealth. A term with a wide range of interpretations depending on which markers of
Applications of GIS in Health Research. West Nile virus
 Applications of GIS in Health Research West Nile virus Outline Part 1. Applications of GIS in Health research or spatial epidemiology Disease Mapping Cluster Detection Spatial Exposure Assessment Assessment
emerge Network: CERC Survey Survey Sampling Data Preparation
 emerge Network: CERC Survey Survey Sampling Data Preparation Overview The entire patient population does not use inpatient and outpatient clinic services at the same rate, nor are racial and ethnic subpopulations
INSIDE. Metric Descriptions by Topic Area. Data Sources and Methodology by Topic Area. Technical Appendix
 As part of the Chicago Neighborhoods 2015 (CN2015) project, the Institute for Housing Studies at DePaul University collected data and built metrics to help The Chicago Community Trust and the City of Chicago
GIS in Locating and Explaining Conflict Hotspots in Nepal
 GIS in Locating and Explaining Conflict Hotspots in Nepal Lila Kumar Khatiwada Notre Dame Initiative for Global Development 1 Outline Brief background Use of GIS in conflict study Data source Findings
Table B1. Full Sample Results OLS/Probit
 Table B1. Full Sample Results OLS/Probit School Propensity Score Fixed Effects Matching (1) (2) (3) (4) I. BMI: Levels School 0.351* 0.196* 0.180* 0.392* Breakfast (0.088) (0.054) (0.060) (0.119) School
Defining Statistically Significant Spatial Clusters of a Target Population using a Patient-Centered Approach within a GIS
 Defining Statistically Significant Spatial Clusters of a Target Population using a Patient-Centered Approach within a GIS Efforts to Improve Quality of Care Stephen Jones, PhD Bio-statistical Research
An Assessment of People, Place and Business on Syracuse s Near Northside
 An Assessment of People, Place and Business on Syracuse s Near Northside May 2013 Report produced by Jon Glass, Kelly Montague and Mark Pawliw Edited by Jon Glass and Jonnell Robinson Syracuse Community
The Cost of Transportation : Spatial Analysis of US Fuel Prices
 The Cost of Transportation : Spatial Analysis of US Fuel Prices J. Raimbault 1,2, A. Bergeaud 3 juste.raimbault@polytechnique.edu 1 UMR CNRS 8504 Géographie-cités 2 UMR-T IFSTTAR 9403 LVMT 3 Paris School
GIS for the Non-Expert
 GIS for the Non-Expert Ann Forsyth University of Minnesota February 2006 GIS for the Non-Expert 1. Definitions and problems 2. Measures being tested in Twin Cities Walking Study Basic approach, data, variables
Do the Causes of Poverty Vary by Neighborhood Type?
 Do the Causes of Poverty Vary by Neighborhood Type? Suburbs and the 2010 Census Conference Uday Kandula 1 and Brian Mikelbank 2 1 Ph.D. Candidate, Maxine Levin College of Urban Affairs Cleveland State
GEOGRAPHY 204: STATISTICAL PROBLEM SOLVING IN GEOGRAPHY
 GEOGRAPHY 204: STATISTICAL PROBLEM SOLVING IN GEOGRAPHY CHAPTER 2: GEOGRAPHIC DATA Primary data - acquired directly from the original source In situ or in the field Costly time and money! Campus bike racks
3. When a researcher wants to identify particular types of cases for in-depth investigation; purpose less to generalize to larger population than to g
 Chapter 7: Qualitative and Quantitative Sampling Introduction Quantitative researchers more concerned with sampling; primary goal to get a representative sample (smaller set of cases a researcher selects
AP Statistics Chapter 7 Multiple Choice Test
 Class: Date: AP Statistics Chapter 7 Multiple Choice Test Multiple Choice Identify the choice that best completes the statement or answers the question. 1. The central limit theorem refers to which of
Environmental Justice and the Environmental Protection Agency s Superfund Program
 Environmental Justice and the Environmental Protection Agency s Superfund Program Brian Alt Advance GIS 26 April 2011 Introduction In the late 1970 s the Environmental Protection Agency, the United States
The Journal of Database Marketing, Vol. 6, No. 3, 1999, pp Retail Trade Area Analysis: Concepts and New Approaches
 Retail Trade Area Analysis: Concepts and New Approaches By Donald B. Segal Spatial Insights, Inc. 4938 Hampden Lane, PMB 338 Bethesda, MD 20814 Abstract: The process of estimating or measuring store trade
Transportation and Social Equity as a Way to Alleviate Poverty
 Transportation and Social Equity as a Way to Alleviate Poverty The Case of Low-Income Neighborhoods in Savannah, GA Vishanya F. Forbes1, Dr. Deden Rukmana2 What is Social Equity? It s a term that implies
Socioeconomic Disparities, Community Physical Environment, and Childhood Obesity in Alabama s Black Belt Region. William Mitchell Carter
 Socioeconomic Disparities, Community Physical Environment, and Childhood Obesity in Alabama s Black Belt Region by William Mitchell Carter A thesis submitted to the Graduate Faculty of Auburn University
Keywords: Air Quality, Environmental Justice, Vehicle Emissions, Public Health, Monitoring Network
 NOTICE: this is the author s version of a work that was accepted for publication in Transportation Research Part D: Transport and Environment. Changes resulting from the publishing process, such as peer
COLUMN. Spatial Analysis in R: Part 2 Performing spatial regression modeling in R with ACS data
 Spatial Demography 2013 1(2): 219-226 http://spatialdemography.org OPEN ACCESS via Creative Commons 3.0 ISSN 2164-7070 (online) COLUMN Spatial Analysis in R: Part 2 Performing spatial regression modeling
Social Epidemiology and Spatial Epidemiology: An Empirical Comparison of Perspectives
 Social Epidemiology and Spatial Epidemiology: An Empirical Comparison of Perspectives A DISSERTATION SUBMITTED TO THE FACULTY OF THE GRADUATE SCHOOL OF THE UNIVERSITY OF MINNESOTA BY Kelsey Nathel McDonald
GROWING APART: THE CHANGING FIRM-SIZE WAGE PREMIUM AND ITS INEQUALITY CONSEQUENCES ONLINE APPENDIX
 GROWING APART: THE CHANGING FIRM-SIZE WAGE PREMIUM AND ITS INEQUALITY CONSEQUENCES ONLINE APPENDIX The following document is the online appendix for the paper, Growing Apart: The Changing Firm-Size Wage
An online data and consulting resource of THE UNIVERSITY OF TOLEDO THE JACK FORD URBAN AFFAIRS CENTER
 An online data and consulting resource of THE JACK FORD URBAN AFFAIRS CENTER THE CENTER FOR GEOGRAPHIC INFORMATION SCIENCE AND APPLIED GEOGRAPHICS DEPARTMENT OF GEOGRAPHY AND PLANNING THE UNIVERSITY OF
Dr Arulsivanathan Naidoo Statistics South Africa 18 October 2017
 ESRI User Conference 2017 Space Time Pattern Mining Analysis of Matric Pass Rates in Cape Town Schools Dr Arulsivanathan Naidoo Statistics South Africa 18 October 2017 Choose one of the following Leadership
SPATIAL ACCESSIBILITY IN FOOD DESERTS. A Thesis in Industrial Engineering by Varun Sudhurshun Chellappa Varun Sudhurshun Chellappa
 The Pennsylvania State University The Graduate School Department of Industrial and Manufacturing Engineering SPATIAL ACCESSIBILITY IN FOOD DESERTS A Thesis in Industrial Engineering by Varun Sudhurshun
Spatial Dynamics of the Local Built Environment in the City of Chicago: An Investigation of Data Sources and Methods
 Spatial Dynamics of the Local Built Environment in the City of Chicago: An Investigation of Data Sources and Methods Michael D. Bader Jennifer A. Ailshire Department of Sociology and Population Studies
Polarization and Protests: Understanding Complex Social and Political Processes Using Spatial Data and Agent-Based Modeling Simulations
 Polarization and Protests: Understanding Complex Social and Political Processes Using Spatial Data and Agent-Based Modeling Simulations Lefteris Anastasopoulos PhD, UC Berkeley (Political Science) MA,
A User s Guide to the Federal Statistical Research Data Centers
 A User s Guide to the Federal Statistical Research Data Centers Mark Roberts Professor of Economics and Director PSU FSRDC September 2016 M. Roberts () RDC User s Guide September 2016 1 / 14 Outline Introduction
Final Project: An Income and Education Study of Washington D.C.
 Final Project: An Income and Education Study of Washington D.C. Barbara J. McKay Archibald Geography 586 Dr. Justine Blanford 12 December, 2009 As the seat of the United States Federal Government, Washington
The Geography of Social Change
 The Geography of Social Change Alessandra Fogli Stefania Marcassa VERY PRELIMINARY DRAFT Abstract We investigate how and when social change arises. We use data on the spatial diffusion of the fertility
STAR COMMUNITY RATING SYSTEM OBJECTIVE EE-4: EQUITABLE SERVICES & ACCESS COMMUNITY LEVEL OUTCOMES FOR KING COUNTY, WA
 STAR COMMUNITY RATING SYSTEM OBJECTIVE EE-4: EQUITABLE SERVICES & ACCESS COMMUNITY LEVEL OUTCOMES FOR KING COUNTY, WA OUTCOME I: EQUITABLE ACCESS AND PROXIMITY Background: This analysis has been developed
The Trade Area Analysis Model
 The Trade Area Analysis Model Trade area analysis models encompass a variety of techniques designed to generate trade areas around stores or other services based on the probability of an individual patronizing
Understanding China Census Data with GIS By Shuming Bao and Susan Haynie China Data Center, University of Michigan
 Understanding China Census Data with GIS By Shuming Bao and Susan Haynie China Data Center, University of Michigan The Census data for China provides comprehensive demographic and business information
Empowering Local Health through GIS
 Empowering Local Health through GIS Mapping data from Washington s Immunization Information System (IIS). Presented to IACW October 16 th, 2013 by: Chris Halsell and Isaiah Berg Agenda IIS Overview Why
Lecture 3: Exploratory Spatial Data Analysis (ESDA) Prof. Eduardo A. Haddad
 Prof. Eduardo A. Haddad") Lecture 3: Exploratory Spatial Data Analysis (ESDA) Prof. Eduardo A. Haddad Key message Spatial dependence First Law of Geography (Waldo Tobler): Everything is related to everything else, but near things
Lecture 3: Exploratory Spatial Data Analysis (ESDA) Prof. Eduardo A. Haddad Key message Spatial dependence First Law of Geography (Waldo Tobler): Everything is related to everything else, but near things
NEW YORK DEPARTMENT OF SANITATION. Spatial Analysis of Complaints
 NEW YORK DEPARTMENT OF SANITATION Spatial Analysis of Complaints Spatial Information Design Lab Columbia University Graduate School of Architecture, Planning and Preservation November 2007 Title New York
Big-Geo-Data EHR Infrastructure Development for On-Demand Analytics
 Big-Geo-Data EHR Infrastructure Development for On-Demand Analytics Sohayla Pruitt, MA Senior Geospatial Scientist Duke Medicine DUHS DHTS EIM HIRS Page 1 Institute of Medicine, World Health Organization,
Estimating Neighborhood Environments from Survey Data
 Estimating Neighborhood Environments from Survey Data Ikuho Yamada Interfaculty Initiative in Information Studies Center for Spatial Information Science ersity of Tokyo Research themes Keywords Geographic
Urban GIS for Health Metrics
 Urban GIS for Health Metrics Dajun Dai Department of Geosciences, Georgia State University Atlanta, Georgia, United States Presented at International Conference on Urban Health, March 5 th, 2014 People,
 TABLE I SUMMARY STATISTICS a Sample Falls Within
 Understanding and accessing 2011 census aggregate data
 Understanding and accessing 2011 census aggregate data 4 July 11:00 to 16:00 BST Justin Hayes and Richard Wiseman UK Data Service Census Support UK censuses provide an unparalleled resource of high quality
Lecture 3: Exploratory Spatial Data Analysis (ESDA) Prof. Eduardo A. Haddad
 Prof. Eduardo A. Haddad") Lecture 3: Exploratory Spatial Data Analysis (ESDA) Prof. Eduardo A. Haddad Key message Spatial dependence First Law of Geography (Waldo Tobler): Everything is related to everything else, but near things
Lecture 3: Exploratory Spatial Data Analysis (ESDA) Prof. Eduardo A. Haddad Key message Spatial dependence First Law of Geography (Waldo Tobler): Everything is related to everything else, but near things
Data Collection. Lecture Notes in Transportation Systems Engineering. Prof. Tom V. Mathew. 1 Overview 1
 Data Collection Lecture Notes in Transportation Systems Engineering Prof. Tom V. Mathew Contents 1 Overview 1 2 Survey design 2 2.1 Information needed................................. 2 2.2 Study area.....................................
FOOD DESERTED: RACE, POVERTY, AND FOOD VULNERABILITY IN ATLANTA,
 FOOD DESERTED: RACE, POVERTY, AND FOOD VULNERABILITY IN ATLANTA, 1980-2010 A Dissertation Presented to The Academic Faculty by Gloria Ross In Partial Fulfillment of the Requirements for the Degree Doctor
Hennepin GIS. Tree Planting Priority Areas - Analysis Methodology. GIS Services April 2018 GOAL:
 Hennepin GIS GIS Services April 2018 Tree Planting Priority Areas - Analysis Methodology GOAL: To create a GIS data layer that will aid Hennepin County Environment & Energy staff in determining where to
Geographic Systems and Analysis
 Geographic Systems and Analysis New York University Robert F. Wagner Graduate School of Public Service Instructor Stephanie Rosoff Contact: stephanie.rosoff@nyu.edu Office hours: Mondays by appointment
The Pennsylvania State University. The Graduate School. The College of Liberal Arts CONTEXTUAL INFLUENCES ON OBESITY PREVALENCE:
 The Pennsylvania State University The Graduate School The College of Liberal Arts CONTEXTUAL INFLUENCES ON OBESITY PREVALENCE: A SPATIALLY EXPLICIT ANALYSIS A Thesis in Sociology and Demography by Nyesha
Spatial clustering of physical activity and obesity in relation to built environment factors among older women in three U.S.
 Tamura et al. BMC Public Health 2014, 14:1322 RESEARCH ARTICLE Open Access Spatial clustering of physical activity and obesity in relation to built environment factors among older women in three U.S. states
Exercise on Using Census Data UCSB, July 2006
 Exercise on Using Census Data UCSB, July 2006 Purpose The purpose of this lab is to become familiar with Census Bureau data. Second, we will learn how to join tables which allows you to add data to the
Rural Alabama. Jennifer Zanoni. Geography Division U.S. Census Bureau. Alabama State Data Center 2018 Data Conference Tuscaloosa, Alabama
 Rural Alabama Jennifer Zanoni Geography Division U.S. Census Bureau Alabama State Data Center 2018 Data Conference Tuscaloosa, Alabama May 17, 2018 Agenda Census Geography Urban/Rural Definitions County-based
Institutional Research with Public Data and Open Source Software
 2017 Institutional Research with Public Data and Open Source Software DUE1304591, 1644409, 1700496 Opinions expressed are those of the authors and not necessarily those of the National Science Foundation.
Analyzing the Geospatial Rates of the Primary Care Physician Labor Supply in the Contiguous United States
 Analyzing the Geospatial Rates of the Primary Care Physician Labor Supply in the Contiguous United States By Russ Frith Advisor: Dr. Raid Amin University of W. Florida Capstone Project in Statistics April,
Indicators of sustainable development: framework and methodologies CSD Indicators of sustainable development 1996
 Indicators of sustainable development: framework and methodologies CSD Indicators of sustainable development 1996 Keywords: mountain areas, mountain development, natural resources management, sustainable
Developing Small-Area Health and Exposure Data for the Use in Environmental Public Health Tracking. Alberto Manuel Ortega-Hinojosa
 Developing Small-Area Health and Exposure Data for the Use in Environmental Public Health Tracking by Alberto Manuel Ortega-Hinojosa A dissertation submitted in partial satisfaction of the Requirements
Typical information required from the data collection can be grouped into four categories, enumerated as below.
 Chapter 6 Data Collection 6.1 Overview The four-stage modeling, an important tool for forecasting future demand and performance of a transportation system, was developed for evaluating large-scale infrastructure
Using Urban Commuting Data to Calculate a Spatiotemporal Accessibility Measure for Food Environment Studies
 Published as: Widener, M.J., Farber, S., Neutens, T. & Horner, M.W. (2013). Using Urban Commuting Data to Calculate a Spatiotemporal Accessibility Measure for Food Environment Studies. Health & Place,
Local Economic Activity Around Rapid Transit Stations
 Local Economic Activity Around Rapid Transit Stations The Case of Chicago s Orange Line Julie Cooper, MPP 2014 Harris School of Public Policy Transport Chicago June 6, 2014 Motivation Impacts of transit