GEOGRAPHY 204: STATISTICAL PROBLEM SOLVING IN GEOGRAPHY
|
|
|
- Prosper Goodwin
- 6 years ago
- Views:
Transcription
1 GEOGRAPHY 204: STATISTICAL PROBLEM SOLVING IN GEOGRAPHY


2 CHAPTER 2: GEOGRAPHIC DATA Primary data - acquired directly from the original source In situ or in the field Costly time and money! Campus bike racks
3 GEOGRAPHIC DATA Secondary (or archival) data - collected by an organization or government agency Processed/organized accessible and formatted Less time and expense Often comprehensive census Ex. US Census data, Maryland land use, USGS National Hydrologic dataset Potential issues/errors: improperly collected/summarized out-of-date as soon as its measured!

4 Ponds in Wicomico County: Three primary sources Differences.hmm
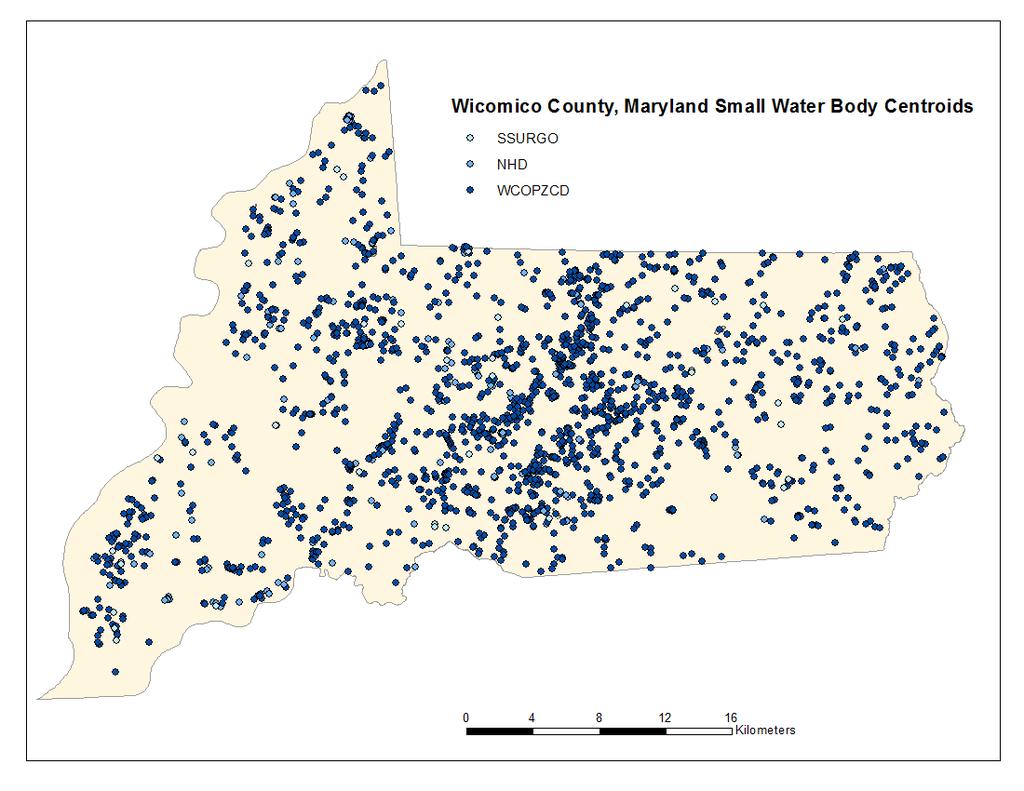
5

6 PRIMARY DATA COLLECTION Often sampling is necessary. Direct observation E.g., Traffic counts, etc.. Field measurement Mail questionnaires Personal/telephone interviews Survey Design: Very important! Pilot tests Question interpretation/wording Erroneous responses?!? Logistics Absences Refusals
7 GEOGRAPHIC STUDIES - TYPES Explicitly spatial - locations or placement of the observations or units of data are themselves directly analyzed Spatial statistics: examine patterns for randomness Ex. diseased trees in national forest, farms in a watershed Clustered or randomly distributed Implicitly spatial observations or units of data represent locations or places, but the locations themselves are not directly analyzed Ex. relationship between house values and age Neighborhood not individual locational pattern
8
9
10


11 Blue: wet counties Red: dry counties Yellow: restrictions partially dry, municipalities within dry
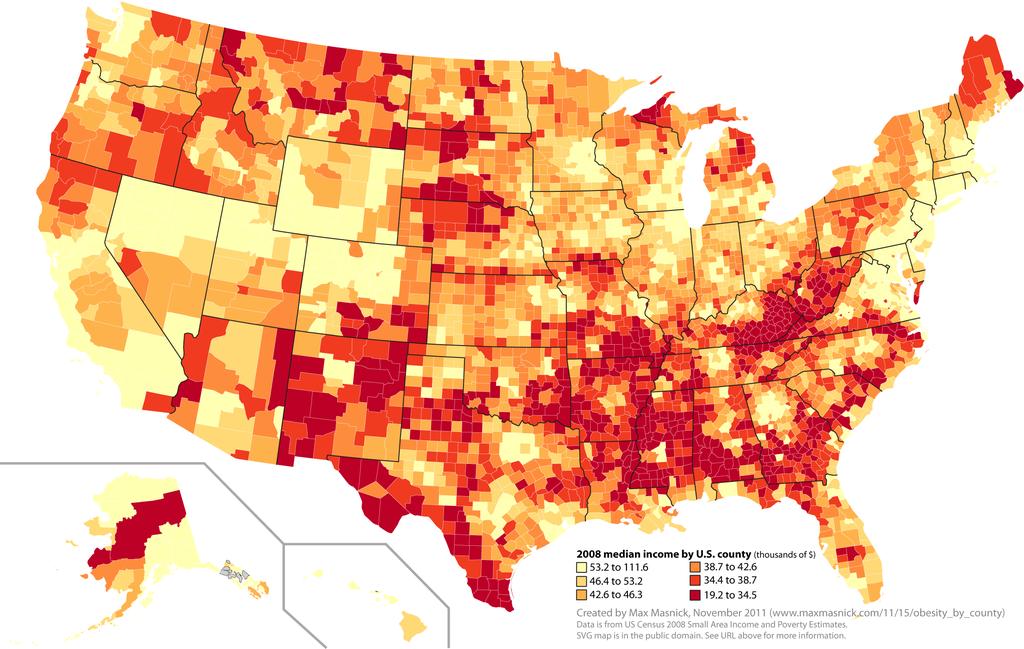
12 GEOGRAPHIC STUDIES Individual-level data sets - each data value represents an individual element of the phenomena under study Ex. tree circumference, SU student interview about parking Random sample of Nigerian women seeking information about fertility Spatially-aggregated data sets each value represents a summary or spatial aggregation of individual units of information for a particular place or area Ex. Maryland median income by county, Alcohol laws by county Birth rate estimates for all administrative divisions in Nigeria to estimate nationwide fertility Ecological fallacy invalid transfer of conclusions from spatiallyaggregated analysis to smaller areas or individual level Transfer results or apply conclusions down Ex. Nigerian district with low birth rates some women in district may not use birth control for family planning Aggregating individual-level data to a larger spatial unit is generally NOT problematic! Often used as the method to determine higher level, spatial estimates
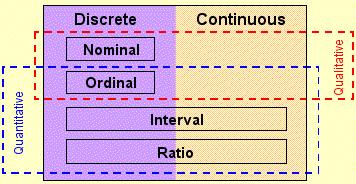
13 DATASET VARIABLE CHARACTERIZATION Discrete variable some restriction placed on the values a variable can assume Result from counting or tabulating the number of items (whole integer) Ex. number of households, number of active volcanoes Continuous variable infinitely-large number of possible values along some interval of a real number line Result from measurement values expressed as decimals Ex. precipitation, area in forest, commute distance/time Importance: Probability distributions change coming soon!
14 DATASET VARIABLE CHARACTERIZATION Quantitative data observations or responses expressed numerically Units of data are assigned numeric values Qualitative data each observation is assigned to one or more categories Ex. Type of land cover: agriculture, forest, residential, commercial, etc., primary cash crop Frequency counts - number of observations assigned to non-numerical categories
15 Frequency Aesthetic Agriculture Borrow Pit Impoundment Stormwater Other Category
16 Count 1000 Small Water Bodies OBJECTID Cat_1 Area_ha Area_acre DataSource 1 Agriculture USGS 2 Extractive USGS 4 Extractive USGS 5 Stormwater USGS 7 Extractive USGS 8 Extractive USGS Area (m2)

17 LEVELS OF MEASUREMENT Measurement levels of data inform the selection of the appropriate statistical technique
18 NOMINAL Each variable is given a name and assigned to at least two qualitative classes or categories Only relationship between categories is different Simplest scale, non-numerical Condition: categories must be exhaustive and mutually exclusive Exhaustive every value or unit of data can be assigned to a category Mutually exclusive cannot assign a value to more than one category No overlap Other can be used


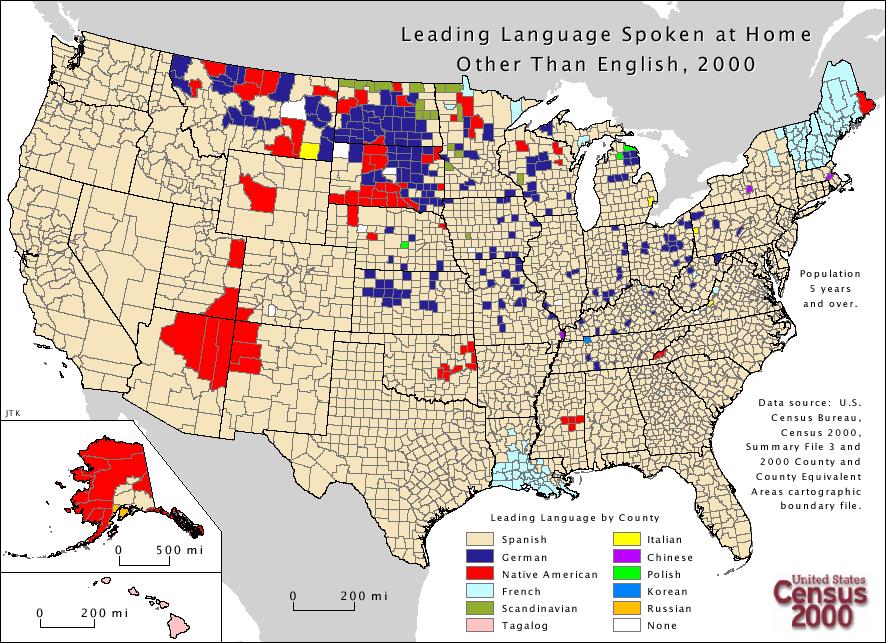
19 NOMINAL DATA: EXAMPLES Individuals religious affiliation dichotomous: only two options Gender, yes-no, presence-absence Cities primary industry? Countries language family
20

21 OBJECTID Cat_1 DataSource 1 Agriculture USGS 2 Extractive USGS 4 Extractive USGS 5 Stormwater USGS 7 Extractive USGS 8 Extractive USGS
22 ORDINAL SCALE Quantitative distinctions can be made Rank order greater than or less than Strongly-ordered: each value or unit of data is given a particular position in a rank order sequence Ex. 10 best college towns, Countries GNP Each assigned preference rank (1 to 10) Remember: 2 nd ranked town is not twice as good as 4 th ranked town
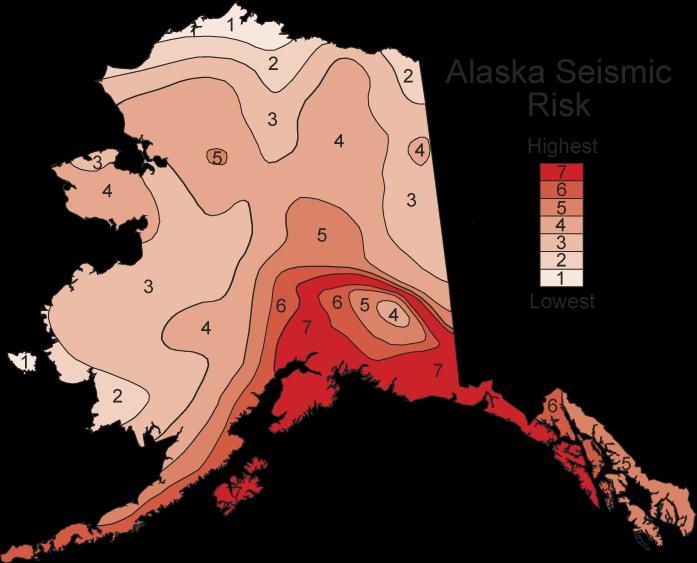
23 ORDINAL SCALE Weakly-ordered: values are placed in categories and resulting categories are ranked Ex. Choropleth map - % population change for US counties between 2000 and categories (< 0%, 0 to 10%, 10.1% to 15%, 15.1% to 25%, greater than 25%) Generate frequency counts for the number of counties in each category weakly ordered Two counties may have different values but in same category

24

25 Best College Towns: American Institute for Economic Research 9. Charlottesville, VA 8. Blacksburg, VA 7. Champaign, IL 6. Corvallis, OR 5. Iowa City, IA 4. Crestview, FL 3. State College, PA 2. Ames, IA 1. Ithaca, N.Y. Often based on composite variables
26
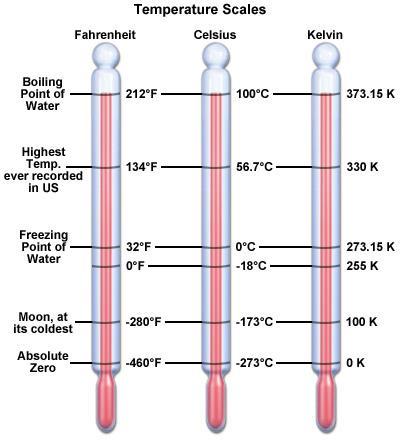
27 INTERVAL AND RATIO SCALES Magnitude of differences between values can be determined Length of interval between any two units of data can be measured on a scale Interval data origin or zero starting point is arbitrary Ex. Fahrenheit and Celsius temperature scale Ratio scale - natural zero is used, ratios between values can be determined Ex. Rainfall: 40 inches, Montreal, 10 inches Chihuahua 40/10 = 4, four times as much rainfall Examples: Kelvin, distance, area, median income, etc.
28
29
30 MEASUREMENT SCALE Observations from same variable can be expressed at different measurement scales depending on how they are measured, organized, and displayed Ex. Resource planner Type of Energy Use in Homes Individual households Nominal primary type of energy (coal, gas, oil, wood, etc.) County-level summaries Strongly-ordered ordinal: % of households using natural gas by county Weakly-ordered ordinal: Choropleth map of % of households using natural gas Ratio scale: number of households by county using natural gas
31 MEASUREMENT CONCEPTS Measurement Error: Precision and Accuracy Precision: level of exactness associated with measurement Ex. rain gauge tipping bucket calibration every.10 inch vs..01 inches 1.2 to 1.3 inches, 1.21 to 1.22 inches Spurious precision: Computer/calculator produces many decimal places..real? meaningful? 5.2/3 =
32 MEASUREMENT CONCEPTS Accuracy: the extent of system-wide bias in the measurement process Ex. rain gauge Precise instrument, calibrated badly 1.19 inches recorded, 1.27 inches actually fell How do you know? Difficult.
33
34 MEASUREMENT CONCEPTS Validity: measurement issues related to the nature, meaning, or definition of concept or variable Assigning true or appropriate meaning to concepts through measurement of a simple variable or set of variables Complex concepts: Ex. quality of life, economic well-being Operational definitions: true meaning is not possible Indirect or surrogate method to best define complex concept Ex. quality of education evaluate by average student score on California Achievement Exam in elementary school, percent of graduates who subsequently go to college in high school Degree of validity difficult to assess, often ignored Good research MUST be addressed!
35 MEASUREMENT CONCEPTS Reliability: consistency and stability of measure/data Geographic data: temporally and spatially varying Consistent data collection methods? Ex. water quality same depth, time since rainfall event, etc. Consistent classification/categorization methods? Ex. poverty same definition 2010, 2000, 1970? Problematic: developing countries Assess reliability test-retest procedure Behavioral geography survey or questionnaire Collect data from respondents at twice!
36 BASIC CLASSIFICATION METHODS Why and how do we classify or categorize data? Classification organizes, simplifies and generalizes large amounts of information into effective or meaningful categories clarifies communication, reveals spatial patterns organized according to degree of similarity Minimizes within group dispersion and maximizes between group differences Categories must be mutually exclusive and exhaustive!

37 BASIC CLASSIFICATION METHODS Result: Information lost Generalization and simplification Individual-level values aggregated: spatial units classes
38 CLASSIFICATION Conceptual Strategies Subdivision (logical subdivision): all units of data in a population are grouped together and then individual values are allocated to an appropriate subdivision using carefully defined criteria Clear, consistent set of rules used to assign values to proper class Top down, hierarchical approach Characteristics of each category pre-determined
39 CLASSIFICATION: LOGICAL SUBDIVISION Ex. USGS National Land Cover Dataset (NLCD) Landsat-based 30m pixels Level I and II

40 CLASSIFICATION: LOGICAL SUBDIVISION
41 CLASSIFICATION: LOGICAL SUBDIVISION Ex. North American Industry Classification System (NAICS)
42 CLASSIFICATION Agglomeration: each observation in a population or data set is separate and distinct from others to begin classification Examine each value and allocate to classes using well-defined grouping criteria Combine like, separate unlike Bottom up approach Frequently used in geography numerically or graphically aggregated
43 CLASSIFICATION: AGGLOMERATION

44 CLASSIFICATION: OPERATIONAL PROCEDURES Practical application: often mixture of subdivision and agglomeration
45 SINGLE-VARIABLE CLASSIFICATION METHODS Equal intervals based on range Range: difference in magnitude between the largest and smallest value in an interval-ratio data set Class breaks: the values that separate one class from another Procedure range is divided into the desired number of equal-width class intervals Ex. High=1856, Low=213, Range=1643, 4 classes (410.75) Classes: Considerations: based on extreme values, break values precise, unequal number of values in each category,
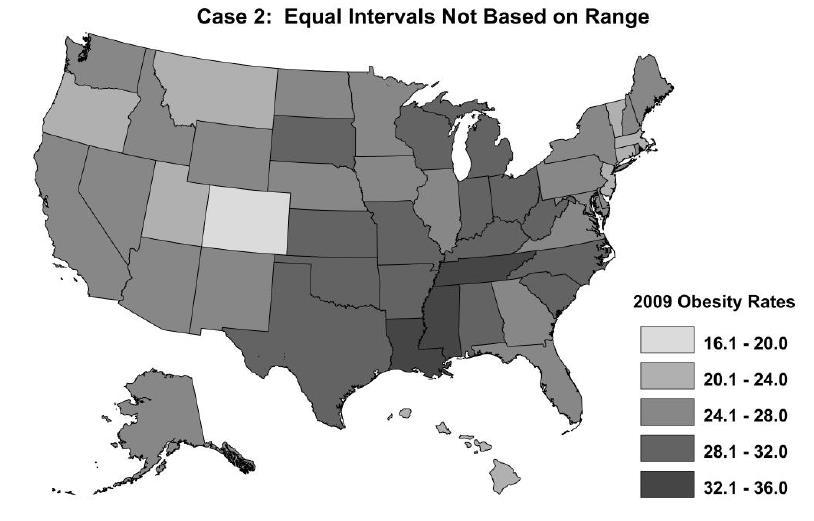
46 SINGLE-VARIABLE CLASSIFICATION METHODS Equal intervals not based on range Same equal interval class breaks however based on practical/convenient values, not range Often rounded Preferred for constructing frequency distribution, histogram, or ogive (graphical representations) Frequently used by government agencies Ex. High=1856, Low=213, Range=1643, 4 classes (410.75) Classes: 213 to to to to Considerations: Easy to understand and interpret, number of values in each category varies widely
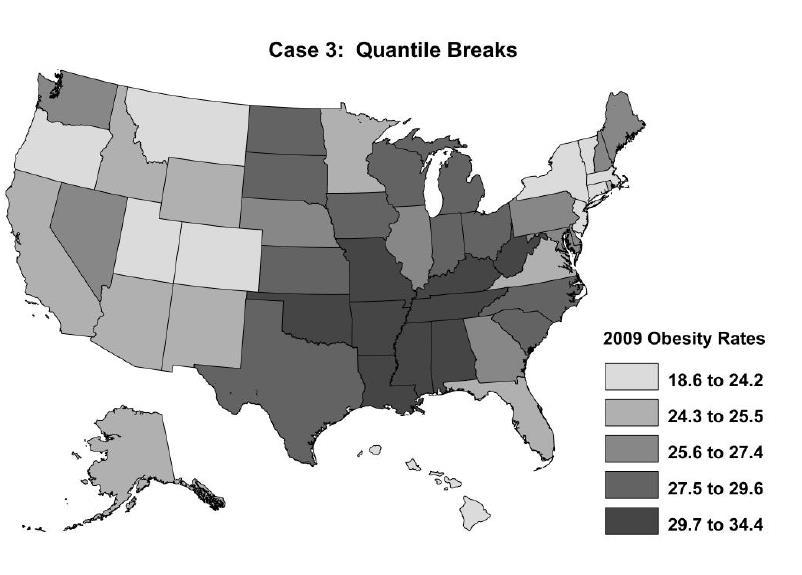
47 SINGLE-VARIABLE CLASSIFICATION METHODS Quantile Total number of values is divided as equally as possible into the desired number of classes Equalize number of values in each class Quartiles (four classes),quintiles (five classes) Considerations: Choropleth mapping produces even distribution of areas within classes on map area Class breaks not rounded, uneven interval widths Data clustered, split unnaturally
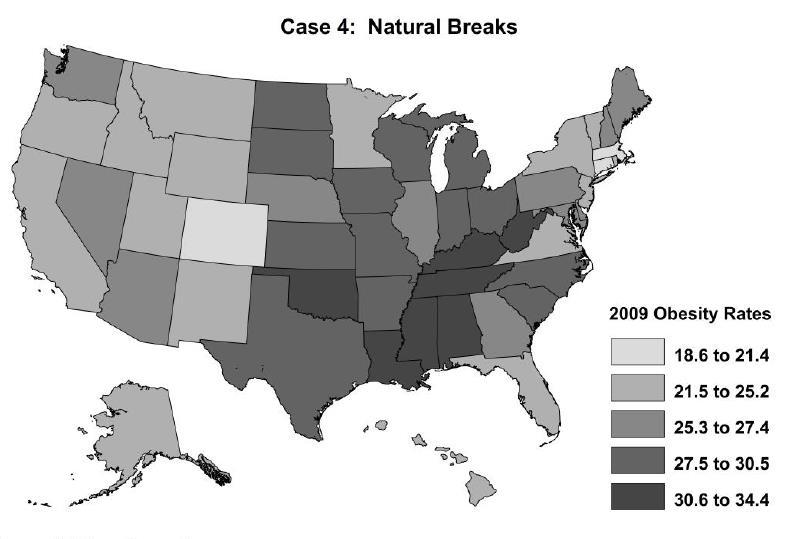
48 SINGLE-VARIABLE CLASSIFICATION METHODS Natural Breaks Single linkage: identify natural breaks in the data and separate values into different classes based on these breaks Iterative identify largest gap between values on number line, then the second largest gap, until desired number class breaks is achieved Groups similar values, highlights extreme values Clusters large number of values in one or two categories
49
50 CHOROPLETH MAPPING Ideal number of classes? Trade-off between generalization and sufficient detail 4 to 7 tend to be effective 5 classes in the following examples 4 class breaks
51
52 Dendrogram graphically depicts step-by-step, single linkage natural breaks process Outliers extreme values in data set Adversely affect natural breaks classification method
53 CLASSIFICATION RESULTS All portray the same data differently! Starkest contrasts? Considerations Do three states really have an obesity rate of exactly 24.6%?
2/2/2015 GEOGRAPHY 204: STATISTICAL PROBLEM SOLVING IN GEOGRAPHY MEASURES OF CENTRAL TENDENCY CHAPTER 3: DESCRIPTIVE STATISTICS AND GRAPHICS
 Spring 2015: Lembo GEOGRAPHY 204: STATISTICAL PROBLEM SOLVING IN GEOGRAPHY CHAPTER 3: DESCRIPTIVE STATISTICS AND GRAPHICS Descriptive statistics concise and easily understood summary of data set characteristics
GED 554 IT & GIS. Lecture 6 Exercise 5. May 10, 2013
 GED 554 IT & GIS Lecture 6 Exercise 5 May 10, 2013 Free GIS data sources ******************* Mapping numerical data & Symbolization ******************* Exercise: Making maps for presentation GIS DATA SOFTWARE
Sampling Populations limited in the scope enumerate
 Sampling Populations Typically, when we collect data, we are somewhat limited in the scope of what information we can reasonably collect Ideally, we would enumerate each and every member of a population
Workbook Exercises for Statistical Problem Solving in Geography
 Workbook Exercises for Statistical Problem Solving in Geography Arthur J. Lembo, Jr. This workbook is for use with the popular textbook Introduction to Statistical Problem Solving in Geography, and includes
Chapter 7: Making Maps with GIS. 7.1 The Parts of a Map 7.2 Choosing a Map Type 7.3 Designing the Map
 Chapter 7: Making Maps with GIS 7.1 The Parts of a Map 7.2 Choosing a Map Type 7.3 Designing the Map What is a map? A graphic depiction of all or part of a geographic realm in which the real-world features
Chapter 2 Solutions Page 15 of 28
 Chapter Solutions Page 15 of 8.50 a. The median is 55. The mean is about 105. b. The median is a more representative average" than the median here. Notice in the stem-and-leaf plot on p.3 of the text that
Representation of Geographic Data
 GIS 5210 Week 2 The Nature of Spatial Variation Three principles of the nature of spatial variation: proximity effects are key to understanding spatial variation issues of geographic scale and level of
Geog183: Cartographic Design and Geovisualization Winter Quarter 2017 Lecture 6: Map types and Data types
 Geog183: Cartographic Design and Geovisualization Winter Quarter 2017 Lecture 6: Map types and Data types Data types Data dimension: Point, Line, Area, Volume (Text) Data continuity: Discrete, Point, Polygon:
Section 2.1 ~ Data Types and Levels of Measurement. Introduction to Probability and Statistics Spring 2017
 Section 2.1 ~ Data Types and Levels of Measurement Introduction to Probability and Statistics Spring 2017 Objective To be able to classify data as qualitative or quantitative, to identify quantitative
USING DOWNSCALED POPULATION IN LOCAL DATA GENERATION
 USING DOWNSCALED POPULATION IN LOCAL DATA GENERATION A COUNTRY-LEVEL EXAMINATION CONTENT Research Context and Approach. This part outlines the background to and methodology of the examination of downscaled
(quantitative or categorical variables) Numerical descriptions of center, variability, position (quantitative variables)
 Numerical descriptions of center, variability, position (quantitative variables)") 3. Descriptive Statistics Describing data with tables and graphs (quantitative or categorical variables) Numerical descriptions of center, variability, position (quantitative variables) Bivariate descriptions
3. Descriptive Statistics Describing data with tables and graphs (quantitative or categorical variables) Numerical descriptions of center, variability, position (quantitative variables) Bivariate descriptions
Vehicle Freq Rel. Freq Frequency distribution. Statistics
 1.1 STATISTICS Statistics is the science of data. This involves collecting, summarizing, organizing, and analyzing data in order to draw meaningful conclusions about the universe from which the data is
2.2 Geographic phenomena
 2.2. Geographic phenomena 66 2.2 Geographic phenomena 2.2. Geographic phenomena 67 2.2.1 Defining geographic phenomena A GIS operates under the assumption that the relevant spatial phenomena occur in a
Introduction to Statistics
 Why Statistics? Introduction to Statistics To develop an appreciation for variability and how it effects products and processes. Study methods that can be used to help solve problems, build knowledge and
Basic Verification Concepts
 Basic Verification Concepts Barbara Brown National Center for Atmospheric Research Boulder Colorado USA bgb@ucar.edu Basic concepts - outline What is verification? Why verify? Identifying verification
What is a map? A simple representation of the real world Two types of maps
 Mapping with GIS What is a map? A simple representation of the real world Two types of maps Reference maps showing reference features such as roads, locations, political boundaries, cities etc. Thematic
Lecture 5. Symbolization and Classification MAP DESIGN: PART I. A picture is worth a thousand words
 Lecture 5 MAP DESIGN: PART I Symbolization and Classification A picture is worth a thousand words Outline Symbolization Types of Maps Classifying Features Visualization Considerations Symbolization Symbolization
Quality and Coverage of Data Sources
 Quality and Coverage of Data Sources Objectives Selecting an appropriate source for each item of information to be stored in the GIS database is very important for GIS Data Capture. Selection of quality
Hennepin GIS. Tree Planting Priority Areas - Analysis Methodology. GIS Services April 2018 GOAL:
 Hennepin GIS GIS Services April 2018 Tree Planting Priority Areas - Analysis Methodology GOAL: To create a GIS data layer that will aid Hennepin County Environment & Energy staff in determining where to
POPULATION AND SAMPLE
 1 POPULATION AND SAMPLE Population. A population refers to any collection of specified group of human beings or of non-human entities such as objects, educational institutions, time units, geographical
STATISTICS ( CODE NO. 08 ) PAPER I PART - I
 PAPER I PART - I") STATISTICS ( CODE NO. 08 ) PAPER I PART - I 1. Descriptive Statistics Types of data - Concepts of a Statistical population and sample from a population ; qualitative and quantitative data ; nominal and
STATISTICS ( CODE NO. 08 ) PAPER I PART - I 1. Descriptive Statistics Types of data - Concepts of a Statistical population and sample from a population ; qualitative and quantitative data ; nominal and
Rural Pennsylvania: Where Is It Anyway? A Compendium of the Definitions of Rural and Rationale for Their Use
 Rural Pennsylvania: Where Is It Anyway? A Compendium of the Definitions of Rural and Rationale for Their Use Pennsylvania Office of Rural Health 310 Nursing Sciences Building University Park, PA 16802
Ø Set of mutually exclusive categories. Ø Classify or categorize subject. Ø No meaningful order to categorization.
 Statistical Tools in Evaluation HPS 41 Dr. Joe G. Schmalfeldt Types of Scores Continuous Scores scores with a potentially infinite number of values. Discrete Scores scores limited to a specific number
What is Statistics? Statistics is the science of understanding data and of making decisions in the face of variability and uncertainty.
 What is Statistics? Statistics is the science of understanding data and of making decisions in the face of variability and uncertainty. Statistics is a field of study concerned with the data collection,
Applied Statistics in Business & Economics, 5 th edition
 A PowerPoint Presentation Package to Accompany Applied Statistics in Business & Economics, 5 th edition David P. Doane and Lori E. Seward Prepared by Lloyd R. Jaisingh McGraw-Hill/Irwin Copyright 2015
ECON1310 Quantitative Economic and Business Analysis A
 ECON1310 Quantitative Economic and Business Analysis A Topic 1 Descriptive Statistics 1 Main points - Statistics descriptive collecting/presenting data; inferential drawing conclusions from - Data types
Geographic Data Science - Lecture IV
 Geographic Data Science - Lecture IV Mapping Data Dani Arribas-Bel Today Mapping data MAUP Choropleths Definition Classes Cartograms Conditional maps Space-Time mapping Data maps Abstraction from the purely
Applying cluster analysis to 2011 Census local authority data
 Applying cluster analysis to 2011 Census local authority data Kitty.Lymperopoulou@manchester.ac.uk SPSS User Group Conference November, 10 2017 Outline Basic ideas of cluster analysis How to choose variables
FCE 3900 EDUCATIONAL RESEARCH LECTURE 8 P O P U L A T I O N A N D S A M P L I N G T E C H N I Q U E
 FCE 3900 EDUCATIONAL RESEARCH LECTURE 8 P O P U L A T I O N A N D S A M P L I N G T E C H N I Q U E OBJECTIVE COURSE Understand the concept of population and sampling in the research. Identify the type
Basic Verification Concepts
 Basic Verification Concepts Barbara Brown National Center for Atmospheric Research Boulder Colorado USA bgb@ucar.edu May 2017 Berlin, Germany Basic concepts - outline What is verification? Why verify?
Introducing GIS analysis
 1 Introducing GIS analysis GIS analysis lets you see patterns and relationships in your geographic data. The results of your analysis will give you insight into a place, help you focus your actions, or
Diamonds on the soles of scholarship?
 Educational Performance and Family Income Diamonds on the soles of scholarship? by Introduction Problem Two young girls entering elementary school in Boston aspire to be doctors. Both come from twoparent,
104 Business Research Methods - MCQs
 104 Business Research Methods - MCQs 1) Process of obtaining a numerical description of the extent to which a person or object possesses some characteristics a) Measurement b) Scaling c) Questionnaire
Using American Factfinder
 Using American Factfinder What is American Factfinder? American Factfinder is a search engine that provides access to the population, housing and economic data collected by the U.S. Census Bureau. It can
Typical information required from the data collection can be grouped into four categories, enumerated as below.
 Chapter 6 Data Collection 6.1 Overview The four-stage modeling, an important tool for forecasting future demand and performance of a transportation system, was developed for evaluating large-scale infrastructure
Data Collection. Lecture Notes in Transportation Systems Engineering. Prof. Tom V. Mathew. 1 Overview 1
 Data Collection Lecture Notes in Transportation Systems Engineering Prof. Tom V. Mathew Contents 1 Overview 1 2 Survey design 2 2.1 Information needed................................. 2 2.2 Study area.....................................
Sampling The World. presented by: Tim Haithcoat University of Missouri Columbia
 Sampling The World presented by: Tim Haithcoat University of Missouri Columbia Compiled with materials from: Charles Parson, Bemidji State University and Timothy Nyerges, University of Washington Introduction
General structural model Part 2: Categorical variables and beyond. Psychology 588: Covariance structure and factor models
 General structural model Part 2: Categorical variables and beyond Psychology 588: Covariance structure and factor models Categorical variables 2 Conventional (linear) SEM assumes continuous observed variables
GIST 4302/5302: Spatial Analysis and Modeling
 GIST 4302/5302: Spatial Analysis and Modeling Basics of Statistics Guofeng Cao www.myweb.ttu.edu/gucao Department of Geosciences Texas Tech University guofeng.cao@ttu.edu Spring 2015 Outline of This Week
Lectures of STA 231: Biostatistics
 Lectures of STA 231: Biostatistics Second Semester Academic Year 2016/2017 Text Book Biostatistics: Basic Concepts and Methodology for the Health Sciences (10 th Edition, 2014) By Wayne W. Daniel Prepared
Outline. Geographic Information Analysis & Spatial Data. Spatial Analysis is a Key Term. Lecture #1
 Geographic Information Analysis & Spatial Data Lecture #1 Outline Introduction Spatial Data Types: Objects vs. Fields Scale of Attribute Measures GIS and Spatial Analysis Spatial Analysis is a Key Term
Ø Set of mutually exclusive categories. Ø Classify or categorize subject. Ø No meaningful order to categorization.
 Statistical Tools in Evaluation HPS 41 Fall 213 Dr. Joe G. Schmalfeldt Types of Scores Continuous Scores scores with a potentially infinite number of values. Discrete Scores scores limited to a specific
Draft Proof - Do not copy, post, or distribute
 1 LEARNING OBJECTIVES After reading this chapter, you should be able to: 1. Distinguish between descriptive and inferential statistics. Introduction to Statistics 2. Explain how samples and populations,
Land Use of the Geographical Information System (GIS) and Mathematical Models in Planning Urban Parks & Green Spaces
 and Mathematical Models in Planning Urban Parks & Green Spaces") Land Use of the Geographical Information System (GIS) and Mathematical Models in Planning Urban Key words: SUMMARY TS 37 Spatial Development Infrastructure Linkages with Urban Planning and Infrastructure
Land Use of the Geographical Information System (GIS) and Mathematical Models in Planning Urban Key words: SUMMARY TS 37 Spatial Development Infrastructure Linkages with Urban Planning and Infrastructure
Further Mathematics 2018 CORE: Data analysis Chapter 2 Summarising numerical data
 Chapter 2: Summarising numerical data Further Mathematics 2018 CORE: Data analysis Chapter 2 Summarising numerical data Extract from Study Design Key knowledge Types of data: categorical (nominal and ordinal)
NEW YORK DEPARTMENT OF SANITATION. Spatial Analysis of Complaints
 NEW YORK DEPARTMENT OF SANITATION Spatial Analysis of Complaints Spatial Information Design Lab Columbia University Graduate School of Architecture, Planning and Preservation November 2007 Title New York
Last Lecture. Distinguish Populations from Samples. Knowing different Sampling Techniques. Distinguish Parameters from Statistics
 Last Lecture Distinguish Populations from Samples Importance of identifying a population and well chosen sample Knowing different Sampling Techniques Distinguish Parameters from Statistics Knowing different
Types of spatial data. The Nature of Geographic Data. Types of spatial data. Spatial Autocorrelation. Continuous spatial data: geostatistics
 The Nature of Geographic Data Types of spatial data Continuous spatial data: geostatistics Samples may be taken at intervals, but the spatial process is continuous e.g. soil quality Discrete data Irregular:
SPATIAL ANALYSIS. Transformation. Cartogram Central. 14 & 15. Query, Measurement, Transformation, Descriptive Summary, Design, and Inference
 14 & 15. Query, Measurement, Transformation, Descriptive Summary, Design, and Inference Geographic Information Systems and Science SECOND EDITION Paul A. Longley, Michael F. Goodchild, David J. Maguire,
The Choropleth Map Slide #2: Choropleth mapping enumeration units
 The Choropleth Map Slide #2: Choropleth mapping is a common technique for representing enumeration data These are maps where enumeration units, such as states or countries, are shaded a particular color
SESSION 5 Descriptive Statistics
 SESSION 5 Descriptive Statistics Descriptive statistics are used to describe the basic features of the data in a study. They provide simple summaries about the sample and the measures. Together with simple
Luc Anselin Spatial Analysis Laboratory Dept. Agricultural and Consumer Economics University of Illinois, Urbana-Champaign
 GIS and Spatial Analysis Luc Anselin Spatial Analysis Laboratory Dept. Agricultural and Consumer Economics University of Illinois, Urbana-Champaign http://sal.agecon.uiuc.edu Outline GIS and Spatial Analysis
Cartography and Geovisualization. Chapters 12 and 13 of your textbook
 Cartography and Geovisualization Chapters 12 and 13 of your textbook Why cartography? Maps are the principle means of displaying spatial data Exploration: visualization, leading to conceptualization of
Globally Estimating the Population Characteristics of Small Geographic Areas. Tom Fitzwater
 Globally Estimating the Population Characteristics of Small Geographic Areas Tom Fitzwater U.S. Census Bureau Population Division What we know 2 Where do people live? Difficult to measure and quantify.
Quick Response Report #126 Hurricane Floyd Flood Mapping Integrating Landsat 7 TM Satellite Imagery and DEM Data
 Quick Response Report #126 Hurricane Floyd Flood Mapping Integrating Landsat 7 TM Satellite Imagery and DEM Data Jeffrey D. Colby Yong Wang Karen Mulcahy Department of Geography East Carolina University
CIVL 7012/8012. Collection and Analysis of Information
 CIVL 7012/8012 Collection and Analysis of Information Uncertainty in Engineering Statistics deals with the collection and analysis of data to solve real-world problems. Uncertainty is inherent in all real
Chapter 2 Class Notes Sample & Population Descriptions Classifying variables
 Chapter 2 Class Notes Sample & Population Descriptions Classifying variables Random Variables (RVs) are discrete quantitative continuous nominal qualitative ordinal Notation and Definitions: a Sample is
Glossary. The ISI glossary of statistical terms provides definitions in a number of different languages:
 Glossary The ISI glossary of statistical terms provides definitions in a number of different languages: http://isi.cbs.nl/glossary/index.htm Adjusted r 2 Adjusted R squared measures the proportion of the
Glossary for the Triola Statistics Series
 Glossary for the Triola Statistics Series Absolute deviation The measure of variation equal to the sum of the deviations of each value from the mean, divided by the number of values Acceptance sampling
An Introduction to Scientific Research Methods in Geography Chapter 3 Data Collection in Geography
 An Introduction to Scientific Research Methods in Geography Chapter 3 Data Collection in Geography Learning Objectives What is the distinction between primary and secondary data sources? What are the five
Data preprocessing. DataBase and Data Mining Group 1. Data set types. Tabular Data. Document Data. Transaction Data. Ordered Data
 Elena Baralis and Tania Cerquitelli Politecnico di Torino Data set types Record Tables Document Data Transaction Data Graph World Wide Web Molecular Structures Ordered Spatial Data Temporal Data Sequential
Chapter 2: Tools for Exploring Univariate Data
 Stats 11 (Fall 2004) Lecture Note Introduction to Statistical Methods for Business and Economics Instructor: Hongquan Xu Chapter 2: Tools for Exploring Univariate Data Section 2.1: Introduction What is
OBESITY AND LOCATION IN MARION COUNTY, INDIANA MIDWEST STUDENT SUMMIT, APRIL Samantha Snyder, Purdue University
 OBESITY AND LOCATION IN MARION COUNTY, INDIANA MIDWEST STUDENT SUMMIT, APRIL 2008 Samantha Snyder, Purdue University Organization Introduction Literature and Motivation Data Geographic Distributions ib
MATH 1150 Chapter 2 Notation and Terminology
 MATH 1150 Chapter 2 Notation and Terminology Categorical Data The following is a dataset for 30 randomly selected adults in the U.S., showing the values of two categorical variables: whether or not the
STAT 200 Chapter 1 Looking at Data - Distributions
 STAT 200 Chapter 1 Looking at Data - Distributions What is Statistics? Statistics is a science that involves the design of studies, data collection, summarizing and analyzing the data, interpreting the
Introduction to Survey Data Integration
 Introduction to Survey Data Integration Jae-Kwang Kim Iowa State University May 20, 2014 Outline 1 Introduction 2 Survey Integration Examples 3 Basic Theory for Survey Integration 4 NASS application 5
Review for Exam #1. Chapter 1. The Nature of Data. Definitions. Population. Sample. Quantitative data. Qualitative (attribute) data
 data") Review for Exam #1 1 Chapter 1 Population the complete collection of elements (scores, people, measurements, etc.) to be studied Sample a subcollection of elements drawn from a population 11 The Nature
Review for Exam #1 1 Chapter 1 Population the complete collection of elements (scores, people, measurements, etc.) to be studied Sample a subcollection of elements drawn from a population 11 The Nature
Developing Spatial Awareness :-
 Developing Spatial Awareness :- We begin to exercise our geographic skill by examining he types of objects and features we encounter. Four different spatial objects in the real world: Point, Line, Areas
Part 7: Glossary Overview
 Part 7: Glossary Overview In this Part This Part covers the following topic Topic See Page 7-1-1 Introduction This section provides an alphabetical list of all the terms used in a STEPS surveillance with
David Tenenbaum GEOG 090 UNC-CH Spring 2005
 Statistical Thinking, Data Types, and Geographical Primitives The scientific method in geography, two kinds of approaches, and the sorts of statistics used to support those approaches Some characteristics
Data Mining: Data. Lecture Notes for Chapter 2. Introduction to Data Mining
 Data Mining: Data Lecture Notes for Chapter 2 Introduction to Data Mining by Tan, Steinbach, Kumar 1 Types of data sets Record Tables Document Data Transaction Data Graph World Wide Web Molecular Structures
Topic 4: Changing cities
 Topic 4: Changing cities Overview of urban patterns and processes 4.1 Urbanisation is a global process a. Contrasting trends in urbanisation over the last 50 years in different parts of the world (developed,
Chapter 6. Fundamentals of GIS-Based Data Analysis for Decision Support. Table 6.1. Spatial Data Transformations by Geospatial Data Types
 Chapter 6 Fundamentals of GIS-Based Data Analysis for Decision Support FROM: Points Lines Polygons Fields Table 6.1. Spatial Data Transformations by Geospatial Data Types TO: Points Lines Polygons Fields
COMBINING ENUMERATION AREA MAPS AND SATELITE IMAGES (LAND COVER) FOR THE DEVELOPMENT OF AREA FRAME (MULTIPLE FRAMES) IN AN AFRICAN COUNTRY:
 FOR THE DEVELOPMENT OF AREA FRAME (MULTIPLE FRAMES) IN AN AFRICAN COUNTRY:") COMBINING ENUMERATION AREA MAPS AND SATELITE IMAGES (LAND COVER) FOR THE DEVELOPMENT OF AREA FRAME (MULTIPLE FRAMES) IN AN AFRICAN COUNTRY: PRELIMINARY LESSONS FROM THE EXPERIENCE OF ETHIOPIA BY ABERASH
COMBINING ENUMERATION AREA MAPS AND SATELITE IMAGES (LAND COVER) FOR THE DEVELOPMENT OF AREA FRAME (MULTIPLE FRAMES) IN AN AFRICAN COUNTRY: PRELIMINARY LESSONS FROM THE EXPERIENCE OF ETHIOPIA BY ABERASH
Developing Built Environment Indicators for Urban Oregon. Dan Rubado, MPH EPHT Epidemiologist Oregon Public Health Division
 Developing Built Environment Indicators for Urban Oregon Dan Rubado, MPH EPHT Epidemiologist Oregon Public Health Division What is the built environment? The built environment encompasses spaces and places
CHAPTER 8 INTRODUCTION TO STATISTICAL ANALYSIS
 CHAPTER 8 INTRODUCTION TO STATISTICAL ANALYSIS LEARNING OBJECTIVES: After studying this chapter, a student should understand: notation used in statistics; how to represent variables in a mathematical form
BROOKINGS May
 Appendix 1. Technical Methodology This study combines detailed data on transit systems, demographics, and employment to determine the accessibility of jobs via transit within and across the country s 100
Identify the scale of measurement most appropriate for each of the following variables. (Use A = nominal, B = ordinal, C = interval, D = ratio.
 Answers to Items from Problem Set 1 Item 1 Identify the scale of measurement most appropriate for each of the following variables. (Use A = nominal, B = ordinal, C = interval, D = ratio.) a. response latency
Technical Documentation Demostats april 2018
 Technical Documentation Demostats 2018 april 2018 what it is DemoStats is a database of estimates and projections for a comprehensive set of demographic and socioeconomic attributes about the Canadian
CS 5014: Research Methods in Computer Science. Statistics: The Basic Idea. Statistics Questions (1) Statistics Questions (2) Clifford A.
 Statistics Questions (2) Clifford A.") Department of Computer Science Virginia Tech Blacksburg, Virginia Copyright c 2015 by Clifford A. Shaffer Computer Science Title page Computer Science Clifford A. Shaffer Fall 2015 Clifford A. Shaffer
Department of Computer Science Virginia Tech Blacksburg, Virginia Copyright c 2015 by Clifford A. Shaffer Computer Science Title page Computer Science Clifford A. Shaffer Fall 2015 Clifford A. Shaffer
A Comprehensive Method for Identifying Optimal Areas for Supermarket Development. TRF Policy Solutions April 28, 2011
 A Comprehensive Method for Identifying Optimal Areas for Supermarket Development TRF Policy Solutions April 28, 2011 Profile of TRF The Reinvestment Fund builds wealth and opportunity for lowwealth communities
New Land Cover & Land Use Data for the Chesapeake Bay Watershed
 New Land Cover & Land Use Data for the Chesapeake Bay Watershed Why? The Chesapeake Bay Program (CBP) partnership is in the process of improving and refining the Phase 6 suite of models used to inform
Probability & Sampling.
 Probability & Sampling http://www.pelagicos.net/classes_biometry_fa17.htm High-rise Syndrome in Cats Observation: Cats land unharmed on their feet, no matter how far they fall 132 cats falling more than
Preparing the GEOGRAPHY for the 2011 Population Census of South Africa
 Preparing the GEOGRAPHY for the 2011 Population Census of South Africa Sharthi Laldaparsad Statistics South Africa; E-mail: sharthil@statssa.gov.za Abstract: Statistics South Africa (Stats SA) s Geography
US Census Bureau Geographic Entities and Concepts. Geography Division
 US Census Bureau Geographic Entities and Concepts Geography Division Geographic Concepts Addresses vs. Geographic features and entities Legal/Administrative vs. Statistical Nesting relationships (or the
Session 2.1: Terminology, Concepts and Definitions
 Second Regional Training Course on Sampling Methods for Producing Core Data Items for Agricultural and Rural Statistics Module 2: Review of Basics of Sampling Methods Session 2.1: Terminology, Concepts
UNIT-3 Sampling Design
 UNIT-3 Sampling Design Census and Sample Survey All items in any field of inquiry constitute a Universe or Population. A complete enumeration of all items in the population is known as a census inquiry.
Learning Objectives for Stat 225
 Learning Objectives for Stat 225 08/20/12 Introduction to Probability: Get some general ideas about probability, and learn how to use sample space to compute the probability of a specific event. Set Theory:
Units. Exploratory Data Analysis. Variables. Student Data
 Units Exploratory Data Analysis Bret Larget Departments of Botany and of Statistics University of Wisconsin Madison Statistics 371 13th September 2005 A unit is an object that can be measured, such as
QUANTITATIVE DATA. UNIVARIATE DATA data for one variable
 QUANTITATIVE DATA Recall that quantitative (numeric) data values are numbers where data take numerical values for which it is sensible to find averages, such as height, hourly pay, and pulse rates. UNIVARIATE
The Recent Long Island Drought
 The Recent Long Island Drought David J. Tonjes Department of Technology and Society Stony Brook University david.tonjes@stonybrook.edu Abstract Drought is a qualitatively defined and determined phenomenon.
Variables, distributions, and samples (cont.) Phil 12: Logic and Decision Making Fall 2010 UC San Diego 10/18/2010
 Phil 12: Logic and Decision Making Fall 2010 UC San Diego 10/18/2010") Variables, distributions, and samples (cont.) Phil 12: Logic and Decision Making Fall 2010 UC San Diego 10/18/2010 Review Recording observations - Must extract that which is to be analyzed: coding systems,
Variables, distributions, and samples (cont.) Phil 12: Logic and Decision Making Fall 2010 UC San Diego 10/18/2010 Review Recording observations - Must extract that which is to be analyzed: coding systems,
Geography 281 Map Making with GIS Project Four: Comparing Classification Methods
 Geography 281 Map Making with GIS Project Four: Comparing Classification Methods Thematic maps commonly deal with either of two kinds of data: Qualitative Data showing differences in kind or type (e.g.,
Medical GIS: New Uses of Mapping Technology in Public Health. Peter Hayward, PhD Department of Geography SUNY College at Oneonta
 Medical GIS: New Uses of Mapping Technology in Public Health Peter Hayward, PhD Department of Geography SUNY College at Oneonta Invited research seminar presentation at Bassett Healthcare. Cooperstown,
Understanding China Census Data with GIS By Shuming Bao and Susan Haynie China Data Center, University of Michigan
 Understanding China Census Data with GIS By Shuming Bao and Susan Haynie China Data Center, University of Michigan The Census data for China provides comprehensive demographic and business information
CRP 608 Winter 10 Class presentation February 04, Senior Research Associate Kirwan Institute for the Study of Race and Ethnicity
 CRP 608 Winter 10 Class presentation February 04, 2010 SAMIR GAMBHIR SAMIR GAMBHIR Senior Research Associate Kirwan Institute for the Study of Race and Ethnicity Background Kirwan Institute Our work Using
Sampling and Sample Size. Shawn Cole Harvard Business School
 Sampling and Sample Size Shawn Cole Harvard Business School Calculating Sample Size Effect Size Power Significance Level Variance ICC EffectSize 2 ( ) 1 σ = t( 1 κ ) + tα * * 1+ ρ( m 1) P N ( 1 P) Proportion
Neighborhood Locations and Amenities
 University of Maryland School of Architecture, Planning and Preservation Fall, 2014 Neighborhood Locations and Amenities Authors: Cole Greene Jacob Johnson Maha Tariq Under the Supervision of: Dr. Chao
Intro to GIS Summer 2012 Data Visualization
 Intro to GIS Summer 2012 Data Visualization UNDERSTANDING YOUR MAP DATA Qualitative vs. Quantitative Data Qualitative Data classified by category e.g. Soil types, Animal Species Quantitative Data grouped
Overview of Statistical Analysis of Spatial Data
 Overview of Statistical Analysis of Spatial Data Geog 2C Introduction to Spatial Data Analysis Phaedon C. Kyriakidis www.geog.ucsb.edu/ phaedon Department of Geography University of California Santa Barbara