Sampling and Sample Size. Shawn Cole Harvard Business School
|
|
|
- Amice Holmes
- 5 years ago
- Views:
Transcription


1 Sampling and Sample Size Shawn Cole Harvard Business School
2 Calculating Sample Size Effect Size Power Significance Level Variance ICC EffectSize 2 ( ) 1 σ = t( 1 κ ) + tα * * 1+ ρ( m 1) P N ( 1 P) Proportion in Treatment Sample Size Average Cluster Size
3 Let s Take a Step Back What are we trying to do when we evaluate a program? Trying to measure and demonstrate the existence of impact (positive or negative) One helpful way of thinking about how we approach program evaluation is to think about an analogy from criminal law. J-PAL SAMPLING AND SAMPLE SIZE 3
4 Burden of Proof: Proving Guilt In criminal law, most institutions follow the rule: innocent until proven guilty The presumption is that the accused is innocent and the burden is on the prosecutor to show guilt The jury or judge starts with the prior that the accused person is innocent The burden of proof is on the prosecutor to show that the accused person is guilty J-PAL SAMPLING AND SAMPLE SIZE 4
5 Burden of Proof: Demonstrating Impact In program evaluation, instead of presumption of innocence, the rule is: presumption of insignificance We begin with the assumption that there is no (zero) impact of the program The burden of proof is on the evaluator to show a significant effect of the program J-PAL SAMPLING AND SAMPLE SIZE 5
6 Burden of Proof: Conclusions If it is very unlikely (e.g., less than a 5% probability) that the difference is solely due to chance: We reject the hypothesis that there is no impact of the program We may now say: our program has a statistically significant impact J-PAL SAMPLING AND SAMPLE SIZE 6
7 Demonstrating Impact Choose a confidence level at which we feel confident saying that an impact we hope to observe probably (say, a specific increase in test scores) did not arise purely due to chance Typically 95% (or significance level: α=5%). This means that if the program did not have any impact and we were to run our experiment 100 times, we would only observe impact purely by chance 5 times. Commonly accepted threshold for significance (don t ask us why though!) J-PAL SAMPLING AND SAMPLE SIZE 7
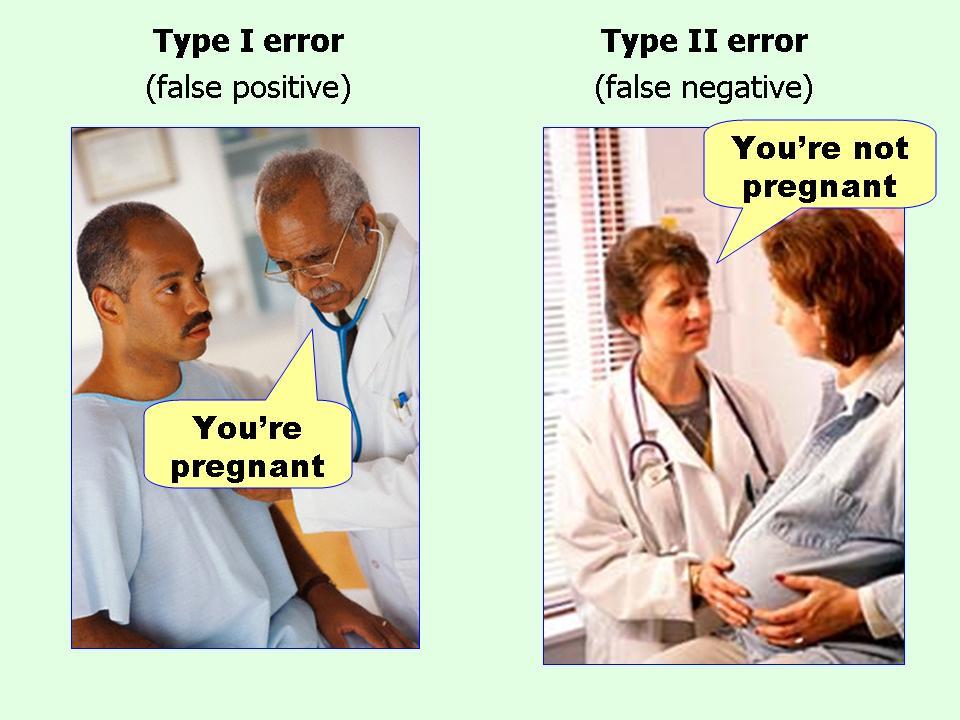
8 What is the Significance Level? Type I Error: Finding evidence of impact even if there actually is no impact Significance level: The probability that we will find evidence of impact when there is none. J-PAL SAMPLING AND SAMPLE SIZE 8
9 Demonstrating Impact: 95% confidence You Conclude Effective No Effect Effective Type II Error (low power) The Truth No Effect Type I Error (5% of the time) J-PAL SAMPLING AND SAMPLE SIZE 9
10 What is Power? Type II Error: Finding no evidence of impact even though there actually is impact. Power: If there is a measureable effect of our intervention (i.e. the program has an impact), the probability that we will detect an effect (i.e. that we will be able to pick up on this impact) J-PAL SAMPLING AND SAMPLE SIZE 10
11 Type I versus Type II errors You Conclude Effective No Effect Effective Type II Error (low power) The Truth No Effect Type I Error (5% of the time) J-PAL SAMPLING AND SAMPLE SIZE 11

12 Source:
13 Demonstrating Impact Choose a confidence level (95%) at which we feel confident saying that any impact observed probably did not arise purely due to chance. Choose a confidence level at which we feel confident saying that if an impact was not observed, we probably did not mistakenly miss impact purely due to chance. Typically 80%. This means that if the program did have an impact and we were to run our experiment 100 times, we would observe no impact purely by chance 20 times. Commonly accepted threshold for power (again, don t ask us why though!) J-PAL SAMPLING AND SAMPLE SIZE 13
14 What influences power? In an ideal world, we could have a very high significance threshold (99%) and very high power (99%) But this would typically require an extremely large sample What are the various parameters affecting the power of a study? Which parameters are fixed and which ones can be changed? What are your constraints? Budget? Sample Size? Intervention Costs? Survey Costs? J-PAL SAMPLING AND SAMPLE SIZE 14
15 Power: main considerations 1. Sample Size 2. Effect Size 3. Take-up 4. Variance 5. Proportion of sample in T vs. C 6. Clustering J-PAL SAMPLING AND SAMPLE SIZE 15
16 Power: main considerations 1. Sample Size 2. Effect Size 3. Take-up 4. Variance 5. Proportion of sample in T vs. C 6. Clustering J-PAL SAMPLING AND SAMPLE SIZE 16
17 By increasing sample size you increase A. Accuracy B. Precision C. Both D. Neither E. Don t know J-PAL SAMPLING AND SAMPLE SIZE 17
18 Intuition about sample size We run an experiment on a sample that is a randomly selected subset of the population. Random sampling Population Sample J-PAL SAMPLING AND SAMPLE SIZE 18
19 Intuition about sample size The larger the sample, the more representative of the population that it is likely to be. Random sampling Population Sample Sample Sample J-PAL SAMPLING AND SAMPLE SIZE 19
20 Intuition about sample size Larger sample More representative of the population Larger sample More likely that experiment is capturing any impact that would occur in the population. Larger sample Minimize Type II errors. Larger sample Maximizes power and precision J-PAL SAMPLING AND SAMPLE SIZE 20
21 RULE OF THUMB NUMBER 1 A larger sample gives you more power Less power More power J-PAL SAMPLING AND SAMPLE SIZE 21
22 By increasing sample size you increase A. Accuracy B. Precision C. Both D. Neither E. Don t know J-PAL SAMPLING AND SAMPLE SIZE 22
23 Power: main considerations 1. Sample Size 2. Effect Size 3. Take-up 4. Variance 5. Proportion of sample in T vs. C 6. Clustering J-PAL SAMPLING AND SAMPLE SIZE 23
24 Does a larger effect require a larger or smaller sample? A. Larger sample B. Smaller sample C. Don t Know J-PAL SAMPLING AND SAMPLE SIZE 24
25 Some intuition Remember, we want to identify the effect both accurately and precisely. Randomization gives us accuracy by eliminating bias. Power is about precision. Think about how precisely you could identify an object based on its size J-PAL SAMPLING AND SAMPLE SIZE 25
26 Which of these two images can you identify more precisely? IMAGE 1 IMAGE 2 J-PAL SAMPLING AND SAMPLE SIZE 26
27 Which of the two images can you identify more precisely? A. Image 1 B. Image 2 C. I can identify both equally precisely/imprecisely J-PAL SAMPLING AND SAMPLE SIZE 27
28 Accuracy vs. Precision Here s the image again J-PAL SAMPLING AND SAMPLE SIZE 28
29 Accuracy vs. Precision: Which of these is the image from the previous slide? IMAGE 1 IMAGE 2 J-PAL SAMPLING AND SAMPLE SIZE 29
30 Which of these is the image from the previous slide? A. Left B. Right C. Both J-PAL SAMPLING AND SAMPLE SIZE 30

31 Let s take another look... IMAGE 1 IMAGE 2 J-PAL SAMPLING AND SAMPLE SIZE 31
32 Intuition about effect size A larger effect is like the larger image: It allows you to reliably identify precisely what the image says. Think of sample size as allowing you to zoom in on an image. A larger image requires less zoom i.e. a smaller sample A smaller image requires more zoom i.e. a larger sample J-PAL SAMPLING AND SAMPLE SIZE 32
33 Alternative intuition You have to decide whether a coin is fair or unfair. You win a dollar if you are right You can toss the coin ten times. Nickels: The unfair nickel lands heads 9 out of 10 times Dimes: The unfair dime lands heads 6 out of 10 times Which level of unfairness is easier to detect? J-PAL SAMPLING AND SAMPLE SIZE 33
34 RULE OF THUMB NUMBER 2 Effect size and sample size are inversely related for a given level of power. smaller sample required larger sample required J-PAL SAMPLING AND SAMPLE SIZE 34
35 Does a larger effect require a larger or smaller sample? A. Larger sample B. Smaller sample C. Don t Know J-PAL SAMPLING AND SAMPLE SIZE 35
36 Program Effect vs. Detectible Effect The intervention has an effect (or not) that is independent of a study or evaluation (e.g., Head Start increases tests scores by.3 standard deviations) When designing a study, the sample and design you choose determine the minimum detectible effect size An experiment with enough power to detect an effect of.3 standard deviations will detect (with even more power) a larger effect. It will have less power if the true effect is less than.3 So, what effect size should you use when designing experiment? J-PAL SAMPLING AND SAMPLE SIZE 36
37 Consider the following options Low minimum detectible effect size More power to detect any given effect (good) Larger sample required (bad) The smallest effect size at which the program is costeffective The largest effect size you expect the program to have Requires smaller sample J-PAL SAMPLING AND SAMPLE SIZE 37
38 What effect size should you use when designing your experiment? A. Smallest effect size that is still cost effective B. Largest effect size you expect your program to produce C. Both D. Neither J-PAL SAMPLING AND SAMPLE SIZE 38
39 Power: main considerations 1. Sample Size 2. Effect Size 3. Take-up 4. Variance 5. Proportion of sample in T vs. C 6. Clustering J-PAL SAMPLING AND SAMPLE SIZE 39
40 If you anticipate imperfect take-up, should you increase or decrease your sample size? A. Increase B. Decrease C. Don t Know J-PAL SAMPLING AND SAMPLE SIZE 40
41 Does imperfect take-up increase or decrease your effect size? A. Increase B. Decrease C. Don t Know J-PAL SAMPLING AND SAMPLE SIZE 41
42 Take-up and effect size Let s walk through a numerical example Say you have a program that increases savings by $1 for every person who takes up the program. You offer 4 people in the treatment group this program and have 4 people in the control group who do not receive this program. J-PAL SAMPLING AND SAMPLE SIZE 42
43 Effect size with 100% take-up Treatment Effect size i.e. avg. effect = Control ( 0 4 ) = $1 J-PAL SAMPLING AND SAMPLE SIZE 43
44 Effect size with 50% take-up Treatment Effect size i.e. avg. effect = Control ( 0 4 ) = $0.5 J-PAL SAMPLING AND SAMPLE SIZE 44
45 Remember RULE OF THUMB NUMBER 2? Effect size and sample size are inversely related for a given level of power. smaller sample required larger sample required J-PAL SAMPLING AND SAMPLE SIZE 45
46 RULE OF THUMB NUMBER 3 Imperfect take-up will necessitate a larger sample for a given level of power. If you anticipate imperfect take-up, plan for it with a larger sample; and/or work to increase take-up smaller sample required larger sample required J-PAL SAMPLING AND SAMPLE SIZE 46
47 If you anticipate imperfect take-up, should you increase or decrease your sample size? A. Smaller B. Larger C. Don t Know J-PAL SAMPLING AND SAMPLE SIZE 47
48 Power: main considerations 1. Sample Size 2. Effect Size 3. Take-up 4. Variance 5. Proportion of sample in T vs. C 6. Clustering J-PAL SAMPLING AND SAMPLE SIZE 48
49 What will more variation in the underlying population do to our estimates? A. Increase risk of bias? B. Reduce risk of bias C. Increase precision of estimate D. Reduce precision of estimate E. Will not change estimates J-PAL SAMPLING AND SAMPLE SIZE 49
50 Intuition about variance Say our program seeks to increase child height. Lot of variation in height in the population. We might end up with a sample that has mostly tall individuals. or one with mostly short. Population Sample Random sampling J-PAL SAMPLING AND SAMPLE SIZE 50
51 Intuition about variance In a population with higher variance, more chance we get an unrepresentative sample. Contrast with a population with lower variation in height. More chance we end up with a representative sample. Population Sample Random sampling J-PAL SAMPLING AND SAMPLE SIZE 51
52 Implications of higher variance Remember, our program seeks to increase child height. Lot of variation in height in the population. At endline children in treatment are taller than in control. Is this because we happened to start with taller children? Or because the program worked? Program implemented Population Sample Treatment Random sampling Control J-PAL SAMPLING AND SAMPLE SIZE 52
53 Implications of higher variance If everyone in the underlying population was of similar height at the start, it would be easy to sort this out. More likely to get a representative sample. Variation we see at end between treatment and control must be due to the program. Program implemented Population Sample Treatment Random sampling Control J-PAL SAMPLING AND SAMPLE SIZE 53
54 RULE OF THUMB NUMBER 4 For a given level of power, higher variance larger sample needed. larger sample required smaller sample required J-PAL SAMPLING AND SAMPLE SIZE 54
55 When there is high variance in the underlying population, you should A. Reduce the population variance B. Decrease your sample size C. Increase your sample size J-PAL SAMPLING AND SAMPLE SIZE 55
56 Power: main considerations 1. Sample Size 2. Effect Size 3. Take-up 4. Variance 5. Proportion of sample in T vs. C 6. Clustering J-PAL SAMPLING AND SAMPLE SIZE 56
57 For a given sample size, the sample should always be equally split between treatment and control A. True B. False C. It depends J-PAL SAMPLING AND SAMPLE SIZE 57
58 Let s go back to that equation Effect Size Power Significance Level Variance ICC EffectSize 2 ( ) 1 σ = t( 1 κ ) + tα * * 1+ ρ( m 1) P N ( 1 P) Proportion in Treatment Sample Size Average Cluster Size
59 Focus on the proportion in treatment Effect Size Power Significance Level Variance ICC EffectSize 2 ( ) 1 σ = t( 1 κ ) + tα * * 1+ ρ( m 1) P N ( 1 P) Proportion in Treatment Sample Size Average Cluster Size
60 Maximizing power for a given sample P refers to the proportion of the sample in the treatment group. P is always some number between 0 and 1. To get maximum power for a given sample size, we need to minimize This term is minimized when P is 0.5 i.e. when half the sample is in the treatment group. J-PAL SAMPLING AND SAMPLE SIZE 60
61 RULE OF THUMB NUMBER 5 For a given sample size, power is maximized when the sample is equally split between T and C. Sample (n=8) Treatment (n=4) Control (n=4) J-PAL SAMPLING AND SAMPLE SIZE 61
62 Other considerations Adding additional subjects unequally still increases your power Could be low cost to have a much bigger control group (if administrative data available). However, diminishing returns. Power may not be only consideration in how you split sample. If implementation is costly, may want bigger proportion in control. Resources might be better spent on tracking some participants better than on having more participants. We will talk about attrition later) J-PAL SAMPLING AND SAMPLE SIZE 62
63 For a given sample size, the sample should always be equally split between treatment and control A. True B. False C. It depends J-PAL SAMPLING AND SAMPLE SIZE 63
64 Power: main considerations 1. Sample Size 2. Effect Size 3. Take-up 4. Variance 5. Proportion of sample in T vs. C 6. Clustering J-PAL SAMPLING AND SAMPLE SIZE 64
65 Review: How do we randomize in our sample? J-PAL SAMPLING AND SAMPLE SIZE 65
66 Can randomize individuals to T or C J-PAL SAMPLING AND SAMPLE SIZE 66
67 Can randomize clusters: e.g. neighborhoods or schools J-PAL SAMPLING AND SAMPLE SIZE 67
68 Can randomize clusters: e.g. neighborhoods or schools J-PAL SAMPLING AND SAMPLE SIZE 68
69 To achieve the same power as an individual level randomization, a clustered design is likely to require A. A smaller sample size B. A bigger sample size C. The same sample size D. Don t know J-PAL SAMPLING AND SAMPLE SIZE 69
70 Intuition behind clustering You want to know how close the upcoming national elections will be Method 1: Randomly select 50 people from entire US population Method 2: Randomly select 10 families, and ask five members of each family their opinion J-PAL SAMPLING AND SAMPLE SIZE 70
71 Is Method 1 or Method 2 going to give you a better idea of how close the election will be? A. Method 1 (50 random people) B. Method 2 (5 members each of 10 random families) J-PAL SAMPLING AND SAMPLE SIZE 71
72 People within a cluster may behave in similar ways Population Control Treatment J-PAL SAMPLING AND SAMPLE SIZE 72
73 People within a cluster may not behave in similar ways Population Control Treatment J-PAL SAMPLING AND SAMPLE SIZE 73
74 Intra-cluster correlation (ICC) The intra-cluster correlation (ICC) is simply a measure of how similar individuals within a cluster are along an outcome of interest. The ICC is also known as the rho (Greek symbol ρ). ICC can be high or low If rho=1, everyone in the cluster behaves exactly the same If rho=0, cluster identity does not correlate with behavior J-PAL SAMPLING AND SAMPLE SIZE 74
75 Implications of ICC for power For a given sample size, less power when randomizing by cluster (unless ICC is zero). However, may still need to randomize by cluster for other reasons (spillovers, logistics, etc.) Diminishing returns to surveying more people per cluster. Usually, number of clusters is key determinant of power, not number of people per cluster. J-PAL SAMPLING AND SAMPLE SIZE 75
76 RULE OF THUMB NUMBER 6 For a given sample size, less power when randomizing by cluster (unless ICC is zero). smaller sample required larger sample required J-PAL SAMPLING AND SAMPLE SIZE 76
77 RULE OF THUMB NUMBER 7 For a given level of power, higher ICC larger sample needed. The higher the ICC, the better off you are by increasing sample by adding clusters rather than individuals to clusters. larger sample required smaller sample required J-PAL SAMPLING AND SAMPLE SIZE 77
78 All dropouts live in one area. People in school live in another. College grads live in a third, etc. ICC (ρ) on education will be.. A. High B. Low C. No effect on rho D. Don t know J-PAL SAMPLING AND SAMPLE SIZE 78
79 If ICC (ρ) is high, what is a more efficient way of increasing power? A. Include more clusters in the sample B. Interview more people in each cluster C. Both D. Don t know J-PAL SAMPLING AND SAMPLE SIZE 79
80 So let s recap
81 Summarizing the rules of thumb 1. Larger sample More power 2. Smaller effect size Larger sample size required 3. Lower take-up Larger sample size required 4. High variance in population Larger sample required 5. For given sample, equal T and C split maximizes power 6. For given sample, clustering Lower power 7. Higher ICC Larger sample required J-PAL SAMPLING AND SAMPLE SIZE 81
82 Calculating power in practice Finding the ingredients for the power equation
83 Calculating power: A step-by-step guide 1. Set desired power (80%) and significance (95%). 2. Calculate residual variance (& ICC if clustering) using pilot data, national data sources, or data from other studies. 3. Decide number of treatments. 4. Set minimum detectable effect size for T vs. C and between treatments. 5. Decide allocation ratio. 6. Calculate sample size. 7. Estimate resulting budget. 8. Adjust parameters above (e.g. cut number of arms). 9. Repeat! J-PAL SAMPLING AND SAMPLE SIZE 83
84 Residual Variance Estimate variance from data from similar populations Population variance is what it is, not much we can do. Can help distinguish if endline height difference due to: Program increasing height. Chance allocation of tall children to treatment at baseline. Treatment Population Control J-PAL SAMPLING AND SAMPLE SIZE 84
85 Residual variance: intuition Some part of endline height can be explained by baseline height. Accounting for this allows a more precise estimate of intervention effect. Control Treatment Baseline Endline J-PAL SAMPLING AND SAMPLE SIZE 85
86 Residual variance Variance reduces power because of the risk we might pick very successful people in one group (e.g., treatment) Some variation can be explained by observables Older kids are taller Using controls in analysis soaks up variance impact more precisely estimated more power. Calculate residual variance by regressing outcome on controls in existing data Baseline value of outcome good control In Stata power, can adjust for multiple rounds of data Need estimate of correlation in outcome between rounds J-PAL SAMPLING AND SAMPLE SIZE 86
87 Estimating ICC (ρ) ICC must be between 0 and 1. Depends on context and outcome variable. To estimate Rho need big samples. Check sensitivity of your power and sample size calculations to different possible values of the ICC. J-PAL SAMPLING AND SAMPLE SIZE 87
88 Some values of ICC observed in earlier studies Malawi: Households produces maize Sierra Leone: Households produce cocoa 0.57 Sierra Leone: Average rice yields 0.04 Busia, Kenya: Math and language test scores 0.22 Busia, Kenya: Math test scores 0.62 Mumbai, India: Math and language test scores 0.28 Texas: Precinct voting preferences 0.20 Italy: Hospital admissions 0.06 United States: Weight and cholesterol levels 0.02 United States: Reading achievement scores 0.22 J-PAL SAMPLING AND SAMPLE SIZE 88
89 Number of treatment arms Different treatment arms help disentangle different mechanisms behind an effect. More arms larger sample required. Say we have two treatment arms. Need to think about two values of the minimum detectable effect size. For comparing T vs C For comparing T1 vs T2 J-PAL SAMPLING AND SAMPLE SIZE 89
90 Multiple treatment arm tips Good to have at least one intensive arm, where a zero would be interesting. In the analysis, may be useful to pool all treatment arms, creating an any treatment arm. Have to scale up sample size given from statistical packages. Stata gives sample per cell 2 treatments + C = 3 cells Optimal Design assumes one treatment, one control Divide result by 2 to get sample size per cell J-PAL SAMPLING AND SAMPLE SIZE 90
91 Unequal allocation ratio If budget covers treatment and evaluation, more expensive to add one person to T than C. Unequal allocation ratio gives a bigger total N, which may be worth it. Try different allocation ratios within a given budget and explore tradeoffs. With multiple treatments put more sample behind most important question. If going to pool treatments, have bigger control. If really care about between treatment differences need bigger sample in treatment groups. J-PAL SAMPLING AND SAMPLE SIZE 91
92 Unequal allocation: example (1) Basic Gender attitudes, literacy 76 education, health information (2) Livelihoods Basic plus financial literacy 77 (half, 39, receive savings club) (3) Full Livelihoods plus oil 77 (half, 38, receive savings club) (4) Oil Oil incentive for unmarried girls 77 (5) Control 153 Total 460 (6) Savings Savings club cross cut with 77 cross cut Full and Livelihoods J-PAL SAMPLING AND SAMPLE SIZE 92
93 Minimum detectable effect size (MDE) The most important ingredient for calculating power. MDE is not the effect size we expect or want. MDE is the effect size below which we may not be able to distinguish the effect from zero, even if it exists. i.e. below which effect might as well be zero. Remember, you will be powered for effects larger than the MDE! J-PAL SAMPLING AND SAMPLE SIZE 93
94 What effect size should you use when designing your experiment? A. Smallest effect size that is still cost effective B. Largest effect size you expect your program to produce C. Both D. Neither J-PAL SAMPLING AND SAMPLE SIZE 94
95 Questions to ask when determining MDE Below what effect size would the program not be cost effective? How big an effect would we need to make the result interesting? Do we want smaller MDE between arms than between T and C? Common mistake is powering on T vs. C so don t have power to distinguish between arms. J-PAL SAMPLING AND SAMPLE SIZE 95
96 Calculating power in Stata Stata has a new command power. But does not allow for clustering (yet). Most still use sampsi and sampclus, or clustersampsi (add ons). Defaults: power 90%, significance 5%, equal T & C split/ Example (no clustering): To detect an increase in average test scores from 43% to 45%, with power of 80%: sampsi , power(0.8) sd(0.05) Stata gives N per cell e.g. N1=99 With multiple arms, need to multiply by number of cells (i.e. number of treatments plus control) For binary outcomes, SD determined by mean. J-PAL SAMPLING AND SAMPLE SIZE 96
97 Power in Stata with clustering First calculate sample size without clustering and then add information on clusters. Example: To detect an increase in average test scores from 43% to 45%, with power of 80%, randomized at class level with 60 per class and ICC of 0.2: sampsi , power(0.8) sd(0.05) sampclus, obsclus(60) rho(0.2) J-PAL SAMPLING AND SAMPLE SIZE 97
98 Power with Optimal Design (OD) OD: Free software specifically designed for power calculations. MDE must be entered in standardized effect size (i.e. effect size divided by standard deviation.) OD allows multiple levels of clustering and works with dropdown menus see J-PAL exercise for details J-PAL SAMPLING AND SAMPLE SIZE 98
99 Thank you!
Sampling and Sample Size
 Sampling and Sample Size Matt Lowe MIT 5 July 2017 Course Overview 1. What is Evaluation? 2. Theory of Change 3. Outcome, Impact, and Indicators 4. Why Randomize? 5. How to Randomize 6. Sampling and Sample
Chapter Three. Hypothesis Testing
 3.1 Introduction The final phase of analyzing data is to make a decision concerning a set of choices or options. Should I invest in stocks or bonds? Should a new product be marketed? Are my products being
where Female = 0 for males, = 1 for females Age is measured in years (22, 23, ) GPA is measured in units on a four-point scale (0, 1.22, 3.45, etc.
 GPA is measured in units on a four-point scale (0, 1.22, 3.45, etc.") Notes on regression analysis 1. Basics in regression analysis key concepts (actual implementation is more complicated) A. Collect data B. Plot data on graph, draw a line through the middle of the scatter
Notes on regression analysis 1. Basics in regression analysis key concepts (actual implementation is more complicated) A. Collect data B. Plot data on graph, draw a line through the middle of the scatter
Practical sampling. Aidan Coville Development Impact Evaluation (DIME), World Bank
, World Bank") Practical sampling Aidan Coville Development Impact Evaluation (DIME), World Bank IE Target for Growth Impact Evaluation Workshop Mexico City, 1 March 2017 *This presentation draws from work from Laura
Practical sampling Aidan Coville Development Impact Evaluation (DIME), World Bank IE Target for Growth Impact Evaluation Workshop Mexico City, 1 March 2017 *This presentation draws from work from Laura
Hypothesis tests
 6.1 6.4 Hypothesis tests Prof. Tesler Math 186 February 26, 2014 Prof. Tesler 6.1 6.4 Hypothesis tests Math 186 / February 26, 2014 1 / 41 6.1 6.2 Intro to hypothesis tests and decision rules Hypothesis
Multiple Regression Analysis
 Multiple Regression Analysis y = β 0 + β 1 x 1 + β 2 x 2 +... β k x k + u 2. Inference 0 Assumptions of the Classical Linear Model (CLM)! So far, we know: 1. The mean and variance of the OLS estimators
Module 03 Lecture 14 Inferential Statistics ANOVA and TOI
 Introduction of Data Analytics Prof. Nandan Sudarsanam and Prof. B Ravindran Department of Management Studies and Department of Computer Science and Engineering Indian Institute of Technology, Madras Module
LECTURE 5. Introduction to Econometrics. Hypothesis testing
 LECTURE 5 Introduction to Econometrics Hypothesis testing October 18, 2016 1 / 26 ON TODAY S LECTURE We are going to discuss how hypotheses about coefficients can be tested in regression models We will
Introduction to Statistics
 MTH4106 Introduction to Statistics Notes 6 Spring 2013 Testing Hypotheses about a Proportion Example Pete s Pizza Palace offers a choice of three toppings. Pete has noticed that rather few customers ask
CHAPTER 9, 10. Similar to a courtroom trial. In trying a person for a crime, the jury needs to decide between one of two possibilities:
 CHAPTER 9, 10 Hypothesis Testing Similar to a courtroom trial. In trying a person for a crime, the jury needs to decide between one of two possibilities: The person is guilty. The person is innocent. To
Against the F-score. Adam Yedidia. December 8, This essay explains why the F-score is a poor metric for the success of a statistical prediction.
 Against the F-score Adam Yedidia December 8, 2016 This essay explains why the F-score is a poor metric for the success of a statistical prediction. 1 What is the F-score? From Wikipedia: In statistical
CS 124 Math Review Section January 29, 2018
 CS 124 Math Review Section CS 124 is more math intensive than most of the introductory courses in the department. You re going to need to be able to do two things: 1. Perform some clever calculations to
(A) Incorrect! A parameter is a number that describes the population. (C) Incorrect! In a Random Sample, not just a sample.
 Incorrect! A parameter is a number that describes the population. (C) Incorrect! In a Random Sample, not just a sample.") AP Statistics - Problem Drill 15: Sampling Distributions No. 1 of 10 Instructions: (1) Read the problem statement and answer choices carefully (2) Work the problems on paper 1. Which one of the following
AP Statistics - Problem Drill 15: Sampling Distributions No. 1 of 10 Instructions: (1) Read the problem statement and answer choices carefully (2) Work the problems on paper 1. Which one of the following
Introduction to Probability, Fall 2009
 Introduction to Probability, Fall 2009 Math 30530 Review questions for exam 1 solutions 1. Let A, B and C be events. Some of the following statements are always true, and some are not. For those that are
CHAPTER 1: Preliminary Description of Errors Experiment Methodology and Errors To introduce the concept of error analysis, let s take a real world
 CHAPTER 1: Preliminary Description of Errors Experiment Methodology and Errors To introduce the concept of error analysis, let s take a real world experiment. Suppose you wanted to forecast the results
PHP2510: Principles of Biostatistics & Data Analysis. Lecture X: Hypothesis testing. PHP 2510 Lec 10: Hypothesis testing 1
 PHP2510: Principles of Biostatistics & Data Analysis Lecture X: Hypothesis testing PHP 2510 Lec 10: Hypothesis testing 1 In previous lectures we have encountered problems of estimating an unknown population
Quantitative Introduction ro Risk and Uncertainty in Business Module 5: Hypothesis Testing
 Quantitative Introduction ro Risk and Uncertainty in Business Module 5: Hypothesis Testing M. Vidyasagar Cecil & Ida Green Chair The University of Texas at Dallas Email: M.Vidyasagar@utdallas.edu October
ECO220Y Review and Introduction to Hypothesis Testing Readings: Chapter 12
 ECO220Y Review and Introduction to Hypothesis Testing Readings: Chapter 12 Winter 2012 Lecture 13 (Winter 2011) Estimation Lecture 13 1 / 33 Review of Main Concepts Sampling Distribution of Sample Mean
Hypothesis Testing The basic ingredients of a hypothesis test are
 Hypothesis Testing The basic ingredients of a hypothesis test are 1 the null hypothesis, denoted as H o 2 the alternative hypothesis, denoted as H a 3 the test statistic 4 the data 5 the conclusion. The
*Karle Laska s Sections: There is no class tomorrow and Friday! Have a good weekend! Scores will be posted in Compass early Friday morning
 STATISTICS 100 EXAM 3 Spring 2016 PRINT NAME (Last name) (First name) *NETID CIRCLE SECTION: Laska MWF L1 Laska Tues/Thurs L2 Robin Tu Write answers in appropriate blanks. When no blanks are provided CIRCLE
Tutorial 2: Power and Sample Size for the Paired Sample t-test
 Tutorial 2: Power and Sample Size for the Paired Sample t-test Preface Power is the probability that a study will reject the null hypothesis. The estimated probability is a function of sample size, variability,
Hypothesis testing I. - In particular, we are talking about statistical hypotheses. [get everyone s finger length!] n =
![Hypothesis testing I. - In particular, we are talking about statistical hypotheses. [get everyone s finger length!] n =](/thumbs/86/94764601.jpg "Hypothesis testing I. - In particular, we are talking about statistical hypotheses. [get everyone s finger length!] n =") Hypothesis testing I I. What is hypothesis testing? [Note we re temporarily bouncing around in the book a lot! Things will settle down again in a week or so] - Exactly what it says. We develop a hypothesis,
Hypothesis testing I I. What is hypothesis testing? [Note we re temporarily bouncing around in the book a lot! Things will settle down again in a week or so] - Exactly what it says. We develop a hypothesis,
Harvard University. Rigorous Research in Engineering Education
 Statistical Inference Kari Lock Harvard University Department of Statistics Rigorous Research in Engineering Education 12/3/09 Statistical Inference You have a sample and want to use the data collected
a Sample By:Dr.Hoseyn Falahzadeh 1
 In the name of God Determining ee the esize eof a Sample By:Dr.Hoseyn Falahzadeh 1 Sample Accuracy Sample accuracy: refers to how close a random sample s statistic is to the true population s value it
Sampling. Benjamin Graham
 Sampling Benjamin Graham Schedule This Week: Sampling and External Validity How many kids? Fertility rate in the US. could be interesting as an independent or a dependent variable. How many children did
CS 125 Section #12 (More) Probability and Randomized Algorithms 11/24/14. For random numbers X which only take on nonnegative integer values, E(X) =
 Probability and Randomized Algorithms 11/24/14. For random numbers X which only take on nonnegative integer values, E(X) =") CS 125 Section #12 (More) Probability and Randomized Algorithms 11/24/14 1 Probability First, recall a couple useful facts from last time about probability: Linearity of expectation: E(aX + by ) = ae(x)
CS 125 Section #12 (More) Probability and Randomized Algorithms 11/24/14 1 Probability First, recall a couple useful facts from last time about probability: Linearity of expectation: E(aX + by ) = ae(x)
Welcome! Webinar Biostatistics: sample size & power. Thursday, April 26, 12:30 1:30 pm (NDT)
") . Welcome! Webinar Biostatistics: sample size & power Thursday, April 26, 12:30 1:30 pm (NDT) Get started now: Please check if your speakers are working and mute your audio. Please use the chat box to
. Welcome! Webinar Biostatistics: sample size & power Thursday, April 26, 12:30 1:30 pm (NDT) Get started now: Please check if your speakers are working and mute your audio. Please use the chat box to
COVENANT UNIVERSITY NIGERIA TUTORIAL KIT OMEGA SEMESTER PROGRAMME: ECONOMICS
 COVENANT UNIVERSITY NIGERIA TUTORIAL KIT OMEGA SEMESTER PROGRAMME: ECONOMICS COURSE: CBS 221 DISCLAIMER The contents of this document are intended for practice and leaning purposes at the undergraduate
1 Impact Evaluation: Randomized Controlled Trial (RCT)
") Introductory Applied Econometrics EEP/IAS 118 Fall 2013 Daley Kutzman Section #12 11-20-13 Warm-Up Consider the two panel data regressions below, where i indexes individuals and t indexes time in months:
Introductory Applied Econometrics EEP/IAS 118 Fall 2013 Daley Kutzman Section #12 11-20-13 Warm-Up Consider the two panel data regressions below, where i indexes individuals and t indexes time in months:
Chapter 8. Linear Regression. Copyright 2010 Pearson Education, Inc.
 Chapter 8 Linear Regression Copyright 2010 Pearson Education, Inc. Fat Versus Protein: An Example The following is a scatterplot of total fat versus protein for 30 items on the Burger King menu: Copyright
MAT Mathematics in Today's World
 MAT 1000 Mathematics in Today's World Last Time We discussed the four rules that govern probabilities: 1. Probabilities are numbers between 0 and 1 2. The probability an event does not occur is 1 minus
Descriptive Statistics (And a little bit on rounding and significant digits)
") Descriptive Statistics (And a little bit on rounding and significant digits) Now that we know what our data look like, we d like to be able to describe it numerically. In other words, how can we represent
Descriptive Statistics (And a little bit on rounding and significant digits) Now that we know what our data look like, we d like to be able to describe it numerically. In other words, how can we represent
Probability, Statistics, and Bayes Theorem Session 3
 Probability, Statistics, and Bayes Theorem Session 3 1 Introduction Now that we know what Bayes Theorem is, we want to explore some of the ways that it can be used in real-life situations. Often the results
Statistics Boot Camp. Dr. Stephanie Lane Institute for Defense Analyses DATAWorks 2018
 Statistics Boot Camp Dr. Stephanie Lane Institute for Defense Analyses DATAWorks 2018 March 21, 2018 Outline of boot camp Summarizing and simplifying data Point and interval estimation Foundations of statistical
Chapter 22. Comparing Two Proportions 1 /29
 Chapter 22 Comparing Two Proportions 1 /29 Homework p519 2, 4, 12, 13, 15, 17, 18, 19, 24 2 /29 Objective Students test null and alternate hypothesis about two population proportions. 3 /29 Comparing Two
Tutorial 3: Power and Sample Size for the Two-sample t-test with Equal Variances. Acknowledgements:
 Tutorial 3: Power and Sample Size for the Two-sample t-test with Equal Variances Anna E. Barón, Keith E. Muller, Sarah M. Kreidler, and Deborah H. Glueck Acknowledgements: The project was supported in
Non-Inferiority Tests for the Ratio of Two Proportions in a Cluster- Randomized Design
 Chapter 236 Non-Inferiority Tests for the Ratio of Two Proportions in a Cluster- Randomized Design Introduction This module provides power analysis and sample size calculation for non-inferiority tests
Notes 3: Statistical Inference: Sampling, Sampling Distributions Confidence Intervals, and Hypothesis Testing
 Notes 3: Statistical Inference: Sampling, Sampling Distributions Confidence Intervals, and Hypothesis Testing 1. Purpose of statistical inference Statistical inference provides a means of generalizing
Chapter 8. Linear Regression. The Linear Model. Fat Versus Protein: An Example. The Linear Model (cont.) Residuals
 Residuals") Chapter 8 Linear Regression Copyright 2007 Pearson Education, Inc. Publishing as Pearson Addison-Wesley Slide 8-1 Copyright 2007 Pearson Education, Inc. Publishing as Pearson Addison-Wesley Fat Versus
Chapter 8 Linear Regression Copyright 2007 Pearson Education, Inc. Publishing as Pearson Addison-Wesley Slide 8-1 Copyright 2007 Pearson Education, Inc. Publishing as Pearson Addison-Wesley Fat Versus
M(t) = 1 t. (1 t), 6 M (0) = 20 P (95. X i 110) i=1
 = 1 t. (1 t), 6 M (0) = 20 P (95. X i 110) i=1") Math 66/566 - Midterm Solutions NOTE: These solutions are for both the 66 and 566 exam. The problems are the same until questions and 5. 1. The moment generating function of a random variable X is M(t)
Math 66/566 - Midterm Solutions NOTE: These solutions are for both the 66 and 566 exam. The problems are the same until questions and 5. 1. The moment generating function of a random variable X is M(t)
Econ 325: Introduction to Empirical Economics
 Econ 325: Introduction to Empirical Economics Chapter 9 Hypothesis Testing: Single Population Ch. 9-1 9.1 What is a Hypothesis? A hypothesis is a claim (assumption) about a population parameter: population
, (1) e i = ˆσ 1 h ii. c 2016, Jeffrey S. Simonoff 1
 e i = ˆσ 1 h ii. c 2016, Jeffrey S. Simonoff 1") Regression diagnostics As is true of all statistical methodologies, linear regression analysis can be a very effective way to model data, as along as the assumptions being made are true. For the regression
Regression diagnostics As is true of all statistical methodologies, linear regression analysis can be a very effective way to model data, as along as the assumptions being made are true. For the regression
Wooldridge, Introductory Econometrics, 4th ed. Appendix C: Fundamentals of mathematical statistics
 Wooldridge, Introductory Econometrics, 4th ed. Appendix C: Fundamentals of mathematical statistics A short review of the principles of mathematical statistics (or, what you should have learned in EC 151).
STAT/SOC/CSSS 221 Statistical Concepts and Methods for the Social Sciences. Random Variables
 STAT/SOC/CSSS 221 Statistical Concepts and Methods for the Social Sciences Random Variables Christopher Adolph Department of Political Science and Center for Statistics and the Social Sciences University
CENTRAL LIMIT THEOREM (CLT)
") CENTRAL LIMIT THEOREM (CLT) A sampling distribution is the probability distribution of the sample statistic that is formed when samples of size n are repeatedly taken from a population. If the sample statistic
CENTRAL LIMIT THEOREM (CLT) A sampling distribution is the probability distribution of the sample statistic that is formed when samples of size n are repeatedly taken from a population. If the sample statistic
Introducing Generalized Linear Models: Logistic Regression
 Ron Heck, Summer 2012 Seminars 1 Multilevel Regression Models and Their Applications Seminar Introducing Generalized Linear Models: Logistic Regression The generalized linear model (GLM) represents and
Lecture 10: Alternatives to OLS with limited dependent variables. PEA vs APE Logit/Probit Poisson
 Lecture 10: Alternatives to OLS with limited dependent variables PEA vs APE Logit/Probit Poisson PEA vs APE PEA: partial effect at the average The effect of some x on y for a hypothetical case with sample
CONTENTS OF DAY 2. II. Why Random Sampling is Important 10 A myth, an urban legend, and the real reason NOTES FOR SUMMER STATISTICS INSTITUTE COURSE
 1 2 CONTENTS OF DAY 2 I. More Precise Definition of Simple Random Sample 3 Connection with independent random variables 4 Problems with small populations 9 II. Why Random Sampling is Important 10 A myth,
Stat 705: Completely randomized and complete block designs
 Stat 705: Completely randomized and complete block designs Timothy Hanson Department of Statistics, University of South Carolina Stat 705: Data Analysis II 1 / 16 Experimental design Our department offers
Hypothesis Testing with Z and T
 Chapter Eight Hypothesis Testing with Z and T Introduction to Hypothesis Testing P Values Critical Values Within-Participants Designs Between-Participants Designs Hypothesis Testing An alternate hypothesis
Ron Heck, Fall Week 8: Introducing Generalized Linear Models: Logistic Regression 1 (Replaces prior revision dated October 20, 2011)
") Ron Heck, Fall 2011 1 EDEP 768E: Seminar in Multilevel Modeling rev. January 3, 2012 (see footnote) Week 8: Introducing Generalized Linear Models: Logistic Regression 1 (Replaces prior revision dated October
Ron Heck, Fall 2011 1 EDEP 768E: Seminar in Multilevel Modeling rev. January 3, 2012 (see footnote) Week 8: Introducing Generalized Linear Models: Logistic Regression 1 (Replaces prior revision dated October
Probability and Statistics
 Probability and Statistics Kristel Van Steen, PhD 2 Montefiore Institute - Systems and Modeling GIGA - Bioinformatics ULg kristel.vansteen@ulg.ac.be CHAPTER 4: IT IS ALL ABOUT DATA 4a - 1 CHAPTER 4: IT
Bias Variance Trade-off
 Bias Variance Trade-off The mean squared error of an estimator MSE(ˆθ) = E([ˆθ θ] 2 ) Can be re-expressed MSE(ˆθ) = Var(ˆθ) + (B(ˆθ) 2 ) MSE = VAR + BIAS 2 Proof MSE(ˆθ) = E((ˆθ θ) 2 ) = E(([ˆθ E(ˆθ)]
1 The Classic Bivariate Least Squares Model
 Review of Bivariate Linear Regression Contents 1 The Classic Bivariate Least Squares Model 1 1.1 The Setup............................... 1 1.2 An Example Predicting Kids IQ................. 1 2 Evaluating
Simple Regression Model. January 24, 2011
 Simple Regression Model January 24, 2011 Outline Descriptive Analysis Causal Estimation Forecasting Regression Model We are actually going to derive the linear regression model in 3 very different ways
Many natural processes can be fit to a Poisson distribution
 BE.104 Spring Biostatistics: Poisson Analyses and Power J. L. Sherley Outline 1) Poisson analyses 2) Power What is a Poisson process? Rare events Values are observational (yes or no) Random distributed
Appendix A. Review of Basic Mathematical Operations. 22Introduction
 Appendix A Review of Basic Mathematical Operations I never did very well in math I could never seem to persuade the teacher that I hadn t meant my answers literally. Introduction Calvin Trillin Many of
Mathematical Statistics
 Mathematical Statistics MAS 713 Chapter 8 Previous lecture: 1 Bayesian Inference 2 Decision theory 3 Bayesian Vs. Frequentist 4 Loss functions 5 Conjugate priors Any questions? Mathematical Statistics
Click to edit Master title style
 Impact Evaluation Technical Track Session IV Click to edit Master title style Instrumental Variables Christel Vermeersch Amman, Jordan March 8-12, 2009 Click to edit Master subtitle style Human Development
Hierarchical Generalized Linear Models. ERSH 8990 REMS Seminar on HLM Last Lecture!
 Hierarchical Generalized Linear Models ERSH 8990 REMS Seminar on HLM Last Lecture! Hierarchical Generalized Linear Models Introduction to generalized models Models for binary outcomes Interpreting parameter
Sample Size Calculations for Group Randomized Trials with Unequal Sample Sizes through Monte Carlo Simulations
 Sample Size Calculations for Group Randomized Trials with Unequal Sample Sizes through Monte Carlo Simulations Ben Brewer Duke University March 10, 2017 Introduction Group randomized trials (GRTs) are
Biostatistics and Design of Experiments Prof. Mukesh Doble Department of Biotechnology Indian Institute of Technology, Madras
 Biostatistics and Design of Experiments Prof. Mukesh Doble Department of Biotechnology Indian Institute of Technology, Madras Lecture - 39 Regression Analysis Hello and welcome to the course on Biostatistics
Classification 1: Linear regression of indicators, linear discriminant analysis
 Classification 1: Linear regression of indicators, linear discriminant analysis Ryan Tibshirani Data Mining: 36-462/36-662 April 2 2013 Optional reading: ISL 4.1, 4.2, 4.4, ESL 4.1 4.3 1 Classification
appstats27.notebook April 06, 2017
 Chapter 27 Objective Students will conduct inference on regression and analyze data to write a conclusion. Inferences for Regression An Example: Body Fat and Waist Size pg 634 Our chapter example revolves
Regression Analysis: Exploring relationships between variables. Stat 251
 Regression Analysis: Exploring relationships between variables Stat 251 Introduction Objective of regression analysis is to explore the relationship between two (or more) variables so that information
Chapter 22. Comparing Two Proportions 1 /30
 Chapter 22 Comparing Two Proportions 1 /30 Homework p519 2, 4, 12, 13, 15, 17, 18, 19, 24 2 /30 3 /30 Objective Students test null and alternate hypothesis about two population proportions. 4 /30 Comparing
Chapter 11. Correlation and Regression
 Chapter 11. Correlation and Regression The word correlation is used in everyday life to denote some form of association. We might say that we have noticed a correlation between foggy days and attacks of
Tutorial 5: Power and Sample Size for One-way Analysis of Variance (ANOVA) with Equal Variances Across Groups. Acknowledgements:
 with Equal Variances Across Groups. Acknowledgements:") Tutorial 5: Power and Sample Size for One-way Analysis of Variance (ANOVA) with Equal Variances Across Groups Anna E. Barón, Keith E. Muller, Sarah M. Kreidler, and Deborah H. Glueck Acknowledgements:
Tutorial 5: Power and Sample Size for One-way Analysis of Variance (ANOVA) with Equal Variances Across Groups Anna E. Barón, Keith E. Muller, Sarah M. Kreidler, and Deborah H. Glueck Acknowledgements:
CS 361: Probability & Statistics
 February 19, 2018 CS 361: Probability & Statistics Random variables Markov s inequality This theorem says that for any random variable X and any value a, we have A random variable is unlikely to have an
 STOCKHOLM UNIVERSITY Department of Economics Course name: Empirical Methods Course code: EC40 Examiner: Lena Nekby Number of credits: 7,5 credits Date of exam: Saturday, May 9, 008 Examination time: 3
Uncertainty. Michael Peters December 27, 2013
 Uncertainty Michael Peters December 27, 20 Lotteries In many problems in economics, people are forced to make decisions without knowing exactly what the consequences will be. For example, when you buy
Preliminary Statistics. Lecture 5: Hypothesis Testing
 Preliminary Statistics Lecture 5: Hypothesis Testing Rory Macqueen (rm43@soas.ac.uk), September 2015 Outline Elements/Terminology of Hypothesis Testing Types of Errors Procedure of Testing Significance
appstats8.notebook October 11, 2016
 Chapter 8 Linear Regression Objective: Students will construct and analyze a linear model for a given set of data. Fat Versus Protein: An Example pg 168 The following is a scatterplot of total fat versus
Tutorial 4: Power and Sample Size for the Two-sample t-test with Unequal Variances
 Tutorial 4: Power and Sample Size for the Two-sample t-test with Unequal Variances Preface Power is the probability that a study will reject the null hypothesis. The estimated probability is a function
Lecture Stat 302 Introduction to Probability - Slides 5
 Lecture Stat 302 Introduction to Probability - Slides 5 AD Jan. 2010 AD () Jan. 2010 1 / 20 Conditional Probabilities Conditional Probability. Consider an experiment with sample space S. Let E and F be
Descriptive Statistics-I. Dr Mahmoud Alhussami
 Descriptive Statistics-I Dr Mahmoud Alhussami Biostatistics What is the biostatistics? A branch of applied math. that deals with collecting, organizing and interpreting data using well-defined procedures.
Note that we are looking at the true mean, μ, not y. The problem for us is that we need to find the endpoints of our interval (a, b).
.") Confidence Intervals 1) What are confidence intervals? Simply, an interval for which we have a certain confidence. For example, we are 90% certain that an interval contains the true value of something
Confidence Intervals 1) What are confidence intervals? Simply, an interval for which we have a certain confidence. For example, we are 90% certain that an interval contains the true value of something
30. TRANSFORMING TOOL #1 (the Addition Property of Equality)
") 30 TRANSFORMING TOOL #1 (the Addition Property of Equality) sentences that look different, but always have the same truth values What can you DO to a sentence that will make it LOOK different, but not
30 TRANSFORMING TOOL #1 (the Addition Property of Equality) sentences that look different, but always have the same truth values What can you DO to a sentence that will make it LOOK different, but not
STANDARDS OF LEARNING CONTENT REVIEW NOTES. ALGEBRA I Part II 1 st Nine Weeks,
 STANDARDS OF LEARNING CONTENT REVIEW NOTES ALGEBRA I Part II 1 st Nine Weeks, 2016-2017 OVERVIEW Algebra I Content Review Notes are designed by the High School Mathematics Steering Committee as a resource
Background to Statistics
 FACT SHEET Background to Statistics Introduction Statistics include a broad range of methods for manipulating, presenting and interpreting data. Professional scientists of all kinds need to be proficient
Econ 1123: Section 2. Review. Binary Regressors. Bivariate. Regression. Omitted Variable Bias
 Contact Information Elena Llaudet Sections are voluntary. My office hours are Thursdays 5pm-7pm in Littauer Mezzanine 34-36 (Note room change) You can email me administrative questions to ellaudet@gmail.com.
Chapter 1 Statistical Inference
 Chapter 1 Statistical Inference causal inference To infer causality, you need a randomized experiment (or a huge observational study and lots of outside information). inference to populations Generalizations
3.2 Probability Rules
 3.2 Probability Rules The idea of probability rests on the fact that chance behavior is predictable in the long run. In the last section, we used simulation to imitate chance behavior. Do we always need
Chapter 27 Summary Inferences for Regression
 Chapter 7 Summary Inferences for Regression What have we learned? We have now applied inference to regression models. Like in all inference situations, there are conditions that we must check. We can test
Final Exam Details. J. Parman (UC-Davis) Analysis of Economic Data, Winter 2011 March 8, / 24
 Analysis of Economic Data, Winter 2011 March 8, / 24") Final Exam Details The final is Thursday, March 17 from 10:30am to 12:30pm in the regular lecture room The final is cumulative (multiple choice will be a roughly 50/50 split between material since the
Final Exam Details The final is Thursday, March 17 from 10:30am to 12:30pm in the regular lecture room The final is cumulative (multiple choice will be a roughly 50/50 split between material since the
AP Statistics Semester I Examination Section I Questions 1-30 Spend approximately 60 minutes on this part of the exam.
 AP Statistics Semester I Examination Section I Questions 1-30 Spend approximately 60 minutes on this part of the exam. Name: Directions: The questions or incomplete statements below are each followed by
Topic 17: Simple Hypotheses
 Topic 17: November, 2011 1 Overview and Terminology Statistical hypothesis testing is designed to address the question: Do the data provide sufficient evidence to conclude that we must depart from our
Friday, March 15, 13. Mul$ple Regression
 Mul$ple Regression Mul$ple Regression I have a hypothesis about the effect of X on Y. Why might we need addi$onal variables? Confounding variables Condi$onal independence Reduce/eliminate bias in es$mates
14.74 Lecture 10: The returns to human capital: education
 14.74 Lecture 10: The returns to human capital: education Esther Duflo March 7, 2011 Education is a form of human capital. You invest in it, and you get returns, in the form of higher earnings, etc...
Last few slides from last time
 Last few slides from last time Example 3: What is the probability that p will fall in a certain range, given p? Flip a coin 50 times. If the coin is fair (p=0.5), what is the probability of getting an
Objectives Simple linear regression. Statistical model for linear regression. Estimating the regression parameters
 Objectives 10.1 Simple linear regression Statistical model for linear regression Estimating the regression parameters Confidence interval for regression parameters Significance test for the slope Confidence
CHOOSING THE RIGHT SAMPLING TECHNIQUE FOR YOUR RESEARCH. Awanis Ku Ishak, PhD SBM
 CHOOSING THE RIGHT SAMPLING TECHNIQUE FOR YOUR RESEARCH Awanis Ku Ishak, PhD SBM Sampling The process of selecting a number of individuals for a study in such a way that the individuals represent the larger
Statistical Distribution Assumptions of General Linear Models
 Statistical Distribution Assumptions of General Linear Models Applied Multilevel Models for Cross Sectional Data Lecture 4 ICPSR Summer Workshop University of Colorado Boulder Lecture 4: Statistical Distributions
Lecturer: Dr. Adote Anum, Dept. of Psychology Contact Information:
 Lecturer: Dr. Adote Anum, Dept. of Psychology Contact Information: aanum@ug.edu.gh College of Education School of Continuing and Distance Education 2014/2015 2016/2017 Session Overview In this Session
ACMS Statistics for Life Sciences. Chapter 13: Sampling Distributions
 ACMS 20340 Statistics for Life Sciences Chapter 13: Sampling Distributions Sampling We use information from a sample to infer something about a population. When using random samples and randomized experiments,
WELCOME! Lecture 13 Thommy Perlinger
 Quantitative Methods II WELCOME! Lecture 13 Thommy Perlinger Parametrical tests (tests for the mean) Nature and number of variables One-way vs. two-way ANOVA One-way ANOVA Y X 1 1 One dependent variable
Business Statistics. Lecture 9: Simple Regression
 Business Statistics Lecture 9: Simple Regression 1 On to Model Building! Up to now, class was about descriptive and inferential statistics Numerical and graphical summaries of data Confidence intervals
5/15/2017. Sample Size and Power. Henry Glick May 12, Goals of Sample Size and Power Analysis
 Sample Size and Power Henry Glick www.uphs.upenn.edu/dgimhsr May 1, 017 Goals of Sample Size and Power Analysis Sample size calculation Given a desired alpha (α) and beta (β), proactively manages probability
8. TRANSFORMING TOOL #1 (the Addition Property of Equality)
") 8 TRANSFORMING TOOL #1 (the Addition Property of Equality) sentences that look different, but always have the same truth values What can you DO to a sentence that will make it LOOK different, but not change
8 TRANSFORMING TOOL #1 (the Addition Property of Equality) sentences that look different, but always have the same truth values What can you DO to a sentence that will make it LOOK different, but not change
Fundamentals of Applied Sampling
 1 Chapter 5 Fundamentals of Applied Sampling Thomas Piazza 5.1 The Basic Idea of Sampling Survey sampling is really quite remarkable. In research we often want to know certain characteristics of a large