Applying cluster analysis to 2011 Census local authority data
|
|
|
- Tiffany Harrington
- 5 years ago
- Views:
Transcription
1 Applying cluster analysis to 2011 Census local authority data SPSS User Group Conference November,
2 Outline Basic ideas of cluster analysis How to choose variables How to apply hierarchical and non hierarchical clustering Select the number of clusters to be formed Cluster Profiling
3 What is cluster analysis? Cluster analysis partitions the sample into groups on the basis of attributes that make them similar. The groups are mutually exclusive so that they best represent distinct sets of observations within the sample. Minimizes within-group variance and maximizes between-group variance. Plotted geometrically objects within clusters should be close together.
4 What is cluster analysis? a) Objects b) Two clusters c) Four clusters d) Six clusters
5 Measuring similarity Similarity represents the degree of correspondence among objects across dimensions. Inter-object similarity is measured by distance between pairs of objects. Euclidean distance Squared Euclidean distance: Euclidean distance without square root. City-block (Manhattan) distance: sum of the variables absolute differences. Chebychev distance: the maximum absolute difference in values for any variable.
6 How do we form clusters? Hierarchical (agglomerative) methods start with each observation as a cluster then combine observations sequentially to form clusters until there is only one large cluster. Non-hierarchical methods assign observations into clusters once the number of clusters is specified so that each observation belongs to a cluster with the nearest mean. Combination of methods (e.g. Two-step cluster analysis).
7 Hierarchical and non-hierarchical CA Hierarchical method Advantages: Generates cluster solutions from 1 to n. Can handle different types of variables. Disadvantages: Long computation (agglomerative); not suitable for large samples. To remove outliers need to re-run the cluster analysis several times. Rigid once observations are assigned to a cluster they cannot move to another. Non-hierarchical (K-Means) method Advantages: Provides clusters that satisfy some optimality criterion; less sensitive to outliers and irrelevant variables; quick computation time for large datasets, allows objects to move from one cluster to another. Disadvantages: Define K in advance; cannot get range of solutions at the same time; sensitive to the choice of initial cluster centres.
8 Which variables? Variable selection should be guided by theoretical, conceptual and practical considerations. Choose variables that best describe the similarity between objects that are relevant to the research problem. Sample size should be large enough to adequately represent the groups. Start with a large number of variables and reduce to a subset of the most relevant variables that are likely to lead to the most optimal solution.
9 Which variables? Variables can be nominal, ordinal, scale or combination. Variables showing sufficient variation. Variables should not exhibit very high correlation with other variables (unless unequal weighting is desired). Variables with outliers are problematic. Variables may need to be standardised if the range or scale of one variable is much larger or different from the others. Variables may need preparation(e.g. cleaning data, removing outliers) and transformations for normalisation purposes (standardandisation).
10 Hierarchical clustering Single linkage (Nearest neighbor): shortest distance between objects. Pros: good for natural clusters that are not spherical or eliptical. Cons: poorly delineated cluster structures within the data can result in snakelike chains for clusters. Complete linkage (Furthest neighbor): largest distance between objects. Pros: produces similar sized clusters Cons: sensitive to outliers. Average linkage (Between groups): average distance between objects. Pros: robust; less affected by outliers; generates clusters with small within-cluster variation. Ward's method: sum of squares within clusters, summed over all variables. Pros: produces similar sized clusters. Cons: sensitive to outliers; cannot use distance measures other than Squared Euclidean distance. Centroid linkage: distance between cluster centroids. Pros: robust; less sensitive to outliers. Cons: cannot use distances measures other than Squared Euclidean distance.
11 How many clusters? There is no generally accepted procedure for determining the cluster solution. Cluster analysis will always result in a solution but it may not be meaningful or relevant. Decide on validity of groupings, theoretical justification and practicality of results (Can you interpret the results? Are they meaningful?). Use inter-cluster distances. Between-groups sum of squares or likelihood can be plotted against the number of clusters in a dendrogram.
12 Cluster Profiling Cluster profiling involves calculating the mean values for each cluster. The profiles are usually based on the cluster variables (used to form the clusters). They can also involve external variables e.g. demographic, socio-economic variables not included in the cluster analysis. Interpreting or labeling the clusters will involve examination of the cluster profiles and deciding whether they are meaningful. In geodemographics examining the spatial distribution of clusters enhances understanding about the clusters (helps with cluster naming).
13 Hierarchical cluster analysis in SPSS
14 Dataset description Variables drawn from the 2011 Census for 348 local authorities in England and Wales to examine area deprivation Households with an occupancy rating -1or less Households with no central heating Lone parent households Households with no car or van People aged 16 to 74 with no qualifications People aged 16 to 74 unemployed People with LLTI Households in social housing People who belong to an ethnic minority group other than White British People aged 16 to 74 in semi-routine occupations People aged 16 to 74 in routine occupations


15 To select a random sample go to Data Select Cases

16 From the main menu of SPSS select Analyze Classify Hierarchical Cluster.
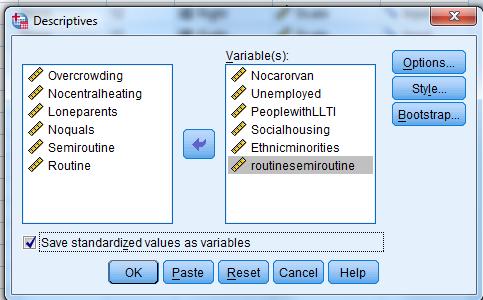
17 Select the variables in the Variable(s) box Nocarorvan; Unemployed; PeoplewithLLTI; Socialhousing; Ethnicminorities; Routinesemiroutine Next click on Plots Specify how you wish your cases to be identified e.g. ID number. Here we choose LAname

18 In Plots tick Dendrogram. The next option is for the Icicle. It is generally more difficult to interpret so tick None.

19 Cluster Method. Betweengroup linkage computes the smallest average distance between all group pairs and combines the two groups that are closest. Measure. This is the method used for measuring the distance between clusters. Interval measure gives us dissimilarity and similarity measures for interval data. The Squared Euclidean distance gives the squared differences between the values for the cases. Transform values Select Z scores and By variable in Standardize

20 Ward s Method: all possible pairs of clusters are combined and the sum of the squared distances within each cluster is calculated. This is then summed over all clusters. The combination that gives the lowest sum of squares is chosen.

21 Select Save to save cluster memberships: None (default) doesn t save the solution. Single Solution saves the cluster membership for a specified solution. Range of Solutions will save more than one variable.

22 Vertical lines in the Dendrogram represent clusters that are joined together at each stage. The position of the line on the scale shows the distances at which clusters were joined.
23 Examine the agglomeration schedule to find the cluster solution The solution before the jump indicates the good solution. Rewrite the agglomeration table with the change in coefficients. Coefficients No of clusters Last This Change step step

24 You can examine the cluster membership for each of the solutions. Go to the main menu of SPSS select Analyze Descriptive Statistics Frequencies Select the cluster membership variables CLU5_2 CLU4_2 CLU3_2 CLU2_2 in Variable(s) and Click OK.
25 Number of observations in each cluster. Is a cluster with 1 observation useful?
26 K Means cluster analysis in SPSS
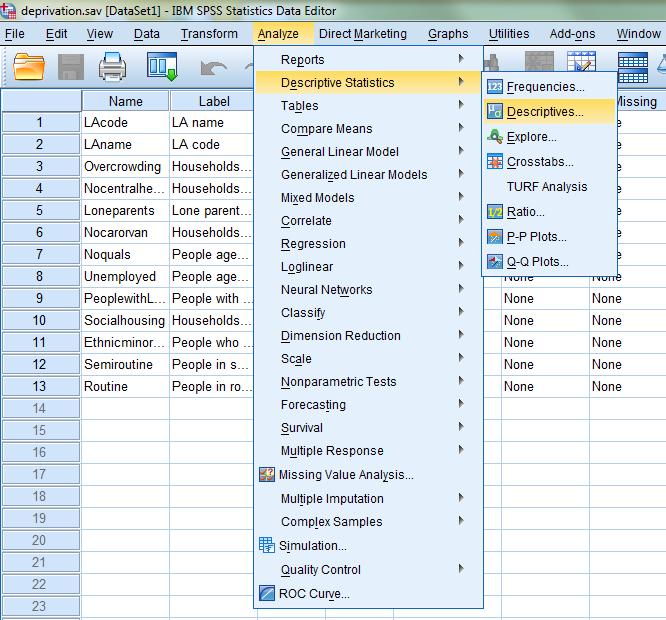
27 Analyze Descriptive Statistics Descriptives

28 Analyze Classify K-Means Cluster
29 Select the standardized variables to the Variables list Label Cases by LAname In Number of Clusters enter 5 In Method select Iterate and Classify


30 Save new variables showing Cluster Membership and Distance from cluster center for each object
31 The Iteration History shows the number of times SPSS passed through the data before finding stable clusters. After the sixth iteration there was no measurable change in cluster centres, and SPSS decided that these were the final centres.
32 Cluster 4: above average unemployment, LLTI, social housing and routine occupations but lower levels of people from ethnic minorities. Cluster 5: above average ethnic minorities and people with no car or van but below average LLTI and routine occs (London?). Cluster 1: above average levels of unemployment and people from ethnic minorities. Cluster 2: below average values on nearly all variables (affluence?). Cluster 3: mixture of low and high values (socio-economic diversity?).
33 Which cluster or group of local authorities is the most deprived? Which cluster or group of local authorities is the least deprived? How would you describe the other three clusters?
34 The Cluster Membership table (first 35 cases shown here) shows the distance of each case from the cluster centre, indicating how typical the case is of its cluster.
35 Distances between final cluster centres and the number of cases within each cluster. Largest clusters are cluster 2 and cluster 4. Cluster 5 has only 6 cases.
36
National Statistics 2001 Area Classifications
 National Statistics 2001 Area Classifications John Charlton, ONS see http://neighbourhood.statistics.gov.uk areaclassifications@ons.gov.uk Copyright ONS What are the Area Classifications Summarise 2001
Marielle Caccam Jewel Refran
 Marielle Caccam Jewel Refran Cluster analysis is a group of multivariate techniques whose primary purpose is to group objects (e.g., respondents, products, or other entities) based on the characteristics
2. Sample representativeness. That means some type of probability/random sampling.
 1 Neuendorf Cluster Analysis Model: X1 X2 X3 X4 X5 Clusters (Nominal variable) Y1 Y2 Y3 Clustering/Internal Variables External Variables Assumes: 1. Actually, any level of measurement (nominal, ordinal,
Clustering. CSL465/603 - Fall 2016 Narayanan C Krishnan
 Clustering CSL465/603 - Fall 2016 Narayanan C Krishnan ckn@iitrpr.ac.in Supervised vs Unsupervised Learning Supervised learning Given x ", y " "%& ', learn a function f: X Y Categorical output classification
2. Sample representativeness. That means some type of probability/random sampling.
 1 Neuendorf Cluster Analysis Assumes: 1. Actually, any level of measurement (nominal, ordinal, interval/ratio) is accetable for certain tyes of clustering. The tyical methods, though, require metric (I/R)
Creating a Geodemographic Classification
 Creating a Geodemographic Classification Dr Daniel Vickers Department of Geography, University of Sheffield D.Vickers@sheffield.ac.uk www.shef.ac.uk/sasi www.areaclassification.org.uk Why classify areas?
Data Preprocessing. Cluster Similarity
 1 Cluster Similarity Similarity is most often measured with the help of a distance function. The smaller the distance, the more similar the data objects (points). A function d: M M R is a distance on M
Data Exploration and Unsupervised Learning with Clustering
 Data Exploration and Unsupervised Learning with Clustering Paul F Rodriguez,PhD San Diego Supercomputer Center Predictive Analytic Center of Excellence Clustering Idea Given a set of data can we find a
Further Mathematics 2018 CORE: Data analysis Chapter 2 Summarising numerical data
 Chapter 2: Summarising numerical data Further Mathematics 2018 CORE: Data analysis Chapter 2 Summarising numerical data Extract from Study Design Key knowledge Types of data: categorical (nominal and ordinal)
Cluster Analysis CHAPTER PREVIEW KEY TERMS
 LEARNING OBJECTIVES Upon completing this chapter, you should be able to do the following: Define cluster analysis, its roles, and its limitations. Identify the types of research questions addressed by
Multivariate Analysis Cluster Analysis
 Multivariate Analysis Cluster Analysis Prof. Dr. Anselmo E de Oliveira anselmo.quimica.ufg.br anselmo.disciplinas@gmail.com Cluster Analysis System Samples Measurements Similarities Distances Clusters
Principles of Pattern Recognition. C. A. Murthy Machine Intelligence Unit Indian Statistical Institute Kolkata
 Principles of Pattern Recognition C. A. Murthy Machine Intelligence Unit Indian Statistical Institute Kolkata e-mail: murthy@isical.ac.in Pattern Recognition Measurement Space > Feature Space >Decision
Multivariate Statistics
 Multivariate Statistics Chapter 6: Cluster Analysis Pedro Galeano Departamento de Estadística Universidad Carlos III de Madrid pedro.galeano@uc3m.es Course 2017/2018 Master in Mathematical Engineering
Using SPSS for One Way Analysis of Variance
 Using SPSS for One Way Analysis of Variance This tutorial will show you how to use SPSS version 12 to perform a one-way, between- subjects analysis of variance and related post-hoc tests. This tutorial
Multivariate Statistics: Hierarchical and k-means cluster analysis
 Multivariate Statistics: Hierarchical and k-means cluster analysis Steffen Unkel Department of Medical Statistics University Medical Center Goettingen, Germany Summer term 217 1/43 What is a cluster? Proximity
Machine Learning - MT Clustering
 Machine Learning - MT 2016 15. Clustering Varun Kanade University of Oxford November 28, 2016 Announcements No new practical this week All practicals must be signed off in sessions this week Firm Deadline:
Geographical Inequalities and Population Change in Britain,
 Geographical Inequalities and Population Change in Britain, 1971-2011 Chris Lloyd, Nick Bearman, Gemma Catney Centre for Spatial Demographics Research, University of Liverpool, UK Email: c.d.lloyd@liverpool.ac.uk
STATISTICA MULTIVARIATA 2
 1 / 73 STATISTICA MULTIVARIATA 2 Fabio Rapallo Dipartimento di Scienze e Innovazione Tecnologica Università del Piemonte Orientale, Alessandria (Italy) fabio.rapallo@uniupo.it Alessandria, May 2016 2 /
Answer keys for Assignment 10: Measurement of study variables (The correct answer is underlined in bold text)
") Answer keys for Assignment 10: Measurement of study variables (The correct answer is underlined in bold text) 1. A quick and easy indicator of dispersion is a. Arithmetic mean b. Variance c. Standard deviation
Answer keys for Assignment 10: Measurement of study variables (The correct answer is underlined in bold text) 1. A quick and easy indicator of dispersion is a. Arithmetic mean b. Variance c. Standard deviation
Classification methods
 Multivariate analysis (II) Cluster analysis and Cronbach s alpha Classification methods 12 th JRC Annual Training on Composite Indicators & Multicriteria Decision Analysis (COIN 2014) dorota.bialowolska@jrc.ec.europa.eu
University of Florida CISE department Gator Engineering. Clustering Part 1
 Clustering Part 1 Dr. Sanjay Ranka Professor Computer and Information Science and Engineering University of Florida, Gainesville What is Cluster Analysis? Finding groups of objects such that the objects
Unsupervised machine learning
 Chapter 9 Unsupervised machine learning Unsupervised machine learning (a.k.a. cluster analysis) is a set of methods to assign objects into clusters under a predefined distance measure when class labels
Chapter 5-2: Clustering
 Chapter 5-2: Clustering Jilles Vreeken Revision 1, November 20 th typo s fixed: dendrogram Revision 2, December 10 th clarified: we do consider a point x as a member of its own ε-neighborhood 12 Nov 2015
ANALYSIS OF SURVEY DATA USING SPSS
 11 ANALYSIS OF SURVEY DATA USING SPSS U.C. Sud Indian Agricultural Statistics Research Institute, New Delhi-110012 11.1 INTRODUCTION SPSS version 13.0 has many additional features over the version 12.0.
ESRI 2008 Health GIS Conference
 ESRI 2008 Health GIS Conference An Exploration of Geographically Weighted Regression on Spatial Non- Stationarity and Principal Component Extraction of Determinative Information from Robust Datasets A
AS Population Change Question spotting
 AS Change Question spotting Changing rate of growth How the rate of growth has changed over the last 100 years Explain the reasons for these changes Describe global or national distribution. Study the
Cluster Analysis (Sect. 9.6/Chap. 14 of Wilks) Notes by Hong Li
 Notes by Hong Li") 77 Cluster Analysis (Sect. 9.6/Chap. 14 of Wilks) Notes by Hong Li 1) Introduction Cluster analysis deals with separating data into groups whose identities are not known in advance. In general, even the
77 Cluster Analysis (Sect. 9.6/Chap. 14 of Wilks) Notes by Hong Li 1) Introduction Cluster analysis deals with separating data into groups whose identities are not known in advance. In general, even the
Clustering. Genome 559: Introduction to Statistical and Computational Genomics Elhanan Borenstein. Some slides adapted from Jacques van Helden
 Clustering Genome 559: Introduction to Statistical and Computational Genomics Elhanan Borenstein Some slides adapted from Jacques van Helden Small vs. large parsimony A quick review Fitch s algorithm:
An introduction to clustering techniques
 - ABSTRACT Cluster analysis has been used in a wide variety of fields, such as marketing, social science, biology, pattern recognition etc. It is used to identify homogenous groups of cases to better understand
More on Unsupervised Learning
 More on Unsupervised Learning Two types of problems are to find association rules for occurrences in common in observations (market basket analysis), and finding the groups of values of observational data
Multivariate Analysis
 Multivariate Analysis Chapter 5: Cluster analysis Pedro Galeano Departamento de Estadística Universidad Carlos III de Madrid pedro.galeano@uc3m.es Course 2015/2016 Master in Business Administration and
Mapping Welsh Neighbourhood Types. Dr Scott Orford Wales Institute for Social and Economic Research, Data and Methods WISERD
 Mapping Welsh Neighbourhood Types Dr Scott Orford Wales Institute for Social and Economic Research, Data and Methods WISERD orfords@cardiff.ac.uk WISERD Established in 2008 and funded by the ESRC and HEFCW
Clustering using Mixture Models
 Clustering using Mixture Models The full posterior of the Gaussian Mixture Model is p(x, Z, µ,, ) =p(x Z, µ, )p(z )p( )p(µ, ) data likelihood (Gaussian) correspondence prob. (Multinomial) mixture prior
Anomaly (outlier) detection. Huiping Cao, Anomaly 1
 detection. Huiping Cao, Anomaly 1") Anomaly (outlier) detection Huiping Cao, Anomaly 1 Outline General concepts What are outliers Types of outliers Causes of anomalies Challenges of outlier detection Outlier detection approaches Huiping
Anomaly (outlier) detection Huiping Cao, Anomaly 1 Outline General concepts What are outliers Types of outliers Causes of anomalies Challenges of outlier detection Outlier detection approaches Huiping
Overview of clustering analysis. Yuehua Cui
 Overview of clustering analysis Yuehua Cui Email: cuiy@msu.edu http://www.stt.msu.edu/~cui A data set with clear cluster structure How would you design an algorithm for finding the three clusters in this
Time Series Classification
 Distance Measures Classifiers DTW vs. ED Further Work Questions August 31, 2017 Distance Measures Classifiers DTW vs. ED Further Work Questions Outline 1 2 Distance Measures 3 Classifiers 4 DTW vs. ED
Module Master Recherche Apprentissage et Fouille
 Module Master Recherche Apprentissage et Fouille Michele Sebag Balazs Kegl Antoine Cornuéjols http://tao.lri.fr 19 novembre 2008 Unsupervised Learning Clustering Data Streaming Application: Clustering
Statistics 202: Data Mining. c Jonathan Taylor. Model-based clustering Based in part on slides from textbook, slides of Susan Holmes.
 Model-based clustering Based in part on slides from textbook, slides of Susan Holmes December 2, 2012 1 / 1 Model-based clustering General approach Choose a type of mixture model (e.g. multivariate Normal)
Advanced Quantitative Data Analysis
 Chapter 24 Advanced Quantitative Data Analysis Daniel Muijs Doing Regression Analysis in SPSS When we want to do regression analysis in SPSS, we have to go through the following steps: 1 As usual, we choose
A Comprehensive Method for Identifying Optimal Areas for Supermarket Development. TRF Policy Solutions April 28, 2011
 A Comprehensive Method for Identifying Optimal Areas for Supermarket Development TRF Policy Solutions April 28, 2011 Profile of TRF The Reinvestment Fund builds wealth and opportunity for lowwealth communities
Identifying, mapping and modelling trajectories of neighbourhood poverty in metropolitan areas: The case of Montreal
 Identifying, mapping and modelling trajectories of neighbourhood poverty in metropolitan areas: The case of Montreal Philippe Apparicio (INRS-UCS) Anne-Marie Séguin (INRS-UCS) Mylène Riva (Centre de recherche
Machine Learning. Clustering 1. Hamid Beigy. Sharif University of Technology. Fall 1395
 Machine Learning Clustering 1 Hamid Beigy Sharif University of Technology Fall 1395 1 Some slides are taken from P. Rai slides Hamid Beigy (Sharif University of Technology) Machine Learning Fall 1395 1
Outline. 15. Descriptive Summary, Design, and Inference. Descriptive summaries. Data mining. The centroid
 Outline 15. Descriptive Summary, Design, and Inference Geographic Information Systems and Science SECOND EDITION Paul A. Longley, Michael F. Goodchild, David J. Maguire, David W. Rhind 2005 John Wiley
Data Mining Classification: Basic Concepts and Techniques. Lecture Notes for Chapter 3. Introduction to Data Mining, 2nd Edition
 Data Mining Classification: Basic Concepts and Techniques Lecture Notes for Chapter 3 by Tan, Steinbach, Karpatne, Kumar 1 Classification: Definition Given a collection of records (training set ) Each
Clustering. Genome 559: Introduction to Statistical and Computational Genomics Elhanan Borenstein. Some slides adapted from Jacques van Helden
 Clustering Genome 559: Introduction to Statistical and Computational Genomics Elhanan Borenstein Some slides adapted from Jacques van Helden Gene expression profiling A quick review Which molecular processes/functions
Models for Count and Binary Data. Poisson and Logistic GWR Models. 24/07/2008 GWR Workshop 1
 Models for Count and Binary Data Poisson and Logistic GWR Models 24/07/2008 GWR Workshop 1 Outline I: Modelling counts Poisson regression II: Modelling binary events Logistic Regression III: Poisson Regression
6.047 / Computational Biology: Genomes, Networks, Evolution Fall 2008
 MIT OpenCourseWare http://ocw.mit.edu 6.047 / 6.878 Computational Biology: Genomes, Networks, Evolution Fall 2008 For information about citing these materials or our Terms of Use, visit: http://ocw.mit.edu/terms.
Factor Analysis. Summary. Sample StatFolio: factor analysis.sgp
 Factor Analysis Summary... 1 Data Input... 3 Statistical Model... 4 Analysis Summary... 5 Analysis Options... 7 Scree Plot... 9 Extraction Statistics... 10 Rotation Statistics... 11 D and 3D Scatterplots...
Computer Vision Group Prof. Daniel Cremers. 14. Clustering
 Group Prof. Daniel Cremers 14. Clustering Motivation Supervised learning is good for interaction with humans, but labels from a supervisor are hard to obtain Clustering is unsupervised learning, i.e. it
Regression Clustering
 Regression Clustering In regression clustering, we assume a model of the form y = f g (x, θ g ) + ɛ g for observations y and x in the g th group. Usually, of course, we assume linear models of the form
Data Matrix User Guide
 Data Matrix User Guide 1. Introduction The 2017 Data Matrix is designed to support the 2017 iteration of the Regional Skills Assessments (RSAs) in Scotland. The RSAs align with the Regional Outcome Agreement
Ethnic and socioeconomic segregation in Belgium A multi-scalar approach using individualised neighbourhoods
 Ethnic and socioeconomic segregation in Belgium A multi-scalar approach using individualised neighbourhoods Rafael Costa and Helga de Valk PAA 2016 Annual Meeting Extended abstract (Draft: please do not
Understanding Your Community A Guide to Data
 Understanding Your Community A Guide to Data Alex Lea September 2013 Research and Insight Team LeicestershireCounty Council Understanding Geographies Important to understand the various geographies that
Description Remarks and examples Reference Also see
 Title stata.com example 38g Random-intercept and random-slope models (multilevel) Description Remarks and examples Reference Also see Description Below we discuss random-intercept and random-slope models
The Church Demographic Specialists
 The Church Demographic Specialists Easy-to-Use Features Map-driven, Web-based Software An Integrated Suite of Information and Query Tools Providing An Insightful Window into the Communities You Serve Key
Clustering and Gaussian Mixture Models
 Clustering and Gaussian Mixture Models Piyush Rai IIT Kanpur Probabilistic Machine Learning (CS772A) Jan 25, 2016 Probabilistic Machine Learning (CS772A) Clustering and Gaussian Mixture Models 1 Recap
Applied Hierarchical Cluster Analysis with Average Linkage Algoritm
 CAUCHY Jurnal Matematika Murni dan Aplikasi Volume 5(1)(2017), Pages 1-7 p-issn: 2086-0382; e-issn: 2477-3344 Applied Hierarchical Cluster Analysis with Average Linkage Algoritm Cindy Cahyaning Astuti
Applied Multivariate Statistical Analysis Richard Johnson Dean Wichern Sixth Edition
 Applied Multivariate Statistical Analysis Richard Johnson Dean Wichern Sixth Edition Pearson Education Limited Edinburgh Gate Harlow Essex CM20 2JE England and Associated Companies throughout the world
LECTURE 4 PRINCIPAL COMPONENTS ANALYSIS / EXPLORATORY FACTOR ANALYSIS
 LECTURE 4 PRINCIPAL COMPONENTS ANALYSIS / EXPLORATORY FACTOR ANALYSIS NOTES FROM PRE- LECTURE RECORDING ON PCA PCA and EFA have similar goals. They are substantially different in important ways. The goal
CS6375: Machine Learning Gautam Kunapuli. Decision Trees
 Gautam Kunapuli Example: Restaurant Recommendation Example: Develop a model to recommend restaurants to users depending on their past dining experiences. Here, the features are cost (x ) and the user s
DIMENSION REDUCTION AND CLUSTER ANALYSIS
 DIMENSION REDUCTION AND CLUSTER ANALYSIS EECS 833, 6 March 2006 Geoff Bohling Assistant Scientist Kansas Geological Survey geoff@kgs.ku.edu 864-2093 Overheads and resources available at http://people.ku.edu/~gbohling/eecs833
CS4445 Data Mining and Knowledge Discovery in Databases. B Term 2014 Solutions Exam 2 - December 15, 2014
 CS4445 Data Mining and Knowledge Discovery in Databases. B Term 2014 Solutions Exam 2 - December 15, 2014 Prof. Carolina Ruiz Department of Computer Science Worcester Polytechnic Institute NAME: Prof.
MLMED. User Guide. Nicholas J. Rockwood The Ohio State University Beta Version May, 2017
 MLMED User Guide Nicholas J. Rockwood The Ohio State University rockwood.19@osu.edu Beta Version May, 2017 MLmed is a computational macro for SPSS that simplifies the fitting of multilevel mediation and
Clustering. Genome 559: Introduction to Statistical and Computational Genomics Elhanan Borenstein. Some slides adapted from Jacques van Helden
 Clustering Genome 559: Introduction to Statistical and Computational Genomics Elhanan Borenstein Some slides adapted from Jacques van Helden Gene expression profiling A quick review Which molecular processes/functions
Population health across space & time: geographical harmonisation of the ONS Longitudinal Study for England & Wales
 British Society for Population Studies Annual Conference, York, September 2011 Population health across space & time: geographical harmonisation of the ONS Longitudinal Study for England & Wales Paul Norman
Clustering. Stephen Scott. CSCE 478/878 Lecture 8: Clustering. Stephen Scott. Introduction. Outline. Clustering.
 1 / 19 sscott@cse.unl.edu x1 If no label information is available, can still perform unsupervised learning Looking for structural information about instance space instead of label prediction function Approaches:
CS626 Data Analysis and Simulation
 CS626 Data Analysis and Simulation Instructor: Peter Kemper R 104A, phone 221-3462, email:kemper@cs.wm.edu Today: Data Analysis: A Summary Reference: Berthold, Borgelt, Hoeppner, Klawonn: Guide to Intelligent
F78SC2 Notes 2 RJRC. If the interest rate is 5%, we substitute x = 0.05 in the formula. This gives
 F78SC2 Notes 2 RJRC Algebra It is useful to use letters to represent numbers. We can use the rules of arithmetic to manipulate the formula and just substitute in the numbers at the end. Example: 100 invested
Text Mining. Dr. Yanjun Li. Associate Professor. Department of Computer and Information Sciences Fordham University
 Text Mining Dr. Yanjun Li Associate Professor Department of Computer and Information Sciences Fordham University Outline Introduction: Data Mining Part One: Text Mining Part Two: Preprocessing Text Data
Chapter 5: Microarray Techniques
 Chapter 5: Microarray Techniques 5.2 Analysis of Microarray Data Prof. Yechiam Yemini (YY) Computer Science Department Columbia University Normalization Clustering Overview 2 1 Processing Microarray Data
Summary and Implications for Policy
 Summary and Implications for Policy 1 Introduction This is the report on a background study for the National Spatial Strategy (NSS) regarding the Irish Rural Structure. The main objective of the study
Measurement and Data. Topics: Types of Data Distance Measurement Data Transformation Forms of Data Data Quality
 Measurement and Data Topics: Types of Data Distance Measurement Data Transformation Forms of Data Data Quality Importance of Measurement Aim of mining structured data is to discover relationships that
SUPERVISED LEARNING: INTRODUCTION TO CLASSIFICATION
 SUPERVISED LEARNING: INTRODUCTION TO CLASSIFICATION 1 Outline Basic terminology Features Training and validation Model selection Error and loss measures Statistical comparison Evaluation measures 2 Terminology
Part I. Linear regression & LASSO. Linear Regression. Linear Regression. Week 10 Based in part on slides from textbook, slides of Susan Holmes
 Week 10 Based in part on slides from textbook, slides of Susan Holmes Part I Linear regression & December 5, 2012 1 / 1 2 / 1 We ve talked mostly about classification, where the outcome categorical. If
Review of Multiple Regression
 Ronald H. Heck 1 Let s begin with a little review of multiple regression this week. Linear models [e.g., correlation, t-tests, analysis of variance (ANOVA), multiple regression, path analysis, multivariate
Data Collection. Lecture Notes in Transportation Systems Engineering. Prof. Tom V. Mathew. 1 Overview 1
 Data Collection Lecture Notes in Transportation Systems Engineering Prof. Tom V. Mathew Contents 1 Overview 1 2 Survey design 2 2.1 Information needed................................. 2 2.2 Study area.....................................
Clustering VS Classification
 MCQ Clustering VS Classification 1. What is the relation between the distance between clusters and the corresponding class discriminability? a. proportional b. inversely-proportional c. no-relation Ans:
Spatial Organization of Data and Data Extraction from Maptitude
 Spatial Organization of Data and Data Extraction from Maptitude N. P. Taliceo Geospatial Information Sciences The University of Texas at Dallas UT Dallas GIS Workshop Richardson, TX March 30 31, 2018 1/
Different Displays of Thematic Maps:
 Different Displays of Thematic Maps: There are a number of different ways to display or classify thematic maps, including: Natural Breaks Equal Interval Quantile Standard Deviation What s important to
Clusters. Unsupervised Learning. Luc Anselin. Copyright 2017 by Luc Anselin, All Rights Reserved
 Clusters Unsupervised Learning Luc Anselin http://spatial.uchicago.edu 1 curse of dimensionality principal components multidimensional scaling classical clustering methods 2 Curse of Dimensionality 3 Curse
An Alternative Algorithm for Classification Based on Robust Mahalanobis Distance
 Dhaka Univ. J. Sci. 61(1): 81-85, 2013 (January) An Alternative Algorithm for Classification Based on Robust Mahalanobis Distance A. H. Sajib, A. Z. M. Shafiullah 1 and A. H. Sumon Department of Statistics,
ANALELE ŞTIINŢIFICE ALE UNIVERSITĂŢII ALEXANDRU IOAN CUZA DIN IAŞI Tomul LII/LIII Ştiinţe Economice 2005/2006
 ANALELE ŞTIINŢIFICE ALE UNIVERSITĂŢII ALEXANDRU IOAN CUZA DIN IAŞI Tomul LII/LIII Ştiinţe Economice 2005/2006 POVERTY MAPPING OF ROMANIAN COUNTIES USING CLUSTER ANALYSIS ALINA MĂRIUCA IONESCU Abstract
Data Mining 4. Cluster Analysis
 Data Mining 4. Cluster Analysis 4.2 Spring 2010 Instructor: Dr. Masoud Yaghini Outline Data Structures Interval-Valued (Numeric) Variables Binary Variables Categorical Variables Ordinal Variables Variables
Typical information required from the data collection can be grouped into four categories, enumerated as below.
 Chapter 6 Data Collection 6.1 Overview The four-stage modeling, an important tool for forecasting future demand and performance of a transportation system, was developed for evaluating large-scale infrastructure
UK Data Archive Study Number British Social Attitudes, British Social Attitudes 2008 User Guide. 2 Data collection methods...
 UK Data Archive Study Number 6390 - British Social Attitudes, 2008 o NatCen National Centre for Social Research British Social Attitudes 2008 User Guide Author: Roger Stafford 1 Overview of the survey...
NAG Library Chapter Introduction. G08 Nonparametric Statistics
 NAG Library Chapter Introduction G08 Nonparametric Statistics Contents 1 Scope of the Chapter.... 2 2 Background to the Problems... 2 2.1 Parametric and Nonparametric Hypothesis Testing... 2 2.2 Types
An Open Source Geodemographic Classification of Small Areas In the Republic of Ireland Chris Brunsdon, Martin Charlton, Jan Rigby
 An Open Source Geodemographic Classification of Small Areas In the Republic of Ireland Chris Brunsdon, Martin Charlton, Jan Rigby National Centre for Geocomputation National University of Ireland, Maynooth
Part 7: Glossary Overview
 Part 7: Glossary Overview In this Part This Part covers the following topic Topic See Page 7-1-1 Introduction This section provides an alphabetical list of all the terms used in a STEPS surveillance with
Taking into account sampling design in DAD. Population SAMPLING DESIGN AND DAD
 Taking into account sampling design in DAD SAMPLING DESIGN AND DAD With version 4.2 and higher of DAD, the Sampling Design (SD) of the database can be specified in order to calculate the correct asymptotic
USING CENSUS OUTPUT AREAS FOR MARKET RESEARCH SAMPLING
 USING CENSUS OUTPUT AREAS FOR MARKET RESEARCH SAMPLING Martin van Staveren Small Area Geography Planning for the Future MRS CGG Seminar, 5 th February 2007 INITIAL USE OF GEODEMOGRAPHICS BMRB was first
Clustering Lecture 1: Basics. Jing Gao SUNY Buffalo
 Clustering Lecture 1: Basics Jing Gao SUNY Buffalo 1 Outline Basics Motivation, definition, evaluation Methods Partitional Hierarchical Density-based Mixture model Spectral methods Advanced topics Clustering
Modern Information Retrieval
 Modern Information Retrieval Chapter 8 Text Classification Introduction A Characterization of Text Classification Unsupervised Algorithms Supervised Algorithms Feature Selection or Dimensionality Reduction
Exploratory Spatial Data Analysis Using GeoDA: : An Introduction
 Exploratory Spatial Data Analysis Using GeoDA: : An Introduction Prepared by Professor Ravi K. Sharma, University of Pittsburgh Modified for NBDPN 2007 Conference Presentation by Professor Russell S. Kirby,
Profiling Burglary in London using Geodemographics
 Profiling Burglary in London using Geodemographics C G Gale *1, A D Singleton 2 and P A Longley 3 1 UCL Department of Civil, Environmental & Geomatic Engineering 2 University of Liverpool Department of
How rural the EU RDP is? An analysis through spatial funds allocation
 How rural the EU RDP is? An analysis through spatial funds allocation Beatrice Camaioni, Roberto Esposti, Antonello Lobianco, Francesco Pagliacci, Franco Sotte Department of Economics and Social Sciences
Multivariate analysis of genetic data: exploring groups diversity
 Multivariate analysis of genetic data: exploring groups diversity T. Jombart Imperial College London Bogota 01-12-2010 1/42 Outline Introduction Clustering algorithms Hierarchical clustering K-means Multivariate
Task 1: Open ArcMap and activate the Spatial Analyst extension.
 Exercise 10 Spatial Analyst The following steps describe the general process that you will follow to complete the exercise. Specific steps will be provided later in the step-by-step instructions component
Energy Use in Homes 2007
 Energy Use in Homes 2007 A series of reports on domestic energy use in England Space and Water Heating Energy Use in Homes 2007 A series of reports on domestic energy use in England This is one of a series
Module 10 Summative Assessment
 Module 10 Summative Assessment Activity In this activity you will use the three dimensions of vulnerability that you learned about in this module exposure, sensitivity, and adaptive capacity to assess
OECD QSAR Toolbox v.4.0. Tutorial on how to predict Skin sensitization potential taking into account alert performance
 OECD QSAR Toolbox v.4.0 Tutorial on how to predict Skin sensitization potential taking into account alert performance Outlook Background Objectives Specific Aims Read across and analogue approach The exercise